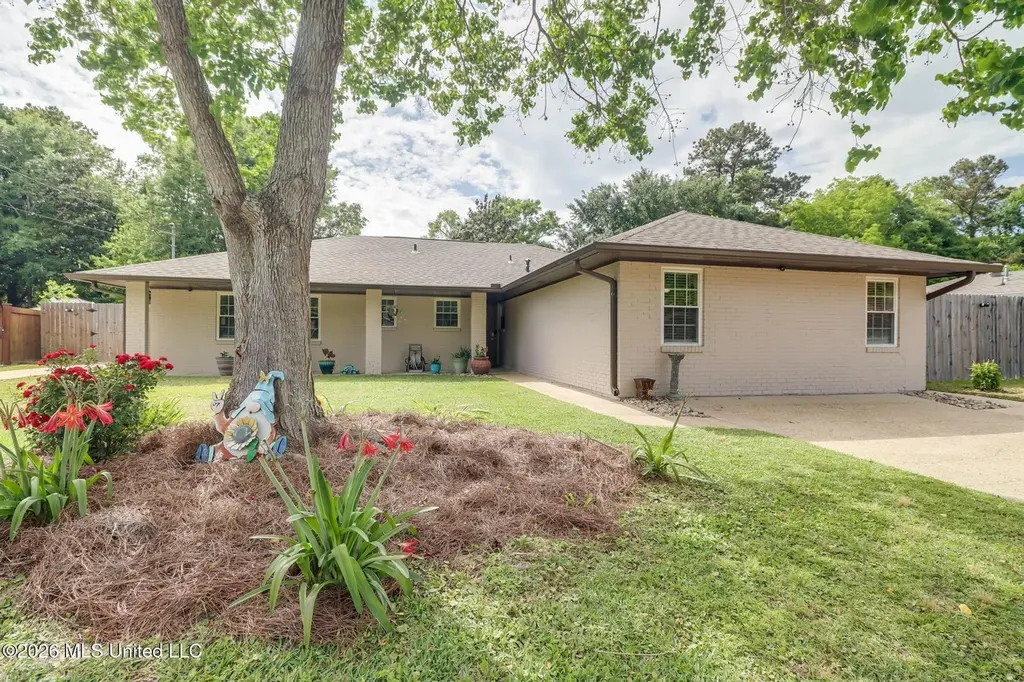
789 Sharon Hills Dr · Biloxi, MS
Flood risk 1/10 · Minimal
- FEMA flood zone
- X (unshaded)
- Chance of flooding over 30 yrs
- 0.0%
- Est. flood insurance / yr
- $507 – $1,088
Fire risk 1/10 · Minimal
- Est. fire insurance / yr
- $1,241 – $2,305
Heat risk 10/10 · Severe
- Hot days now (above 106°F)
- 7 days/yr
- Hot days in 30 yrs
- 22 days/yr
Wind risk 9/10 · Severe
- Chance of severe wind over 30 yrs
- 99.0%
Air-quality risk 3/10 · Minor
- Unhealthy air days now
- 2 days/yr
- Unhealthy air days in 30 yrs
- 3 days/yr
Risk factors via First Street. Map © Google.
Why this score? — see what drove the D+ grade
The composite is a weighted blend of 9 inputs, each scored 0–100. Each bar is that input's sub-score; the figure is the points it added to the 100-point composite (weight × sub-score).
- Cash flow +16.5/30.0
- ARV discount +7.7/15.0
- DSCR +5.1/10.0
- Schools +4.5/10.0
- Livability +4.0/5.0
- 1% rule +3.3/10.0
- Rent growth +3.2/5.0
- Condition / age +2.5/5.0
- Appreciation +0.0/10.0
$255,000
🖨 Deal sheet 📄 Offer letter ✓ Due diligence
Listing remarks MLS
Estate sale! Please bring all offers! Large home in good area. Motivated seller. Nice back yard.
Key facts
- Spacious pantry
- Granite countertops
- 0.27 acre lot
Tags
Neighborhood map
What this means for you Summary
Snapshot
- This is a 3-bed/1.0-bath single-family listed at $255k.
Deal economics
- At list price, monthly cash flow is $147 ($2k/yr) — positive.
- The deal already cash-flows at list — no discount required.
- To meet the 1% rule (rent ≥ 1% of price), the offer needs to be $211k (17.4% below list).
- Recommended offer: $211k (17.4% below list) — sets the bar for 1% rule.
- Cap rate 7.0% vs local median 3.5% in Biloxi — top-decile yield for the area; either an underpriced asset or a hidden risk that comps aren't pricing in. Stress-test before assuming the spread holds.
Location & tenants
- Location reads 79/100 on livability (#6 in MS, #2,141 nationally) — a middle-class / working-renter tenant base. Strengths: crime A+, cost of living A+, housing A+; Watch: commute D+, amenities F, employment D-.
- Biloxi Public School District (urban): math 60% / reading 48% proficiency, ranked #7 of 130 in MS (top 5%) — acceptable for families but not a draw, mixed tenant base, ~2y average lease.
- Zoned schools: North Bay Elementary School (math 67% / reading 67%, grade B+, #11 of 375 statewide, top 3%, 754 students, 100% FRL); Biloxi Junior High (math 60% / reading 43%, grade C, #27 of 179 statewide, top 16%, 881 students, 100% FRL); Biloxi High School (math 65% / reading 53%, grade C+, #7 of 197 statewide, top 3%, 1,728 students, 100% FRL) — zoned schools average 100% FRL vs 59% district-wide (40 pts higher); higher-poverty schools than district average — tighter screening recommended.
- Market conditions: Rents rising (+3.0%/yr); 392 active listings in the ZIP; 8 comparable units currently listed for rent nearby; rentals lingering (median 44d on market — plan ~5-8 weeks vacancy on turnover, expect pricing pressure); 50% of comp listings sitting > 30 days — soft ceiling on asking rent; 2,194 units permitted in Harrison County in 2024 (0 in 5+ unit buildings).
- This rent runs 37% of the median local income ($69k/yr) — at the standard rent-burdened threshold; future hikes will face affordability resistance.
Forward outlook
- Local home prices are declining (-3.0%/yr); year-one equity from $2k of loan paydown is wiped out by about $8k of value loss. Plan a longer hold.
- Harrison County population projected at +27% by 2050 — long-run rental-demand tailwind backs the buy-and-hold thesis.
Negotiation context
- Only 5 days on market — expect competitive offers; lowballing is unlikely to land.
- 2 sale attempts since 9y ago with the ask held roughly flat each time — persistent listings suggest the price (not the market) is what's stuck; bring a comps-based counter.
- Current owner paid $115k; list at $255k implies a 122% gain — meaningful room to come down on a strong offer.
Risks & watch-outs
- Climate carrying-cost: severe wind risk, 99% chance of damaging wind over 30y; extreme-heat days projected 7→22/yr by 2055 (HVAC capex compounding) — expect insurance premiums to compound above CPI over the hold.
Questions for the listing agent
- Built in 1972 — when were the roof, HVAC, electrical panel, plumbing, and water heater last replaced?
- Is there a deadline driving the sale (1031 exchange, divorce, estate, relocation)? That informs how much negotiation room exists.
- The area grade is low — what's the realistic commute time and amenity access for the typical tenant pool here? Any planned neighborhood developments (good or bad) we should know about?
- What's the average days-on-market for RENTAL listings here right now (not sales)? A rising rental-DOM trend means longer vacancies and softer asking-rent achievability than the comps imply.
- What's the recent tenant-quality profile in this submarket — average credit score on applications, eviction rate, late-payment / NSF rate, and stable-employment percentage? A property-management company in the area should have these aggregated.
- How much new for-sale + rental construction is in the pipeline within 1–3 miles? Heavy new supply typically softens prices + rents 12–24 months out; constrained supply supports both.
Investment metrics
- 1% rule
- 0.83% ✗
- Cap rate
- 6.99%
- Cash-on-cash
- 2.48%
- DSCR
- 1.11
- GRM
- 10.1
CMA / ARV
- ARV (on-the-fly)
- $256,128
- Comps found
- 12
Show comp detail 12 sales within ~0.75 mi
| Address | Dist | Beds/Ba | Sqft | Sold | Price | $/sf | Match |
|---|---|---|---|---|---|---|---|
| 789 Sharon Hills Dr | 0.00mi | 4/2.0 (+1) | 1,876 (+1%) | 0mo | $255,000 | $136 | 89 |
| 757 Canterbury Dr | 0.10mi | 3/2.0 | 1,920 (+3%) | 2mo | $265,000 | $138 | 84 |
| 726 Sharon Hills Dr | 0.12mi | 4/2.0 (+1) | 1,822 (-2%) | 1mo | $246,500 | $135 | 81 |
| 707 Holly Hills Dr | 0.28mi | 3/2.0 | 1,723 (-7%) | 1mo | $365,000 | $212 | 70 |
| 830 Bluewood Dr | 0.28mi | 3/2.0 | 1,734 (-7%) | 2mo | $230,000 | $133 | 70 |
| 856 Rustwood Dr | 0.41mi | 4/2.0 (+1) | 1,837 (-1%) | 2mo | $249,900 | $136 | 68 |
| 2082 Juniper Dr | 0.56mi | 4/2.0 (+1) | 1,841 (-1%) | 5mo | $275,000 | $149 | 60 |
| 712 Champagne Dr | 0.39mi | 3/2.0 | 2,102 (+13%) | 1mo | $360,000 | $171 | 55 |
| 2185 Baywood Dr | 0.47mi | 3/2.0 | 1,596 (-14%) | 1mo | $224,900 | $141 | 50 |
| 833 Bilglade Dr | 0.74mi | 3/2.0 | 1,772 (-4%) | 6mo | $199,000 | $112 | 49 |
| 882 Rustwood Dr | 0.50mi | 3/2.0 | 2,087 (+12%) | 6mo | $245,000 | $117 | 47 |
| 2090 Woodfield Ln | 0.69mi | 3/2.0 | 1,694 (-9%) | 4mo | $279,900 | $165 | 46 |
Match score weights: distance 35% · size 25% · config 20% · recency 20%. Top-matched comps best support the ARV.
Projected returns pro-forma
-3.0% appreciation · 2.98% rent growth · sell at horizon
- IRR
- -12.5%
- Equity multiple
- 0.55×
- Total profit
- $-32,100
- Equity at exit
- $38,021
- IRR
- -3.5%
- Equity multiple
- 0.77×
- Total profit
- $-16,527
- Equity at exit
- $22,048
Cash invested: $71,400 (down + closing). Projections, not guarantees.
Landlord ↔ Tenant lean methodology
- Overall (STATE)
- 90 Strongly Landlord-Friendly
- State Mississippi
- 90 Strongly Landlord-Friendly · R+11
- County
- — inherits STATE
- City
- — inherits STATE
ZIP-level market 39532
- Rents YoY
- 3.0%
- Active inventory
- 392
- Price-to-rent
- 10.1×
Monthly cashflow live
- Estimated rent
- $2,107 high interval (Pro) →
- Mortgage (P&I)
- −$1,337
- Tax from tax record
- −$74 /mo · $888/yr
- Insurance
- −$106
- HOA
- −$0
- Vacancy / Maint / Mgmt
- −$443
- Net cashflow
- $147
Break-even live
UW: 25.0% down · 7.5% · 30yr · 1.5% tax · 5.0% vac · 8.0% maint · 8.0% mgmt
Financing live
Cash to close
- Down payment
- $63,750
- Closing costs
- $7,650
- Reserves months
- —
- Total cash needed
- —
Loan-product check · same deal, 3 products live
Conventional
25% down · 7.5% · 30yr
- Down + closing
- —
- Monthly P&I
- —
- Monthly cashflow
- —
- DSCR
- —
- Eligible?
- —
Personal DTI + credit; lowest rate.
DSCR
20% down · 8.5% · 30yr
- Down + closing
- —
- Monthly P&I
- —
- Monthly cashflow
- —
- DSCR
- —
- Eligible?
- —
No personal income docs; deal must DSCR.
Hard money
10% down · 12.0% · 12mo
- Down + closing
- —
- Monthly P&I
- —
- Monthly cashflow
- —
- DSCR
- —
- Eligible?
- —
Short-term bridge; refi at stabilization.
Rent comps 8 comps
| Address | Beds | Baths | Sqft | Rent | $/sqft | DOM | Units | Dist |
|---|---|---|---|---|---|---|---|---|
| 860 Leeward Dr Biloxi, MS | 4.0 | 2.0 | 1885 | $2,650 | $1.41 | 13d | 1 | 0.38mi |
| 2171 Popps Ferry Rd Biloxi, MS | 4.0 | 2.0 | 1625 | $1,600 | $0.98 | 43d | 1 | 0.55mi |
| 1955 Popps Ferry Rd Biloxi, MS | 1.0–3.0 | 1.0–2.0 | 1347 | $1,647 | $1.22 | 43d | 1 | 0.56mi |
| 2411 Sunkist Country Club Rd Biloxi, MS | 3.0 | 2.0 | 1592 | $1,800 | $1.13 | 43d | 1 | 1.38mi |
| 1735 Tribe Dr Biloxi, MS | 3.0 | 2.0 | 1290 | $2,195 | $1.70 | 13d | 12 | 1.43mi |
| 495 Popps Ferry Rd #77 Biloxi, MS | 2.0 | 2.5 | 1524 | $2,000 | $1.31 | 21d | 1 | 1.48mi |
| 630 Bay Cove Dr #313 Biloxi, MS | 3.0 | 2.0 | 2310 | $3,450 | $1.49 | 21d | 1 | 1.48mi |
| 630 Bay Cove Dr Biloxi, MS | 2.0–3.0 | 2.0 | 1780 | $3,450 | $1.94 | 43d | 2 | 1.48mi |
Listing history 5 events
-
2026-04-28status Pending
-
2026-04-23$255,000 Active
-
2017-07-26soldstatus $115,000
-
2017-07-21soldstatus 96-char remark
Show marketing remark (96 chars)
Estate sale! Please bring all offers! Large home in good area. Motivated seller. Nice back yard.
-
2017-05-09$125,000 96-char remark
Show marketing remark (96 chars)
Estate sale! Please bring all offers! Large home in good area. Motivated seller. Nice back yard.
ⓘ Source: listings_history table (triggers on properties + properties_extension) + one-shot
backfill from property_details.listing_events for pre-trigger history.
Tax reassessment forecast MS · Resets to sale price
- Current annual tax
- $888 · $74/mo
- Projected year-2 tax
- $2,015 · $168/mo
- Expected delta
- +$1,126/yr (+$94/mo · 126.8%)
ⓘ Screening estimate from a state-policy table — verify with the county assessor before closing.
Climate risk First Street
- Flood 1/10 Low FEMA zone X (unshaded) · 0% chance over 30 yrs
- Wildfire 1/10 Low
- Heat 10/10 Extreme 7 d/yr ≥106°F today · 22 d/yr by 30 yrs out
- Wind 9/10 Extreme 99% chance of damaging wind over 30 yrs
- Air quality 3/10 Moderate 2 unhealthy d/yr today · 3 by 30 yrs out
Nearby sold comps map
Loading sold comps map…
Walkable amenities ~0.75 mi
Loading nearby amenities…
Taxation est. · year 1
- Rental income
- $25,289
- − Mortgage interest
- −$14,284
- − Property taxes
- −$888
- − Insurance
- −$1,275
- − Repairs & maintenance
- −$2,023
- − Management
- −$2,023
- − Depreciation
- −$7,418
- Taxable loss
- −$2,623
- Est. tax savings @ 24.0%
- +$630
- After-tax cash flow
- $2,397/yr
For passive investors: Depreciation is non-cash, so a rental often shows a tax loss while cash-flowing — sheltering income. Rental losses are passive: they offset passive income freely, and up to $25,000/yr can offset ordinary (W-2) income if you actively participate and your MAGI is under $100k (phasing out to $0 by $150k); unused losses carry forward. On sale, claimed depreciation is recaptured at up to 25%, and gains may owe capital-gains tax (a 1031 exchange can defer both). Figures are a year-1 estimate at your 24.0% rate — not tax advice; consult a CPA.
Schools (NCES district)
- District
- Biloxi Public School District
- NCES district ID
- 2800630
- Math proficiency
- 60% ▼ -7.00%
- Reading proficiency
- 48% ▼ -3.00%
- Median HH income
- $40,608
- Composite
- 45.26/100
- National rank
- #2657
- State rank
- #7 of 130 in MS
Livability — Biloxi
- Score
- 79/100
- State rank
- #6
- US rank
- #2141
Category grades
Schools grade is shown separately in the Schools card above.
Census & demographics
- Census place
- Biloxi, MS
- County
- Harrison County · 178,171 people
- City population
- 63,281
- Metro
- Gulfport-Biloxi, MS
- Population (ZIP)
- 36,662
- Household income
- $68,710
- Rent vs Own
- Severe rent burden
- 954.0
Population outlook (Harrison County) Hauer SSP2
- Today (2025)
- 228,444 people
- By 2030
- 241,942 · +5.9%
- By 2040
- 267,531 · +17.1%
- By 2050
- 291,062 · +27.4%
- By 2075
- 346,711 · +51.8%
- By 2100
- 378,165 · +65.5%
Race, ethnicity, and origin ACS 2023
- Neighborhood character
- Predominantly White (69%)
- Race & ethnicity
- White 69% Black 15% Two or more races 9% Hispanic / Latino 6% Asian 4%
- Hispanic origin (detail)
- Mexican 2%
- Common ancestry
- Lithuanian 5% Italian 2% Serbian 2%
- Foreign-born
- 4% · Vietnam, Canada
- Languages at home
- 94% English-only · Spanish 2% Vietnamese 1% Other Indo-European 1%
Political lean MEDSL · Harrison
- 2024 margin
- Strong R (+28.9) · D 35.0% · R 63.9% · Other 1.1%
- 2008→2024 swing
- -2.9pp toward R · 2008: -26.0pp · 2024: -28.9pp
- All cycles
- 2024: R+28.9 2020: R+25.2 2016: R+30.7 2012: R+26.6 2008: R+26.0
Not yet ingested
- Civics
- —
Market trends
- HPI YoY
- ▼ -90.04%
- Current HPI
- 154.9975
- Rent YoY
- ▲ 2.98%
- Metro
- Gulfport-Biloxi, MS
- State GDP YoY
- —
- F500 in state
- 0
Price history
+104.0% since first listed5 events — show timeline
- 2026-04-28 Pending — MLSU
- 2026-04-23 Listed $255,000 MLSU
- 2017-07-26 Sold (Public Records) $115,000 Public Records
- 2017-07-21 Sold (MLS) — MLSU
- 2017-05-09 Listed $125,000 MLSU
Property tax history
-4.9%/yrLatest (2025): $888 · +4.5% YoY. Source: county tax records.
Cash-flow waterfall
monthlySold comps — $/sqft
last 12 mo · ≤1 miLoading sold comps…