 Duplex
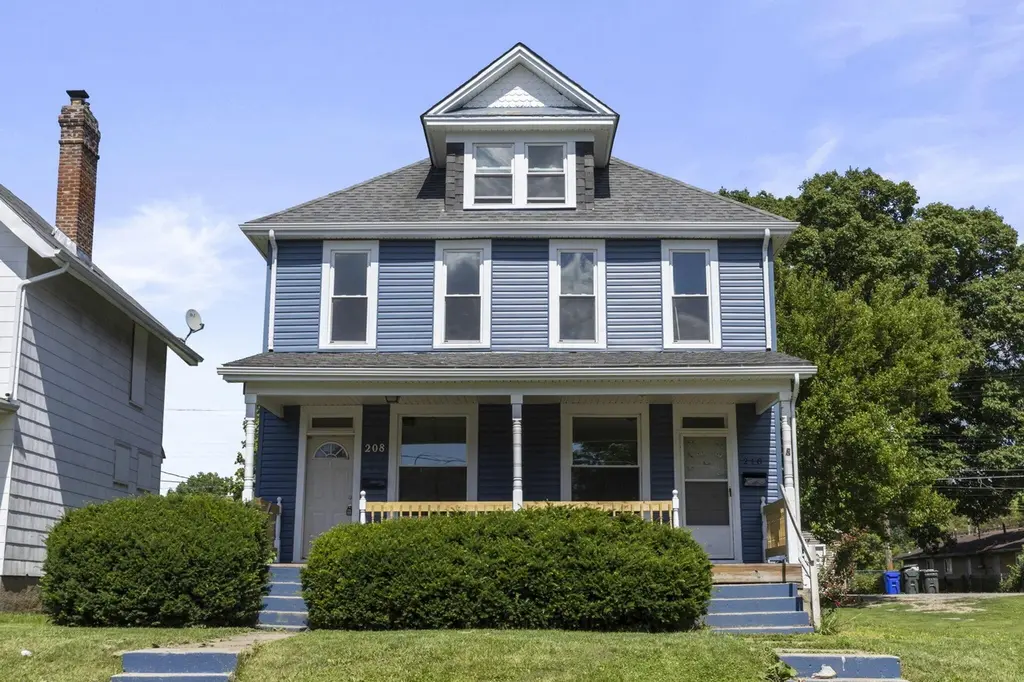
208-210 Dana Ave · Columbus, OH
Flood risk 5/10 · Moderate
- FEMA flood zone
- X
- Chance of flooding over 30 yrs
- 0.49%
- Est. flood insurance / yr
- $473 – $860
Fire risk 1/10 · Minimal
- Est. fire insurance / yr
- $713 – $1,323
Heat risk 4/10 · Minor
- Hot days now (above 100°F)
- 7 days/yr
- Hot days in 30 yrs
- 18 days/yr
Wind risk 2/10 · Minimal
- Chance of severe wind over 30 yrs
- 1.0%
Air-quality risk 3/10 · Minor
- Unhealthy air days now
- 2 days/yr
- Unhealthy air days in 30 yrs
- 4 days/yr
Risk factors via First Street. Map © Google.
Why this score? — see what drove the B- grade
The composite is a weighted blend of 9 inputs, each scored 0–100. Each bar is that input's sub-score; the figure is the points it added to the 100-point composite (weight × sub-score).
- Cash flow +27.4/30.0
- ARV discount +12.8/15.0
- DSCR +9.6/10.0
- 1% rule +7.1/10.0
- Livability +4.0/5.0
- Rent growth +3.7/5.0
- Condition / age +2.5/5.0
- Schools +1.7/10.0
- Appreciation +0.0/10.0
$244,900
🖨 Deal sheet 📄 Offer letter ✓ Due diligence
Multi-family units
County records classify this as Multi-Family (2-4 Unit). Listing-text estimate: 2 units. confirmed
Listing remarks MLS
NICE DOUBLE, YOU BE THE LANDLORD, LIVE ON ONE SIDE, RENT THE OTHER. UNIT 208 HAS NEWER KITCHEN, ALSO CARPET AND TILE, NEWER FURNACE/CA 1999, UNIT 210 HAS OLDER FURNACE. PORCHES, FENCED YARD. BRING OFFER.
Key facts
- New siding
- New flooring
- New gutters
Tags
Property features AI
Finance
- Other: Two total units
- Financial info:
- HOA & community:
Exterior
- Parking:
- Security:
- Utilities: Water available; Public sewer; Natural gas available; Electricity available
- Home design: Duplex; Built in 1918
- Construction:
- Exterior features: Lot in the Franklinton subdivision; Cross street: Town
Interior
- Kitchen:
- Bedrooms:
- Flooring:
- Bathrooms:
- Heating & cooling: Central Air; Forced Air
- Interior features: Central air conditioning; Forced-air heating
- Laundry & utility:
Neighborhood map
What this means for you Summary
Snapshot
- This is a 2 × 3-bed/1.0-bath units multifamily listed at $245k.
Deal economics
- At list price, monthly cash flow is $717 ($9k/yr) — positive. Per door: $358/mo.
- The deal already cash-flows at list — no discount required.
- Meets the 1% rule at list price ($3k rent vs $245k).
- Recommended offer: $241k (1.5% below list) — sets the bar for market timing.
- Cap rate 9.8% vs local median 3.8% in Columbus — top-decile yield for the area; either an underpriced asset or a hidden risk that comps aren't pricing in. Stress-test before assuming the spread holds.
Location & tenants
- Location reads 81/100 on livability (#97 in OH, #1,491 nationally) — a professional / high-income tenant draw. Strengths: commute A+, cost of living A+, housing A+; Watch: employment C-, crime F.
- Columbus City School District (urban): math 15% / reading 26% proficiency, ranked #626 of 656 in OH (top 95%) — low school quality limits family demand, transient renter base, plan for 1-2y turnover; 72% free/reduced lunch — lower-income household profile, screen leases tightly.
- Market conditions: Rents rising fast (+4.6%/yr); 144 active listings in the ZIP; 2 comparable units currently listed for rent nearby; 8,139 units permitted in Franklin County in 2024 (5,940 in 5+ unit buildings).
- At $2,960/mo this rent would consume 76% of the median local household income ($47k/yr) (locally 1689% of renters already pay >50% of income on rent) — very limited rent-growth headroom before tenants either downsize or default.
Forward outlook
- Local home prices are declining (-3.0%/yr); year-one equity from $2k of loan paydown is wiped out by about $7k of value loss. Plan a longer hold.
- Franklin County population projected at +34% by 2050 — long-run rental-demand tailwind backs the buy-and-hold thesis.
- At projected returns (-3.0% appreciation + 4.6% rent growth), your $69k cash investment doubles in ~8 years — after that, you're playing with house money.
Negotiation context
- It's been on market 15 days — a 2% lower offer ($241k) is reasonable based on typical stale-listing flexibility.
- 4 sale attempts since 25y ago with the ask held roughly flat each time — persistent listings suggest the price (not the market) is what's stuck; bring a comps-based counter.
- Current owner paid $70k; list at $245k implies a 247% gain — meaningful room to come down on a strong offer.
Risks & watch-outs
- Watch-outs: built in 1918 — expect roof / HVAC / electrical / plumbing capex.
- Climate carrying-cost: moderate flood risk — expect insurance premiums to compound above CPI over the hold.
Questions for the listing agent
- Can we see the unit-by-unit rent roll, current vacancy, and any below-market leases? What's the average tenancy length?
- What capital expenditures (roof, boiler, parking lot, exteriors) have been made in the last 5 years, and what's planned in the next 2?
- Built in 1918 — when were the roof, HVAC, electrical panel, plumbing, and water heater last replaced?
- Is there a deadline driving the sale (1031 exchange, divorce, estate, relocation)? That informs how much negotiation room exists.
- Crime grade is F in this area — have there been break-ins, vandalism, or insurance claims at this property in the last 3 years? What carrier currently insures it and at what premium?
- What's the average days-on-market for RENTAL listings here right now (not sales)? A rising rental-DOM trend means longer vacancies and softer asking-rent achievability than the comps imply.
- What's the recent tenant-quality profile in this submarket — average credit score on applications, eviction rate, late-payment / NSF rate, and stable-employment percentage? A property-management company in the area should have these aggregated.
- How much new apartment / multifamily construction is in the pipeline within 1–3 miles? Heavy new supply (>2% of stock underway) typically softens rents 12–24 months out; light construction supports rent growth.
Investment metrics
- 1% rule
- 1.21% ✓
- Cap rate
- 9.81%
- Cash-on-cash
- 12.54%
- DSCR
- 1.56
- GRM
- 6.9
CMA / ARV
- ARV (on-the-fly)
- $277,620
- Comps found
- 12
Show comp detail 12 sales within ~0.75 mi
| Address | Dist | Beds/Ba | Sqft | Sold | Price | $/sf | Match |
|---|---|---|---|---|---|---|---|
| 113-115 W Park Ave | 0.16mi | 6/— | 2,576 (-3%) | 2mo | $310,000 | $120 | 86 |
| 111-113 S Princeton Ave | 0.14mi | 6/— | 2,528 (-4%) | 2mo | $200,000 | $79 | 85 |
| 53-55 W Park Ave | 0.24mi | 6/— | 2,610 (-1%) | 9mo | $330,000 | $126 | 80 |
| 186-188 W Park Ave | 0.15mi | 6/— | 2,758 (+4%) | 8mo | $350,000 | $127 | 79 |
| 59-61 N Princeton Ave | 0.38mi | 6/— | 2,718 (+3%) | 8mo | $60,000 | $22 | 71 |
| 58-60 W Park Ave | 0.25mi | 6/— | 2,580 (-2%) | 17mo | $270,000 | $105 | 70 |
| 411-413 Ryan Ave | 0.51mi | 6/— | 2,646 (+0%) | 12mo | $187,000 | $71 | 66 |
| 266-268 Brehl Ave | 0.10mi | 6/— | 2,352 (-11%) | 14mo | $310,000 | $132 | 65 |
| 91-93 N Central Ave | 0.46mi | 6/— | 2,912 (+10%) | 3mo | $299,900 | $103 | 59 |
| 53-55 Hawkes Ave | 0.55mi | 6/— | 2,856 (+8%) | 6mo | $330,000 | $116 | 56 |
| 78-80 Stevens Ave | 0.50mi | 6/— | 2,352 (-11%) | 6mo | $240,000 | $102 | 53 |
| 135-137 S Dakota Ave | 0.39mi | 6/— | 2,956 (+12%) | 14mo | $165,000 | $56 | 50 |
Match score weights: distance 35% · size 25% · config 20% · recency 20%. Top-matched comps best support the ARV.
Projected returns pro-forma
-3.0% appreciation · 4.61% rent growth · sell at horizon
- IRR
- 4.0%
- Equity multiple
- 1.16×
- Total profit
- $10,841
- Equity at exit
- $36,515
- IRR
- 14.9%
- Equity multiple
- 2.30×
- Total profit
- $88,889
- Equity at exit
- $21,174
Cash invested: $68,572 (down + closing). Projections, not guarantees.
Landlord ↔ Tenant lean methodology
- Overall (STATE)
- 73 Landlord-Friendly
- State Ohio
- 73 Landlord-Friendly · R+6
- County
- — inherits STATE
- City
- — inherits STATE
ZIP-level market 43223
- Rents YoY
- 4.6%
- Active inventory
- 144
- Price-to-rent
- 13.8×
Monthly cashflow live
- Estimated rent
- $2,960 high interval (Pro) →
- Mortgage (P&I)
- −$1,284
- Tax from tax record
- −$235 /mo · $2,823/yr
- Insurance
- −$102
- HOA
- −$0
- Vacancy / Maint / Mgmt
- −$622
- Net cashflow
- $717
Break-even live
2-unit breakdown (identical units grouped — click to expand)
| Units | Beds | Baths | Est. rent |
|---|---|---|---|
| 2× units | 3 | 1 | $2,960 |
| #1 | 3 | 1 | $1,480 |
| #2 | 3 | 1 | $1,480 |
| Total (2 units) | $2,960 | ||
UW: 25.0% down · 7.5% · 30yr · 1.5% tax · 5.0% vac · 8.0% maint · 8.0% mgmt
Financing live
Cash to close
- Down payment
- $61,225
- Closing costs
- $7,347
- Reserves months
- —
- Total cash needed
- —
Loan-product check · same deal, 3 products live
Conventional
25% down · 7.5% · 30yr
- Down + closing
- —
- Monthly P&I
- —
- Monthly cashflow
- —
- DSCR
- —
- Eligible?
- —
Personal DTI + credit; lowest rate.
DSCR
20% down · 8.5% · 30yr
- Down + closing
- —
- Monthly P&I
- —
- Monthly cashflow
- —
- DSCR
- —
- Eligible?
- —
No personal income docs; deal must DSCR.
Hard money
10% down · 12.0% · 12mo
- Down + closing
- —
- Monthly P&I
- —
- Monthly cashflow
- —
- DSCR
- —
- Eligible?
- —
Short-term bridge; refi at stabilization.
Rent comps 2 comps
| Address | Beds | Baths | Sqft | Rent | $/sqft | DOM | Units | Dist |
|---|---|---|---|---|---|---|---|---|
| 63 Stevens Ave Columbus, OH | 5.0 | 2.0 | 2437 | $2,000 | $0.82 | 7d | 1 | 0.48mi |
| 228 Schultz Ave Unit 1407033P Columbus, OH | 5.0 | 1.5 | 1991 | $5,806 | $2.92 | 7d | 1 | 0.70mi |
Listing history 11 events
-
2026-06-18days on market $244,900 Active 15 DOM
-
2026-06-17days on market $244,900 Active 14 DOM
-
2026-06-16days on market $244,900 Active 13 DOM
-
2026-06-15days on market $244,900 Active 12 DOM
-
2026-06-13days on market $244,900 Active 10 DOM
-
2026-06-13days on market $244,900 Active 9 DOM
-
2026-06-09days on market $244,900 Active 6 DOM
-
2026-06-08days on market $244,900 Active 5 DOM
-
2026-06-07days on market $244,900 Active 4 DOM
-
2026-06-05remarks 669-char remark
-
2026-06-05$244,900 Active 1 DOM
ⓘ Source: listings_history table (triggers on properties + properties_extension) + one-shot
backfill from property_details.listing_events for pre-trigger history.
Tax reassessment forecast OH · Partial reset (capped growth)
- Current annual tax
- $2,823 · $235/mo
- Projected year-2 tax
- $3,322 · $277/mo
- Expected delta
- +$498/yr (+$42/mo · 17.7%)
ⓘ Screening estimate from a state-policy table — verify with the county assessor before closing.
Climate risk First Street
- Flood 5/10 Major FEMA zone X · 49% chance over 30 yrs
- Wildfire 1/10 Low
- Heat 4/10 Moderate 7 d/yr ≥100°F today · 18 d/yr by 30 yrs out
- Wind 2/10 Low 100% chance of damaging wind over 30 yrs
- Air quality 3/10 Moderate 2 unhealthy d/yr today · 4 by 30 yrs out
Nearby sold comps map
Loading sold comps map…
Walkable amenities ~0.75 mi
Loading nearby amenities…
Taxation est. · year 1
- Rental income
- $35,520
- − Mortgage interest
- −$13,718
- − Property taxes
- −$2,823
- − Insurance
- −$1,224
- − Repairs & maintenance
- −$2,842
- − Management
- −$2,842
- − Depreciation
- −$7,124
- Taxable income
- $4,946
- Est. tax owed @ 24.0%
- −$1,187
- After-tax cash flow
- $7,414/yr
For passive investors: Depreciation is non-cash, so a rental often shows a tax loss while cash-flowing — sheltering income. Rental losses are passive: they offset passive income freely, and up to $25,000/yr can offset ordinary (W-2) income if you actively participate and your MAGI is under $100k (phasing out to $0 by $150k); unused losses carry forward. On sale, claimed depreciation is recaptured at up to 25%, and gains may owe capital-gains tax (a 1031 exchange can defer both). Figures are a year-1 estimate at your 24.0% rate — not tax advice; consult a CPA.
Schools (NCES district)
- District
- Columbus City School District
- NCES district ID
- 3904380
- Math proficiency
- 15% ▼ -17.00%
- Reading proficiency
- 26% ▼ -12.00%
- Median HH income
- $38,483
- Composite
- 17.19/100
- National rank
- #9105
- State rank
- #626 of 656 in OH
Livability — Columbus
- Score
- 81/100
- State rank
- #97
- US rank
- #1491
Category grades
Schools grade is shown separately in the Schools card above.
Census & demographics
- Census place
- Columbus, OH
- County
- Franklin County · 1,351,780 people
- City population
- 612,189
- Metro
- Columbus, OH
- Population (ZIP)
- 28,187
- Household income
- $46,911
- Rent vs Own
- Severe rent burden
- 1689.0
Population outlook (Franklin County) Hauer SSP2
- Today (2025)
- 1,456,139 people
- By 2030
- 1,556,890 · +6.9%
- By 2040
- 1,757,349 · +20.7%
- By 2050
- 1,950,539 · +34.0%
- By 2075
- 2,376,171 · +63.2%
- By 2100
- 2,636,796 · +81.1%
Race, ethnicity, and origin ACS 2023
- Neighborhood character
- Diverse neighborhood (Simpson 0.55)
- Race & ethnicity
- White 63% Black 22% Two or more races 8% Hispanic / Latino 8%
- Hispanic origin (detail)
- Mexican 4% Puerto Rican 3%
- Common ancestry
- Romanian 4% Italian 1% Slovak 1%
- Foreign-born
- 5% · Canada
- Languages at home
- 91% English-only · Spanish 5%
Political lean MEDSL · Franklin
- 2024 margin
- Strong D (+28.4) · D 63.7% · R 35.3% · Other 1.0%
- 2008→2024 swing
- +7.7pp toward D · 2008: 20.7pp · 2024: 28.4pp
- All cycles
- 2024: D+28.4 2020: D+31.4 2016: D+25.9 2012: D+21.7 2008: D+20.7
Not yet ingested
- Civics
- —
Market trends
- HPI YoY
- ▼ -135.33%
- Current HPI
- 211.6742
- Rent YoY
- ▲ 4.61%
- Metro
- Columbus, OH
- State GDP YoY
- ▲ 1.98%
- F500 in state
- 48
Industry mix (Fortune 500 HQ in OH)
| Industry | F500 HQs | Revenue |
|---|---|---|
| Insurance | 3 | $145B |
|
||
| Industrial Machinery | 3 | $49B |
|
||
| Financial Services | 3 | $24B |
|
||
| Consumer Goods | 2 | $93B |
|
||
| Aerospace / Defense | 2 | $47B |
|
||
| Utilities | 2 | $33B |
|
||
Price history
+527.9% since first listed10 events — show timeline
- 2026-06-03 Listed $244,900 CBRMLS
- 2006-11-17 Listing Removed — CBRMLS
- 2006-05-16 Listed $85,000 CBRMLS
- 2003-06-03 Sold (Public Records) $70,500 Public Records
- 2003-05-29 Sold (MLS) $70,500 CBRMLS
- 2003-04-21 Listing Removed — CBRMLS
- 2003-02-14 Listed $69,900 CBRMLS
- 2001-03-22 Listing Removed — CBRMLS
- 2001-02-23 Listed $76,900 CBRMLS
- 1997-10-31 Sold (Public Records) $39,000 Public Records
Property tax history
+22.2%/yrLatest (2024): $2,823 · -25.1% YoY. Source: county tax records.
Cash-flow waterfall
monthlySold comps — $/sqft
last 12 mo · ≤1 miLoading sold comps…