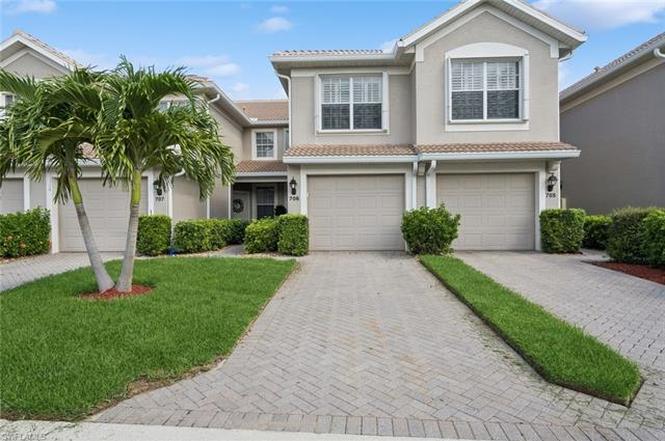
11023 Mill Creek Way #706 · Fort Myers, FL
Flood risk 1/10 · Minimal
- FEMA flood zone
- AE
- Chance of flooding over 30 yrs
- 0.0%
- Est. flood insurance / yr
- $1,737 – $8,500
Fire risk 4/10 · Minor
- Est. fire insurance / yr
- $947 – $1,759
Heat risk 10/10 · Severe
- Hot days now (above 107°F)
- 7 days/yr
- Hot days in 30 yrs
- 31 days/yr
Wind risk 10/10 · Severe
- Chance of severe wind over 30 yrs
- 99.0%
Air-quality risk 2/10 · Minimal
- Unhealthy air days now
- 1 days/yr
- Unhealthy air days in 30 yrs
- 1 days/yr
Risk factors via First Street. Map © Google.
Why this score? — see what drove the B grade
The composite is a weighted blend of 9 inputs, each scored 0–100. Each bar is that input's sub-score; the figure is the points it added to the 100-point composite (weight × sub-score).
- Cash flow +30.0/30.0
- 1% rule +10.0/10.0
- DSCR +10.0/10.0
- ARV discount +7.5/15.0
- Livability +4.3/5.0
- Schools +4.1/10.0
- Rent growth +2.6/5.0
- Condition / age +2.5/5.0
- Appreciation +0.0/10.0
$225,000
🖨 Deal sheet 📄 Offer letter ✓ Due diligence
Listing remarks
Welcome to your carefree southwest Florida lifestyle in Mill Creek at Colonial Country Club! This desirable first floor unit is perfect as a year-round residence or a winter getaway, and is being sold turnkey/fully-furnished! The open concept floor plan is excellent for entertaining, featuring 3 distinct dining areas including a breakfast nook, breakfast bar and a formal dining room. The Den makes for a perfect home office, TV room or an extra convertible guest bedroom. The split plan ensures both bedrooms plenty of privacy with two spacious baths, with the master ensuite bath featuring a walk-in closet. A large, screened lanai overlooks the wetlands/preserve area and the 2.3 mile preserve
Key facts
- Breakfast nook
- Screened lanai
- First floor unit
Tags
Neighborhood map
What this means for you Summary
Snapshot
- This is a 2-bed/2.0-bath condo listed at $225k.
Deal economics
- At list price, monthly cash flow is $1k ($13k/yr) — positive.
- The deal already cash-flows at list — no discount required.
- Meets the 1% rule at list price ($5k rent vs $225k).
- Recommended offer: $205k (9.0% below list) — sets the bar for market timing.
- Cap rate 14.2% vs local median 3.0% in Fort Myers — top-decile yield for the area; either an underpriced asset or a hidden risk that comps aren't pricing in. Stress-test before assuming the spread holds.
Location & tenants
- Location reads 86/100 on livability (#14 in FL, #383 nationally) — a professional / high-income tenant draw. Strengths: amenities A+, commute A+, housing A+.
- Lee (suburban): math 47% / reading 50% proficiency, ranked #42 of 73 in FL (top 58%) — families likely to look elsewhere, expect single-tenant / working-renter base with shorter leases.
- Market conditions: Rents flat; 811 active listings in the ZIP; 40 comparable units currently listed for rent nearby; rentals at typical pace (median 24d on market — plan ~3-4 weeks tenant-placement turnaround); high-income renter base; 15,411 units permitted in Lee County in 2024 (4,686 in 5+ unit buildings).
- At $4,528/mo this rent would consume 49% of the median local household income ($110k/yr) (locally 276% of renters already pay >50% of income on rent) — very limited rent-growth headroom before tenants either downsize or default.
Forward outlook
- Local home prices are declining (-3.0%/yr); year-one equity from $2k of loan paydown is wiped out by about $7k of value loss. Plan a longer hold.
- Lee County population projected at +44% by 2050 — long-run rental-demand tailwind backs the buy-and-hold thesis.
- At projected returns (-3.0% appreciation + 0.4% rent growth), your $63k cash investment doubles in ~9 years — after that, you're playing with house money.
Negotiation context
- It's been on market 102 days — a 9% lower offer ($205k) is reasonable based on typical stale-listing flexibility.
- 2 sale attempts; this cycle's ask has dropped $25k (10%) from the opening price — seller is motivated, your offer sets the floor, not the list.
Risks & watch-outs
- Watch-outs: flood insurance adds $427/mo.
- Climate carrying-cost: in FEMA flood zone AE (mandatory federal flood insurance); severe wind risk, 99% chance of damaging wind over 30y; extreme-heat days projected 7→31/yr by 2055 (HVAC capex compounding) — expect insurance premiums to compound above CPI over the hold.
Questions for the listing agent
- It's been on market 102 days. Have you received any prior offers? Is the seller open to a 9% concession, seller financing, or rate buy-down credit?
- What's the actual annual flood-insurance premium (NFIP or private), and is the property in a SFHA with mandatory coverage?
- What does the HOA fee cover, when was the last increase, and are there any pending special assessments or reserve-fund shortfalls?
- Any open or pending special assessments — roof, HVAC, plumbing, elevator, façade? What's the per-unit balance and payoff schedule, and is the seller paying it off at close or rolling it to the buyer?
- Why hasn't it sold? Are there any deal-killer items the seller is aware of (foundation, flood, title, zoning, code violations)?
- Is there a deadline driving the sale (1031 exchange, divorce, estate, relocation)? That informs how much negotiation room exists.
- What's the average days-on-market for RENTAL listings here right now (not sales)? A rising rental-DOM trend means longer vacancies and softer asking-rent achievability than the comps imply.
- What's the recent tenant-quality profile in this submarket — average credit score on applications, eviction rate, late-payment / NSF rate, and stable-employment percentage? A property-management company in the area should have these aggregated.
- How much new apartment / multifamily construction is in the pipeline within 1–3 miles? Heavy new supply (>2% of stock underway) typically softens rents 12–24 months out; light construction supports rent growth.
Investment metrics
- 1% rule
- 2.01% ✓
- Cap rate
- 14.25%
- Cash-on-cash
- 28.41%
- DSCR
- 2.26
- GRM
- 4.1
CMA / ARV
No comps found within radius.
Projected returns pro-forma
-3.0% appreciation · 0.37% rent growth · sell at horizon
- IRR
- 8.6%
- Equity multiple
- 1.32×
- Total profit
- $20,334
- Equity at exit
- $33,548
- IRR
- 14.6%
- Equity multiple
- 1.99×
- Total profit
- $62,241
- Equity at exit
- $19,454
Cash invested: $63,000 (down + closing). Projections, not guarantees.
Landlord ↔ Tenant lean methodology
- Overall (STATE)
- 87 Strongly Landlord-Friendly
- State Florida
- 87 Strongly Landlord-Friendly · R+3
- County
- — inherits STATE
- City
- — inherits STATE
ZIP-level market 33913
- Home prices YoY
- -10.3%
- Rents YoY
- 0.4%
- Active inventory
- 811
- Price-to-rent
- 4.1×
Monthly cashflow live
- Estimated rent
- $4,528 high interval (Pro) →
- Mortgage (P&I)
- −$1,180
- Tax from tax record
- −$403 /mo · $4,839/yr
- Insurance
- −$94
- Flood insurance flood zone
- −$427 /mo · $5,118/yr
- HOA
- −$409
- Vacancy / Maint / Mgmt
- −$951
- Net cashflow
- $1,065
Break-even live
UW: 25.0% down · 7.5% · 30yr · 1.5% tax · 5.0% vac · 8.0% maint · 8.0% mgmt
Financing live
Cash to close
- Down payment
- $56,250
- Closing costs
- $6,750
- Reserves months
- —
- Total cash needed
- —
Loan-product check · same deal, 3 products live
Conventional
25% down · 7.5% · 30yr
- Down + closing
- —
- Monthly P&I
- —
- Monthly cashflow
- —
- DSCR
- —
- Eligible?
- —
Personal DTI + credit; lowest rate.
DSCR
20% down · 8.5% · 30yr
- Down + closing
- —
- Monthly P&I
- —
- Monthly cashflow
- —
- DSCR
- —
- Eligible?
- —
No personal income docs; deal must DSCR.
Hard money
10% down · 12.0% · 12mo
- Down + closing
- —
- Monthly P&I
- —
- Monthly cashflow
- —
- DSCR
- —
- Eligible?
- —
Short-term bridge; refi at stabilization.
Rent comps 40 comps
| Address | Beds | Baths | Sqft | Rent | $/sqft | DOM | Units | Dist |
|---|---|---|---|---|---|---|---|---|
| 11029 Mill Creek Way #405 Fort Myers, FL | 2.0 | 2.0 | 1749 | $2,500 | $1.43 | 23d | 1 | 0.09mi |
| 10128 Colonial Country Club Blvd #602 Fort Myers, FL | 2.0 | 2.0 | 1530 | $4,600 | $3.01 | 23d | 1 | 0.10mi |
| 10130 Colonial Country Club Blvd #707 Fort Myers, FL | 2.0 | 2.0 | 1116 | $4,900 | $4.39 | 23d | 1 | 0.11mi |
| 10112 Colonial Country Club Blvd #209 Fort Myers, FL | 2.0 | 2.0 | 1530 | $5,000 | $3.27 | 23d | 1 | 0.13mi |
| 11033 Mill Creek Way #202 Fort Myers, FL | 2.0 | 2.0 | 1379 | $5,400 | $3.92 | 23d | 1 | 0.15mi |
| 10121 Colonial Country Club Blvd #1802 Fort Myers, FL | 2.0 | 2.0 | 1530 | $4,800 | $3.14 | 3d | 1 | 0.15mi |
| 10020 Horse Creek Rd Fort Myers, FL | 2.0 | 2.0 | 1692 | $2,500 | $1.48 | 23d | 1 | 0.16mi |
| 11012 Mill Creek Way #2205 Fort Myers, FL | 2.0 | 2.0 | 1749 | $5,500 | $3.14 | 23d | 1 | 0.16mi |
| 11011 Mill Creek Way #1307 Fort Myers, FL | 2.0 | 2.0 | 1379 | $5,000 | $3.63 | 23d | 1 | 0.19mi |
| 10111 Colonial Country Club Blvd #2308 Fort Myers, FL | 2.0 | 2.0 | 1309 | $2,000 | $1.53 | 11d | 1 | 0.20mi |
| 11075 Lancewood St Fort Myers, FL | 3.0 | 2.0 | 1575 | $2,300 | $1.46 | 23d | 1 | 0.29mi |
| 11075 Lancewood St Fort Myers, FL | 3.0 | 2.0 | 1575 | $2,300 | $1.46 | 15d | 1 | 0.29mi |
| 9667 Hemingway Ln Unit 3107 Fort Myers, FL | 2.0 | 2.0 | 1209 | $4,900 | $4.05 | 23d | 1 | 0.32mi |
| 9661 Hemingway Ln #3207 Fort Myers, FL | 2.0 | 2.0 | 1300 | $3,900 | $3.00 | 3d | 1 | 0.33mi |
| 9639 Hemingway Ln #3505 Fort Myers, FL | 2.0 | 2.0 | 1234 | $4,800 | $3.89 | 23d | 1 | 0.38mi |
| 11041 Iron Horse Way Fort Myers, FL | 2.0 | 2.0 | 1692 | $4,000 | $2.36 | 23d | 1 | 0.40mi |
| 10280 Crepe Jasmine Ln Unit 1546286P Fort Myers, FL | 3.0 | 2.0 | 1571 | $4,526 | $2.88 | 15d | 1 | 0.43mi |
| 9918 Horse Creek Rd Fort Myers, FL | 3.0 | 2.0 | 1510 | $2,200 | $1.46 | 23d | 1 | 0.47mi |
| 10602 Camarelle Cir Fort Myers, FL | 2.0 | 2.0 | 1690 | $5,500 | $3.25 | 23d | 1 | 0.52mi |
| 9582 Hemingway Ln #3402 Fort Myers, FL | 2.0 | 2.0 | 1382 | $5,500 | $3.98 | 23d | 1 | 0.58mi |
| 9582 Hemingway Ln #3403 Fort Myers, FL | 2.0 | 2.0 | 1385 | $5,400 | $3.90 | 14d | 1 | 0.58mi |
| 9582 Hemingway Ln #3403 Fort Myers, FL | 2.0 | 2.0 | 1385 | $5,400 | $3.90 | 23d | 1 | 0.58mi |
| 10053 Majestic Ave Fort Myers, FL | 2.0 | 2.0 | 1692 | $7,400 | $4.37 | 23d | 1 | 0.60mi |
| 10063 Majestic Ave Fort Myers, FL | 2.0 | 2.0 | 1692 | $7,100 | $4.20 | 23d | 1 | 0.61mi |
| 10514 Bella Vista Dr Fort Myers, FL | 3.0 | 2.0 | 1823 | $6,500 | $3.57 | 23d | 1 | 0.65mi |
| 10518 Avila Cir Fort Myers, FL | 2.0 | 2.0 | 1466 | $6,500 | $4.43 | 3d | 1 | 0.81mi |
| 10518 Avila Cir Fort Myers, FL | 2.0 | 2.0 | 1466 | $6,500 | $4.43 | 23d | 1 | 0.81mi |
| 11280 Reflection Isles Blvd Fort Myers, FL | 3.0 | 2.0 | 1670 | $3,500 | $2.10 | 23d | 1 | 0.83mi |
| 10700 Palazzo Way #201 Fort Myers, FL | 2.0 | 2.0 | 1390 | $5,000 | $3.60 | 21d | 1 | 0.83mi |
| 10711 Palazzo Way Fort Myers, FL | 2.0 | 2.0 | 1257 | $3,900 | $3.10 | 15d | 2 | 0.86mi |
| 10711 Palazzo Way Unit 203 Fort Myers, FL | 2.0 | 2.0 | 1257 | $5,300 | $4.22 | 21d | 1 | 0.86mi |
| 10018 Oakhurst Way Fort Myers, FL | 3.0 | 2.0 | 1512 | $2,975 | $1.97 | 23d | 1 | 0.86mi |
| 10535 Carolina Willow Dr Fort Myers, FL | 3.0 | 2.0 | 1290 | $2,300 | $1.78 | 21d | 1 | 0.90mi |
| 10751 Palazzo Way #103 Fort Myers, FL | 2.0 | 2.0 | 1235 | $5,000 | $4.05 | 23d | 1 | 0.91mi |
| 10025 Oakhurst Way Fort Myers, FL | 2.0 | 2.0 | 1504 | $7,100 | $4.72 | 23d | 1 | 0.91mi |
| 10791 Palazzo Way #301 Fort Myers, FL | 2.0 | 2.0 | 1390 | $5,300 | $3.81 | 23d | 1 | 1.02mi |
| 10510 Amiata Way #302 Fort Myers, FL | 2.0 | 2.0 | 1245 | $4,900 | $3.94 | 23d | 1 | 1.03mi |
| 11230 Suffield St Fort Myers, FL | 2.0 | 2.0 | 1560 | $8,500 | $5.45 | 23d | 1 | 1.08mi |
| 10530 Amiata Way #103 Fort Myers, FL | 2.0 | 2.0 | 1248 | $2,200 | $1.76 | 23d | 1 | 1.09mi |
| 10072 Oakhurst Way Fort Myers, FL | 2.0 | 2.0 | 1511 | $7,400 | $4.90 | 23d | 1 | 1.10mi |
HOA detail condo
- Monthly dues
- $409 · $4,908/yr
- Assessments
- None detected in remarks — confirm with the listing agent.
Listing history 9 events
-
2026-05-22soldstatus $222,000 Sold
-
2026-05-06status Pending
-
2026-04-22status Pending With Contingencies
-
2026-02-11price $225,000
-
2026-01-10$250,000 Active
-
2026-01-06historical $4,900
-
2025-10-19price $4,900
-
2025-10-09price $5,400
-
2025-08-22$5,500
ⓘ Source: listings_history table (triggers on properties + properties_extension) + one-shot
backfill from property_details.listing_events for pre-trigger history.
Tax reassessment forecast FL · Resets to sale price
- Current annual tax
- $4,839 · $403/mo
- Projected year-2 tax
- $4,839 · $403/mo
- Expected delta
- $0/yr ($0/mo · 0.0%)
ⓘ Screening estimate from a state-policy table — verify with the county assessor before closing.
Climate risk First Street
- Flood 1/10 Low FEMA zone AE · 0% chance over 30 yrs
- Wildfire 4/10 Moderate
- Heat 10/10 Extreme 7 d/yr ≥107°F today · 31 d/yr by 30 yrs out
- Wind 10/10 Extreme 99% chance of damaging wind over 30 yrs
- Air quality 2/10 Low 1 unhealthy d/yr today · 1 by 30 yrs out
Nearby sold comps map
Loading sold comps map…
Walkable amenities ~0.75 mi
Loading nearby amenities…
Taxation est. · year 1
- Rental income
- $54,337
- − Mortgage interest
- −$12,603
- − Property taxes
- −$4,839
- − Insurance
- −$6,244
- − Repairs & maintenance
- −$4,347
- − Management
- −$4,347
- − HOA
- −$4,908
- − Depreciation
- −$6,545
- Taxable income
- $10,504
- Est. tax owed @ 24.0%
- −$2,521
- After-tax cash flow
- $10,256/yr
For passive investors: Depreciation is non-cash, so a rental often shows a tax loss while cash-flowing — sheltering income. Rental losses are passive: they offset passive income freely, and up to $25,000/yr can offset ordinary (W-2) income if you actively participate and your MAGI is under $100k (phasing out to $0 by $150k); unused losses carry forward. On sale, claimed depreciation is recaptured at up to 25%, and gains may owe capital-gains tax (a 1031 exchange can defer both). Figures are a year-1 estimate at your 24.0% rate — not tax advice; consult a CPA.
Schools (NCES district)
- District
- Lee
- NCES district ID
- 1201080
- Math proficiency
- 47% ▼ -11.00%
- Reading proficiency
- 50% ▼ -4.00%
- Median HH income
- $49,518
- Composite
- 41.49/100
- National rank
- #3458
- State rank
- #42 of 73 in FL
Livability — Fort Myers
- Score
- 86/100
- State rank
- #14
- US rank
- #383
Category grades
Schools grade is shown separately in the Schools card above.
Census & demographics
- Census place
- Fort Myers, FL
- County
- Lee County · 788,662 people
- City population
- 278,598
- Metro
- Cape Coral-Fort Myers, FL
- Population (ZIP)
- 31,538
- Household income
- $110,373
- Rent vs Own
- Severe rent burden
- 276.0
Population outlook (Lee County) Hauer SSP2
- Today (2025)
- 871,946 people
- By 2030
- 955,468 · +9.6%
- By 2040
- 1,113,587 · +27.7%
- By 2050
- 1,256,891 · +44.1%
- By 2075
- 1,560,270 · +78.9%
- By 2100
- 1,726,848 · +98.0%
Race, ethnicity, and origin ACS 2023
- Neighborhood character
- Predominantly White (74%)
- Race & ethnicity
- White 74% Hispanic / Latino 13% Two or more races 11% Black 5% Asian 2%
- Hispanic origin (detail)
- Mexican 3% Puerto Rican 3% Cuban 2%
- Common ancestry
- Romanian 5% Lithuanian 3% Slovak 2%
- Foreign-born
- 14% · Canada, Vietnam, China
- Languages at home
- 84% English-only · Spanish 10% Other Indo-European 2% French/Haitian/Cajun 2%
Political lean MEDSL · Lee
- 2024 margin
- Strong R (+28.4) · D 35.5% · R 63.9%
- 2008→2024 swing
- -18.0pp toward R · 2008: -10.4pp · 2024: -28.4pp
- All cycles
- 2024: R+28.4 2020: R+19.2 2016: R+20.4 2012: R+16.6 2008: R+10.4
Not yet ingested
- Civics
- —
Market trends
- HPI YoY
- ▼ -25.45%
- Current HPI
- 221.7115
- Rent YoY
- ▲ 0.37%
- Metro
- Cape Coral-Fort Myers, FL
- State GDP YoY
- ▲ 3.28%
- F500 in state
- 36
Industry mix (Fortune 500 HQ in FL)
| Industry | F500 HQs | Revenue |
|---|---|---|
| Industrial Technology | 2 | $29B |
|
||
| Insurance | 2 | $17B |
|
||
| Retail | 1 | $60B |
|
||
| Technology Distribution | 1 | $58B |
|
||
| Homebuilding | 1 | $35B |
|
||
| Technology Manufacturing | 1 | $35B |
|
||
Price history
+3936.4% since first listed9 events — show timeline
- 2026-05-22 Sold (MLS) $222,000 NAPLESMLS
- 2026-05-06 Pending — NAPLESMLS
- 2026-04-22 Pending — NAPLESMLS
- 2026-02-11 Price Changed $225,000 NAPLESMLS
- 2026-01-10 Listed $250,000 NAPLESMLS
- 2026-01-06 Rental Removed $4,900 NAPLESMLS
- 2025-10-19 Price Changed $4,900 NAPLESMLS
- 2025-10-09 Price Changed $5,400 NAPLESMLS
- 2025-08-22 Listed for Rent $5,500 NAPLESMLS
Property tax history
+3.1%/yrLatest (2025): $4,839 · -13.5% YoY. Source: county tax records.
Cash-flow waterfall
monthlySold comps — $/sqft
last 12 mo · ≤1 miLoading sold comps…