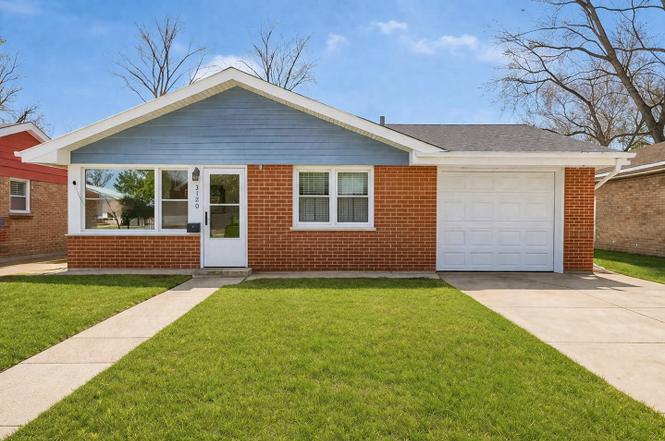
3120 Florence Ave · Steger, IL
Flood risk 4/10 · Minor
- FEMA flood zone
- X (unshaded)
- Chance of flooding over 30 yrs
- 0.24%
- Est. flood insurance / yr
- $473 – $860
Fire risk 1/10 · Minimal
- Est. fire insurance / yr
- $804 – $1,492
Heat risk 3/10 · Minor
- Hot days now (above 101°F)
- 7 days/yr
- Hot days in 30 yrs
- 16 days/yr
Wind risk 2/10 · Minimal
- Chance of severe wind over 30 yrs
- —
Air-quality risk 2/10 · Minimal
- Unhealthy air days now
- 2 days/yr
- Unhealthy air days in 30 yrs
- 2 days/yr
Risk factors via First Street. Map © Google.
Why this score? — see what drove the D grade
The composite is a weighted blend of 9 inputs, each scored 0–100. Each bar is that input's sub-score; the figure is the points it added to the 100-point composite (weight × sub-score).
- Cash flow +15.6/30.0
- ARV discount +7.7/15.0
- 1% rule +4.8/10.0
- DSCR +4.8/10.0
- Livability +3.4/5.0
- Rent growth +2.5/5.0
- Condition / age +2.5/5.0
- Schools +0.7/10.0
- Appreciation +0.0/10.0
$168,900
🖨 Deal sheet (PDF) 📄 Offer letter ✓ Due diligence
Listing remarks
Bright and inviting 3-bedroom ranch with a seamless one-level layout, abundant natural light, and a spacious backyard perfect for entertaining. Private driveway and garage add everyday convenience. A standout feature-this home includes leased solar panels, offering energy efficiency and potential savings on utility costs. A great opportunity for buyers looking for comfort, value, and long-term benefits. Schedule your showing today-this one won't last.
Key facts
- Spacious backyard
- Private driveway
- Leased solar panels
Tags
Property features AI
Finance
- Other: Assessors' living area source; Total finished area reported as 1,017
- HOA & community: No master association fee required
Exterior
- Parking: Attached garage (garage owned); total of 1 parking space on property; Concrete parking surfaces
- Utilities: Public water; Public sewer; Electric with circuit breakers
- Home design: Detached single-family home; One-story; Fee simple ownership; Property currently leased
- Construction: Built approximately 61–70 years ago (built before 1978); Vinyl siding with brick accents; Asphalt roof; Concrete perimeter foundation
- Exterior features: Patio; Lot dimensions approximately 50 x 125
Interior
- Kitchen: Range; Dishwasher; Refrigerator; Eating area / table space
- Bedrooms: Three bedrooms (all on the main level); Master bedroom on the main level
- Flooring: Laminate flooring overall; Vinyl flooring in the kitchen and laundry; Wood laminate in the living room
- Bathrooms: One full bathroom
- Heating & cooling: Forced air heating; Natural gas heating; Solar (house has solar)
- Interior features: Five total rooms; School bus service and commuter bus access nearby; Street lights, curbs, sidewalks, and paved streets in the neighborhood
- Laundry & utility: In-unit laundry with gas dryer hookup and utility sink; Washer and dryer included
Neighborhood map
What this means for you Summary
Snapshot
- This is a 3-bed/1.0-bath single-family listed at $169k.
Deal economics
- At list price, monthly cash flow is $71 ($854/yr) — positive.
- The deal already cash-flows at list — no discount required.
- To meet the 1% rule (rent ≥ 1% of price), the offer needs to be $165k (2.1% below list).
- Recommended offer: $154k (9.0% below list) — sets the bar for market timing.
- Cap rate 6.8% vs local median 5.4% in Steger — meaningfully above typical; check what's discounted (condition, days-on-market, listing class) to confirm the premium yield is real.
Location & tenants
- Location reads 67/100 on livability (#498 in IL) — a middle-class / working-renter tenant base. Strengths: commute A+, cost of living A+, housing A+; Watch: employment C-, health & safety D+, schools F.
- Bloom Twp Hsd 206 (suburban): math 8% / reading 9% proficiency, ranked #591 of 620 in IL (top 95%) — low school quality limits family demand, transient renter base, plan for 1-2y turnover.
- Market conditions: 43 active listings in the ZIP; 6 comparable units currently listed for rent nearby; rentals at typical pace (median 25d on market — plan ~3-4 weeks tenant-placement turnaround); 6,272 units permitted in Cook County in 2024 (4,658 in 5+ unit buildings).
Forward outlook
- Local home prices are declining (-3.0%/yr); year-one equity from $1k of loan paydown is wiped out by about $5k of value loss. Plan a longer hold.
Negotiation context
- It's been on market 105 days — a 9% lower offer ($154k) is reasonable based on typical stale-listing flexibility.
- 4 sale attempts since 4y ago with the ask held roughly flat each time — persistent listings suggest the price (not the market) is what's stuck; bring a comps-based counter.
- Current owner paid $99k; list at $169k implies a 71% gain — meaningful room to come down on a strong offer.
Questions for the listing agent
- It's been on market 105 days. Have you received any prior offers? Is the seller open to a 9% concession, seller financing, or rate buy-down credit?
- Built in 1963 — when were the roof, HVAC, electrical panel, plumbing, and water heater last replaced?
- Why hasn't it sold? Are there any deal-killer items the seller is aware of (foundation, flood, title, zoning, code violations)?
- Is there a deadline driving the sale (1031 exchange, divorce, estate, relocation)? That informs how much negotiation room exists.
- Schools are F-rated, which usually means shorter tenancies and higher turnover. Who's the typical renter profile here, and what's been the actual vacancy rate?
- The area grade is low — what's the realistic commute time and amenity access for the typical tenant pool here? Any planned neighborhood developments (good or bad) we should know about?
- What's the average days-on-market for RENTAL listings here right now (not sales)? A rising rental-DOM trend means longer vacancies and softer asking-rent achievability than the comps imply.
- What's the recent tenant-quality profile in this submarket — average credit score on applications, eviction rate, late-payment / NSF rate, and stable-employment percentage? A property-management company in the area should have these aggregated.
- How much new for-sale + rental construction is in the pipeline within 1–3 miles? Heavy new supply typically softens prices + rents 12–24 months out; constrained supply supports both.
Investment metrics
- 1% rule
- 0.98% ✗
- Cap rate
- 6.80%
- Cash-on-cash
- 1.81%
- DSCR
- 1.08
- GRM
- 8.5
CMA / ARV
- ARV (on-the-fly)
- $169,839
- Comps found
- 12
Show comp detail 12 sales within ~0.75 mi
| Address | Dist | Beds/Ba | Sqft | Sold | Price | $/sf | Match |
|---|---|---|---|---|---|---|---|
| 3129 Butler Ave | 0.09mi | 3/1.0 | 1,017 (0%) | 4mo | $167,500 | $165 | 92 |
| 3144 Phillips Ave | 0.09mi | 3/1.5 | 1,008 (-1%) | 8mo | $215,000 | $213 | 86 |
| 3228 Butler Ave | 0.16mi | 3/1.0 | 1,032 (+2%) | 7mo | $215,000 | $208 | 84 |
| 3241 Wallace Ave | 0.20mi | 3/1.5 | 1,152 (+13%) | 1mo | $115,000 | $100 | 66 |
| 3128 Peoria St | 0.63mi | 3/1.0 | 1,008 (-1%) | 11mo | $173,000 | $172 | 60 |
| 3035 Peoria St | 0.61mi | 4/2.0 (+1) | 1,000 (-2%) | 3mo | $170,000 | $170 | 57 |
| 3500 Butler Ave | 0.47mi | 3/1.0 | 1,130 (+11%) | 9mo | $98,500 | $87 | 52 |
| 241 Tiverton Ln | 0.74mi | 2/1.0 (-1) | 1,031 (+1%) | 10mo | $165,000 | $160 | 50 |
| 212 Durham Dr | 0.63mi | 3/1.0 | 896 (-12%) | 3mo | $149,900 | $167 | 49 |
| 248 Dorsetshire St | 0.66mi | 2/1.0 (-1) | 926 (-9%) | 3mo | $60,000 | $65 | 47 |
| 329 Dorsetshire Dr | 0.75mi | 3/1.0 | 864 (-15%) | 3mo | $82,500 | $95 | 38 |
| 3545 Halsted Blvd | 0.73mi | 4/2.0 (+1) | 1,153 (+13%) | 10mo | $225,000 | $195 | 26 |
Match score weights: distance 35% · size 25% · config 20% · recency 20%. Top-matched comps best support the ARV.
Projected returns pro-forma
-3.0% appreciation · 3.0% rent growth · sell at horizon
- IRR
- -13.4%
- Equity multiple
- 0.52×
- Total profit
- $-22,770
- Equity at exit
- $25,184
- IRR
- -4.4%
- Equity multiple
- 0.71×
- Total profit
- $-13,720
- Equity at exit
- $14,603
Cash invested: $47,292 (down + closing). Projections, not guarantees.
Landlord ↔ Tenant lean methodology
- Overall (STATE)
- 43 Moderately Tenant-Leaning
- State Illinois
- 43 Moderately Tenant-Leaning · D+7
- County
- — inherits STATE
- City
- — inherits STATE
ZIP-level market 60475
- Active inventory
- 43
- Price-to-rent
- 8.5×
Monthly cashflow live
- Estimated rent
- $1,654 high interval (Pro) →
- Mortgage (P&I)
- −$886
- Tax from tax record
- −$279 /mo · $3,351/yr
- Insurance
- −$70
- HOA
- −$0
- Vacancy / Maint / Mgmt
- −$347
- Net cashflow
- $71
Break-even live
Sensitivity live
| Price | -10% $167 | -5% $119 | +0% $71 | +5% $23 | +10% $-24 |
|---|---|---|---|---|---|
| Rent | -10% $-59 | -5% $6 | +0% $71 | +5% $136 | +10% $202 |
| Rate | -1.0pp $156 | -0.5pp $114 | base $71 | +0.5pp $27 | +1.0pp $-17 |
UW: 25.0% down · 7.5% · 30yr · 1.5% tax · 5.0% vac · 8.0% maint · 8.0% mgmt
Financing live
Cash to close
- Down payment
- $42,225
- Closing costs
- $5,067
- Reserves months
- —
- Total cash needed
- —
Loan-product check · same deal, 3 products live
Conventional
25% down · 7.5% · 30yr
- Down + closing
- —
- Monthly P&I
- —
- Monthly cashflow
- —
- DSCR
- —
- Eligible?
- —
Personal DTI + credit; lowest rate.
DSCR
20% down · 8.5% · 30yr
- Down + closing
- —
- Monthly P&I
- —
- Monthly cashflow
- —
- DSCR
- —
- Eligible?
- —
No personal income docs; deal must DSCR.
Hard money
10% down · 12.0% · 12mo
- Down + closing
- —
- Monthly P&I
- —
- Monthly cashflow
- —
- DSCR
- —
- Eligible?
- —
Short-term bridge; refi at stabilization.
Rent comps 6 comps
| Address | Beds | Baths | Sqft | Rent | $/sqft | DOM | Units | Dist |
|---|---|---|---|---|---|---|---|---|
| 3135 Chicago Rd Unit 2nd Steger, IL | 2.0 | 1.0 | 1300 | $1,650 | $1.27 | 25d | 1 | 0.33mi |
| 22 E 35th St Steger, IL | 2.0 | 1.0 | 740 | $1,250 | $1.69 | 25d | 1 | 0.49mi |
| 3763 Emerald Ave Steger, IL | 3.0 | 1.0 | 1125 | $1,950 | $1.73 | 25d | 1 | 0.94mi |
| 236 Chestnut Ave Unit S South Chicago Heights, IL | 3.0 | 1.0 | 1032 | $2,000 | $1.94 | 25d | 1 | 0.97mi |
| 316 W 34th St Steger, IL | 3.0 | 1.0–1.5 | 720 | $1,715 | $2.38 | 2d | 5 | 1.12mi |
| 169 E 23rd St Unit 1F Chicago Heights, IL | 3.0 | 1.0 | 1200 | $1,550 | $1.29 | 13d | 1 | 1.42mi |
Listing history 29 events
-
2026-06-18days on market $168,900 Active 105 DOM
-
2026-06-17days on market $168,900 Active 104 DOM
-
2026-06-16days on market $168,900 Active 103 DOM
-
2026-06-15days on market $168,900 Active 102 DOM
-
2026-06-13days on market $168,900 Active 100 DOM
-
2026-06-13days on market $168,900 Active 99 DOM
-
2026-06-09statusdays on market $168,900 Active 96 DOM
-
2026-06-08days on market $168,900 Contingent - Continue to Show 95 DOM
-
2026-06-07days on market $168,900 Contingent - Continue to Show 94 DOM
-
2026-06-04days on market $168,900 Contingent - Continue to Show 91 DOM
-
2026-06-03days on market $168,900 Contingent - Continue to Show 90 DOM
-
2026-06-02days on market $168,900 Contingent - Continue to Show 89 DOM
-
2026-06-01days on market $168,900 Contingent - Continue to Show 88 DOM
-
2026-05-31days on market $168,900 Contingent - Continue to Show 87 DOM
-
2026-05-19historical Contingent - Continue to Show
-
2026-04-09price $168,900
-
2026-03-05$170,000 Active
-
2026-03-05historical
-
2026-02-01Active
-
2026-01-13historical
-
2025-11-14price
-
2025-10-14Active
-
2022-05-11soldstatus $99,000
-
2022-05-09soldstatus $99,000 Closed
-
2022-04-01historical Contingent - Continue to Show
-
2022-03-28$109,900 Active
-
1992-06-04soldstatus $162,000
-
1984-08-02soldstatus $48,000
-
1984-07-01soldstatus $48,000
ⓘ Source: listings_history table (triggers on properties + properties_extension) + one-shot
backfill from property_details.listing_events for pre-trigger history.
Tax reassessment forecast IL · Partial reset (capped growth)
- Current annual tax
- $3,351 · $279/mo
- Projected year-2 tax
- $3,592 · $299/mo
- Expected delta
- +$242/yr (+$20/mo · 7.2%)
ⓘ Screening estimate from a state-policy table — verify with the county assessor before closing.
Climate risk First Street
- Flood 4/10 Moderate FEMA zone X (unshaded) · 24% chance over 30 yrs
- Wildfire 1/10 Low
- Heat 3/10 Moderate 7 d/yr ≥101°F today · 16 d/yr by 30 yrs out
- Wind 2/10 Low
- Air quality 2/10 Low 2 unhealthy d/yr today · 2 by 30 yrs out
Nearby sold comps map
Loading sold comps map…
Walkable amenities ~0.75 mi
Loading nearby amenities…
Taxation est. · year 1
- Rental income
- $19,845
- − Mortgage interest
- −$9,461
- − Property taxes
- −$3,351
- − Insurance
- −$844
- − Repairs & maintenance
- −$1,588
- − Management
- −$1,588
- − Depreciation
- −$4,913
- Taxable loss
- −$1,899
- Est. tax savings @ 24.0%
- +$456
- After-tax cash flow
- $1,310/yr
For passive investors: Depreciation is non-cash, so a rental often shows a tax loss while cash-flowing — sheltering income. Rental losses are passive: they offset passive income freely, and up to $25,000/yr can offset ordinary (W-2) income if you actively participate and your MAGI is under $100k (phasing out to $0 by $150k); unused losses carry forward. On sale, claimed depreciation is recaptured at up to 25%, and gains may owe capital-gains tax (a 1031 exchange can defer both). Figures are a year-1 estimate at your 24.0% rate — not tax advice; consult a CPA.
Schools (NCES district)
- District
- Bloom Twp Hsd 206
- NCES district ID
- 1706420
- Math proficiency
- 8% ▼ -3.00%
- Reading proficiency
- 9% ▼ -8.00%
- Median HH income
- $39,795
- Composite
- 7.4/100
- National rank
- #9952
- State rank
- #591 of 620 in IL
Livability — Steger
- Score
- 67/100
- State rank
- #498
- US rank
- #10279
Category grades
Schools grade is shown separately in the Schools card above.
Census & demographics
- Census place
- Steger, IL
- City population
- 10,103
- Population (ZIP)
- 10,103
Population outlook (Cook County) Hauer SSP2
- Today (2025)
- 5,347,519 people
- By 2030
- 5,357,703 · +0.2%
- By 2040
- 5,324,924 · -0.4%
- By 2050
- 5,230,762 · -2.2%
- By 2075
- 4,785,735 · -10.5%
- By 2100
- 4,188,836 · -21.7%
Race, ethnicity, and origin ACS 2023
- Neighborhood character
- Diverse neighborhood (Simpson 0.65)
- Race & ethnicity
- White 52% Hispanic / Latino 23% Black 18% Two or more races 11% Asian 1%
- Hispanic origin (detail)
- Mexican 21%
- Common ancestry
- Romanian 5% Lithuanian 1% Italian 1%
- Foreign-born
- 7% · Canada, South Korea
- Languages at home
- 85% English-only · Spanish 13% Other Indo-European 1%
Political lean MEDSL · Cook
- 2024 margin
- Solid D (+42.0) · D 70.4% · R 28.4% · Other 1.2%
- 2008→2024 swing
- -11.4pp toward R · 2008: 53.4pp · 2024: 42.0pp
- All cycles
- 2024: D+42.0 2020: D+50.3 2016: D+53.0 2012: D+49.4 2008: D+53.4
Not yet ingested
- Civics
- —
Market trends
- HPI YoY
- ▼ -92.95%
- Current HPI
- 134.0677
- Rent YoY
- —
- Metro
- —
- State GDP YoY
- ▲ 1.59%
- F500 in state
- 60
Industry mix (Fortune 500 HQ in IL)
| Industry | F500 HQs | Revenue |
|---|---|---|
| Insurance | 4 | $201B |
|
||
| Consumer Goods | 4 | $87B |
|
||
| Industrial Machinery | 3 | $64B |
|
||
| Healthcare | 2 | $55B |
|
||
| Retail / Pharmacy | 1 | $148B |
|
||
| Agriculture / Food | 1 | $86B |
|
||
Price history
+251.9% since first listed15 events — show timeline
- 2026-05-19 Contingent — MRED as Distributed by MLS Grid
- 2026-04-09 Price Changed $168,900 MRED as Distributed by MLS Grid
- 2026-03-05 Listing Removed — MRED as Distributed by MLS Grid
- 2026-03-05 Listed $170,000 MRED as Distributed by MLS Grid
- 2026-02-01 Listed — MRED as Distributed by MLS Grid
- 2026-01-13 Listing Removed — MRED as Distributed by MLS Grid
- 2025-11-14 Price Changed — MRED as Distributed by MLS Grid
- 2025-10-14 Listed — MRED as Distributed by MLS Grid
- 2022-05-11 Sold (Public Records) $99,000 Public Records
- 2022-05-09 Sold (MLS) $99,000 MRED as Distributed by MLS Grid
- 2022-04-01 Contingent — MRED as Distributed by MLS Grid
- 2022-03-28 Listed $109,900 MRED as Distributed by MLS Grid
- 1992-06-04 Sold (Public Records) $162,000 Public Records
- 1984-08-02 Sold (Public Records) $48,000 Public Records
- 1984-07-01 Sold (Public Records) $48,000 Public Records
Property tax history
+4.5%/yrLatest (2023): $3,351 · +69.7% YoY. Source: county tax records.
Cash-flow waterfall
monthlySold comps — $/sqft
last 12 mo · ≤1 miLoading sold comps…