 Multi-family
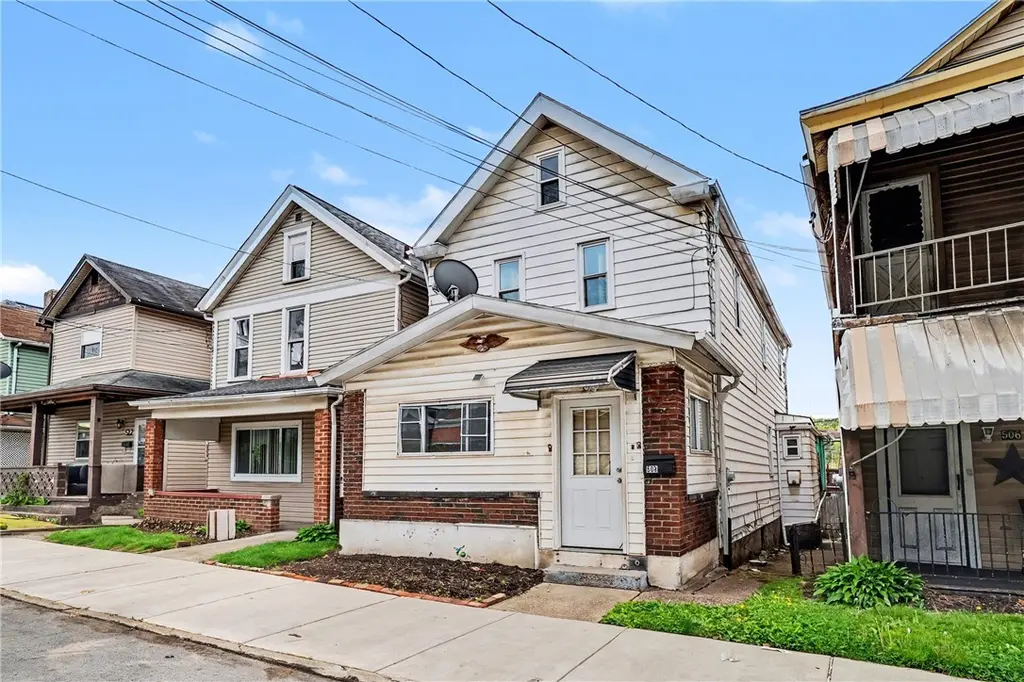
508 Ohio Ave · Glassport, PA
Flood risk 5/10 · Moderate
- FEMA flood zone
- X (unshaded)
- Chance of flooding over 30 yrs
- 0.24%
- Est. flood insurance / yr
- $473 – $860
Fire risk 1/10 · Minimal
- Est. fire insurance / yr
- $511 – $949
Heat risk 4/10 · Minor
- Hot days now (above 97°F)
- 7 days/yr
- Hot days in 30 yrs
- 20 days/yr
Wind risk 2/10 · Minimal
- Chance of severe wind over 30 yrs
- —
Air-quality risk 5/10 · Moderate
- Unhealthy air days now
- 8 days/yr
- Unhealthy air days in 30 yrs
- 8 days/yr
Risk factors via First Street. Map © Google.
Why this score? — see what drove the B- grade
The composite is a weighted blend of 9 inputs, each scored 0–100. Each bar is that input's sub-score; the figure is the points it added to the 100-point composite (weight × sub-score).
- Cash flow +25.6/30.0
- DSCR +8.5/10.0
- 1% rule +7.5/10.0
- ARV discount +7.5/15.0
- Appreciation +5.1/10.0
- Livability +3.6/5.0
- Schools +2.8/10.0
- Rent growth +2.5/5.0
- Condition / age +2.5/5.0
$109,900
🖨 Deal sheet 📄 Offer letter ✓ Due diligence
Multi-family units
County records classify this as Multi-Family (2-4 Unit). Listing-text estimate: 1 unit. estimate disagrees with records
Listing remarks MLS
This is a perfect opportunity for any investor to pick up a cash flowing House and Unit to add to their portfolio, or live in one side and rent out the other. This property is a 3-bedroom, 1.5 bath home in the front with a small back yard and a 2 car detached garage with a nice 2-bedroom, 1 bath apartment above it. Great house hack or buy-and-hold.
Key facts
- 2,748 sq ft lot
- Garage
- Built 1901
Property features AI
Finance
- HOA & community: Public transportation access
Exterior
- Parking: Detached garage (2 parking spaces)
- Utilities: Public water; Public sewer; Electric service available; Gas heating available
- Home design: 3-story frame residence; Resale property; Asphalt roof
- Construction: Frame construction; Asphalt roof
- Exterior features: 25 x 110 lot dimensions
Interior
- Flooring: Hardwood
- Bathrooms: 2 full bathrooms
- Heating & cooling: Gas heating
- Interior features: Hardwood floors; Basement present
Neighborhood map
What this means for you Summary
Snapshot
- This is a 3-bed/1.5-bath multifamily listed at $110k.
Deal economics
- At list price, monthly cash flow is $260 ($3k/yr) — positive.
- The deal already cash-flows at list — no discount required.
- Meets the 1% rule at list price ($1k rent vs $110k).
- Recommended offer: $108k (1.5% below list) — sets the bar for market timing.
Location & tenants
- Location reads 71/100 on livability (#716 in PA) — a middle-class / working-renter tenant base. Strengths: cost of living A+, housing A+, commute A-; Watch: crime C-, employment D+, schools D-.
- South Allegheny SD (suburban): math 23% / reading 44% proficiency, ranked #430 of 539 in PA (top 80%) — families likely to look elsewhere, expect single-tenant / working-renter base with shorter leases.
- Market conditions: 24 active listings in the ZIP; 2 comparable units currently listed for rent nearby; 2,996 units permitted in Allegheny County in 2024 (1,588 in 5+ unit buildings).
Forward outlook
- In year one you build about $956 of equity ($760 loan paydown + $196 appreciation (0.2% local appreciation)).
- At projected returns (0.2% appreciation + 3.0% rent growth), your $31k cash investment doubles in ~7 years — after that, you're playing with house money.
Negotiation context
- It's been on market 21 days — a 2% lower offer ($108k) is reasonable based on typical stale-listing flexibility.
- 11 sale attempts since 15y ago; this cycle's ask has dropped $10k (8%) from the opening price — seller is motivated, your offer sets the floor, not the list.
- Current owner paid $22k; list at $110k implies a 400% gain — meaningful room to come down on a strong offer.
Risks & watch-outs
- Watch-outs: built in 1901 — expect roof / HVAC / electrical / plumbing capex.
- Climate carrying-cost: moderate flood risk — expect insurance premiums to compound above CPI over the hold.
Questions for the listing agent
- Built in 1901 — when were the roof, HVAC, electrical panel, plumbing, and water heater last replaced?
- Is there a deadline driving the sale (1031 exchange, divorce, estate, relocation)? That informs how much negotiation room exists.
- Schools are D-rated, which usually means shorter tenancies and higher turnover. Who's the typical renter profile here, and what's been the actual vacancy rate?
- What's the average days-on-market for RENTAL listings here right now (not sales)? A rising rental-DOM trend means longer vacancies and softer asking-rent achievability than the comps imply.
- What's the recent tenant-quality profile in this submarket — average credit score on applications, eviction rate, late-payment / NSF rate, and stable-employment percentage? A property-management company in the area should have these aggregated.
- How much new apartment / multifamily construction is in the pipeline within 1–3 miles? Heavy new supply (>2% of stock underway) typically softens rents 12–24 months out; light construction supports rent growth.
Investment metrics
- 1% rule
- 1.25% ✓
- Cap rate
- 9.13%
- Cash-on-cash
- 10.14%
- DSCR
- 1.45
- GRM
- 6.7
CMA / ARV
No comps found within radius.
Projected returns pro-forma
0.18% appreciation · 3.0% rent growth · sell at horizon
- IRR
- 9.6%
- Equity multiple
- 1.47×
- Total profit
- $14,327
- Equity at exit
- $32,894
- IRR
- 14.4%
- Equity multiple
- 2.61×
- Total profit
- $49,507
- Equity at exit
- $40,333
Cash invested: $30,772 (down + closing). Projections, not guarantees.
Landlord ↔ Tenant lean methodology
- Overall (STATE)
- 62 Landlord-Friendly
- State Pennsylvania
- 62 Landlord-Friendly · EVEN
- County
- — inherits STATE
- City
- — inherits STATE
ZIP-level market 15045
- Home prices YoY
- 0.1%
- Active inventory
- 24
- Price-to-rent
- 6.7×
Monthly cashflow live
- Estimated rent
- $1,370 medium interval (Pro) →
- Mortgage (P&I)
- −$576
- Tax from tax record
- −$200 /mo · $2,400/yr
- Insurance
- −$46
- HOA
- −$0
- Vacancy / Maint / Mgmt
- −$288
- Net cashflow
- $260
Break-even live
UW: 25.0% down · 7.5% · 30yr · 1.5% tax · 5.0% vac · 8.0% maint · 8.0% mgmt
Financing live
Cash to close
- Down payment
- $27,475
- Closing costs
- $3,297
- Reserves months
- —
- Total cash needed
- —
Loan-product check · same deal, 3 products live
Conventional
25% down · 7.5% · 30yr
- Down + closing
- —
- Monthly P&I
- —
- Monthly cashflow
- —
- DSCR
- —
- Eligible?
- —
Personal DTI + credit; lowest rate.
DSCR
20% down · 8.5% · 30yr
- Down + closing
- —
- Monthly P&I
- —
- Monthly cashflow
- —
- DSCR
- —
- Eligible?
- —
No personal income docs; deal must DSCR.
Hard money
10% down · 12.0% · 12mo
- Down + closing
- —
- Monthly P&I
- —
- Monthly cashflow
- —
- DSCR
- —
- Eligible?
- —
Short-term bridge; refi at stabilization.
Rent comps 2 comps
| Address | Beds | Baths | Sqft | Rent | $/sqft | DOM | Units | Dist |
|---|---|---|---|---|---|---|---|---|
| 833 Vermont Ave Glassport, PA | 3.0 | 1.0 | 1290 | $1,395 | $1.08 | 23d | 1 | 0.41mi |
| 185 Carnegie Ave Clairton, PA | 3.0 | 1.0 | 1404 | $1,295 | $0.92 | 43d | 1 | 1.33mi |
Listing history 49 events
-
2026-06-18days on market $109,900 Active 21 DOM
-
2026-06-17days on market $109,900 Active 20 DOM
-
2026-06-16days on market $109,900 Active 19 DOM
-
2026-06-15days on market $109,900 Active 18 DOM
-
2026-06-13days on market $109,900 Active 16 DOM
-
2026-06-13days on market $109,900 Active 15 DOM
-
2026-06-09days on market $109,900 Active 12 DOM
-
2026-06-08pricedays on market $109,900 Active 11 DOM
-
2026-06-07days on market $119,900 Active 10 DOM
-
2026-06-05days on market $119,900 Active 7 DOM
-
2026-06-03days on market $119,900 Active 6 DOM
-
2026-06-02days on market $119,900 Active 5 DOM
-
2026-06-01days on market $119,900 Active 4 DOM
-
2026-05-31days on market $119,900 Active 3 DOM
-
2026-04-27$119,900 Active 350-char remark
Show marketing remark (350 chars)
This is a perfect opportunity for any investor to pick up a cash flowing House and Unit to add to their portfolio, or live in one side and rent out the other. This property is a 3-bedroom, 1.5 bath home in the front with a small back yard and a 2 car detached garage with a nice 2-bedroom, 1 bath apartment above it. Great house hack or buy-and-hold.
-
2025-01-18historical $745
-
2024-12-20price $745
-
2024-12-12price $795
-
2024-11-30price $845
-
2024-10-04price $895
-
2024-09-12$995
-
2024-06-28price $129,000 362-char remark
Show marketing remark (362 chars)
Great opportunity to pick up an occupied cash-flowing duplex. This property is a 3-bedroom, 1.5-bath home in the front with a small backyard and a 2-car detached garage in the rear with a nice 2-bedroom apartment above it. The property is currently fully-occupied and pulling in $1570/month and the tenants pay electric and gas. Great house hack or buy-and-hold.
-
2024-04-16price $134,900 362-char remark
Show marketing remark (362 chars)
Great opportunity to pick up an occupied cash-flowing duplex. This property is a 3-bedroom, 1.5-bath home in the front with a small backyard and a 2-car detached garage in the rear with a nice 2-bedroom apartment above it. The property is currently fully-occupied and pulling in $1570/month and the tenants pay electric and gas. Great house hack or buy-and-hold.
-
2024-03-11price $139,900 362-char remark
Show marketing remark (362 chars)
Great opportunity to pick up an occupied cash-flowing duplex. This property is a 3-bedroom, 1.5-bath home in the front with a small backyard and a 2-car detached garage in the rear with a nice 2-bedroom apartment above it. The property is currently fully-occupied and pulling in $1570/month and the tenants pay electric and gas. Great house hack or buy-and-hold.
-
2024-02-23$145,000 Active 362-char remark
Show marketing remark (362 chars)
Great opportunity to pick up an occupied cash-flowing duplex. This property is a 3-bedroom, 1.5-bath home in the front with a small backyard and a 2-car detached garage in the rear with a nice 2-bedroom apartment above it. The property is currently fully-occupied and pulling in $1570/month and the tenants pay electric and gas. Great house hack or buy-and-hold.
-
2022-06-07price $115,000
-
2022-06-07price $115,000
-
2022-05-10price $117,500
-
2022-05-10price $117,500
-
2022-04-29status Active
-
2022-04-29status Active
-
2022-04-18historical Contingent
-
2022-04-18historical Contingent
-
2022-04-01price $118,000
-
2022-04-01price $118,000
-
2022-03-02price $119,900
-
2022-03-02price $119,900
-
2022-02-21price $125,000
-
2022-02-21price $125,000
-
2022-02-13$120,000 Active
-
2022-02-13$120,000 Active
-
2018-03-29historical Withdrawn
-
2018-03-29historical
-
2018-03-27$60,000 Active
-
2018-03-27$60,000
-
2011-08-22soldstatus $22,000
-
2011-08-16price $25,000
-
2011-08-16soldstatus $22,000
-
2011-07-15$22,000
ⓘ Source: listings_history table (triggers on properties + properties_extension) + one-shot
backfill from property_details.listing_events for pre-trigger history.
Tax reassessment forecast PA · Partial reset (capped growth)
- Current annual tax
- $2,400 · $200/mo
- Projected year-2 tax
- $2,400 · $200/mo
- Expected delta
- $0/yr ($0/mo · 0.0%)
ⓘ Screening estimate from a state-policy table — verify with the county assessor before closing.
Climate risk First Street
- Flood 5/10 Major FEMA zone X (unshaded) · 24% chance over 30 yrs
- Wildfire 1/10 Low
- Heat 4/10 Moderate 7 d/yr ≥97°F today · 20 d/yr by 30 yrs out
- Wind 2/10 Low
- Air quality 5/10 Major 8 unhealthy d/yr today · 8 by 30 yrs out
Nearby sold comps map
Loading sold comps map…
Walkable amenities ~0.75 mi
Loading nearby amenities…
Taxation est. · year 1
- Rental income
- $16,437
- − Mortgage interest
- −$6,156
- − Property taxes
- −$2,400
- − Insurance
- −$550
- − Repairs & maintenance
- −$1,315
- − Management
- −$1,315
- − Depreciation
- −$3,197
- Taxable income
- $1,504
- Est. tax owed @ 24.0%
- −$361
- After-tax cash flow
- $2,759/yr
For passive investors: Depreciation is non-cash, so a rental often shows a tax loss while cash-flowing — sheltering income. Rental losses are passive: they offset passive income freely, and up to $25,000/yr can offset ordinary (W-2) income if you actively participate and your MAGI is under $100k (phasing out to $0 by $150k); unused losses carry forward. On sale, claimed depreciation is recaptured at up to 25%, and gains may owe capital-gains tax (a 1031 exchange can defer both). Figures are a year-1 estimate at your 24.0% rate — not tax advice; consult a CPA.
Schools (NCES district)
- District
- South Allegheny SD
- NCES district ID
- 4221910
- Math proficiency
- 23% ▼ -10.00%
- Reading proficiency
- 44% ▼ -13.00%
- Median HH income
- $40,891
- Composite
- 28.15/100
- National rank
- #6815
- State rank
- #430 of 539 in PA
Livability — Glassport
- Score
- 71/100
- State rank
- #716
- US rank
- #7113
Category grades
Schools grade is shown separately in the Schools card above.
Census & demographics
- Census place
- Glassport, PA
- City population
- 4,400
- Population (ZIP)
- 4,400
Population outlook (Allegheny County) Hauer SSP2
- Today (2025)
- 1,250,282 people
- By 2030
- 1,256,482 · +0.5%
- By 2040
- 1,256,318 · +0.5%
- By 2050
- 1,244,169 · -0.5%
- By 2075
- 1,197,693 · -4.2%
- By 2100
- 1,093,187 · -12.6%
Race, ethnicity, and origin ACS 2023
- Neighborhood character
- Predominantly White (88%)
- Race & ethnicity
- White 88% Hispanic / Latino 6% Black 4% Two or more races 3%
- Hispanic origin (detail)
- Mexican 4%
- Common ancestry
- Romanian 18% Portuguese 6% Serbian 6%
- Foreign-born
- 1% · South Korea, Canada
- Languages at home
- 97% English-only · German/W. Germanic 1% Spanish 1% Korean 1%
Political lean MEDSL · Allegheny
- 2024 margin
- Strong D (+20.3) · D 59.7% · R 39.4%
- 2008→2024 swing
- +4.8pp toward D · 2008: 15.5pp · 2024: 20.3pp
- All cycles
- 2024: D+20.3 2020: D+20.4 2016: D+16.4 2012: D+14.4 2008: D+15.5
Not yet ingested
- Civics
- —
Market trends
- HPI YoY
- ▲ 0.18%
- Current HPI
- 214.7403
- Rent YoY
- —
- Metro
- —
- State GDP YoY
- ▲ 1.68%
- F500 in state
- 34
Industry mix (Fortune 500 HQ in PA)
| Industry | F500 HQs | Revenue |
|---|---|---|
| Healthcare | 2 | $309B |
|
||
| Insurance | 2 | $27B |
|
||
| Telecommunications / Media | 1 | $124B |
|
||
| Industrial Distribution | 1 | $22B |
|
||
| Financial Services | 1 | $20B |
|
||
| Chemicals / Materials | 1 | $18B |
|
||
Price history
+399.5% since first listed37 events — show timeline
- 2026-06-08 Price Changed $109,900 West Penn MLS
- 2026-05-28 Listed $119,900 West Penn MLS
- 2026-04-27 Listed $119,900 West Penn MLS
- 2025-01-18 Rental Removed $745 SHOWMOJO
- 2024-12-20 Price Changed $745 SHOWMOJO
- 2024-12-12 Price Changed $795 SHOWMOJO
- 2024-11-30 Price Changed $845 SHOWMOJO
- 2024-10-04 Price Changed $895 SHOWMOJO
- 2024-09-12 Listed for Rent $995 SHOWMOJO
- 2024-06-28 Price Changed $129,000 West Penn MLS
- 2024-04-16 Price Changed $134,900 West Penn MLS
- 2024-03-11 Price Changed $139,900 West Penn MLS
- 2024-02-23 Listed $145,000 West Penn MLS
- 2022-06-07 Price Changed $115,000 West Penn MLS
- 2022-06-07 Price Changed $115,000 West Penn MLS
- 2022-05-10 Price Changed $117,500 West Penn MLS
- 2022-05-10 Price Changed $117,500 West Penn MLS
- 2022-04-29 Relisted — West Penn MLS
- 2022-04-29 Relisted — West Penn MLS
- 2022-04-18 Contingent — West Penn MLS
- 2022-04-18 Contingent — West Penn MLS
- 2022-04-01 Price Changed $118,000 West Penn MLS
- 2022-04-01 Price Changed $118,000 West Penn MLS
- 2022-03-02 Price Changed $119,900 West Penn MLS
- 2022-03-02 Price Changed $119,900 West Penn MLS
- 2022-02-21 Price Changed $125,000 West Penn MLS
- 2022-02-21 Price Changed $125,000 West Penn MLS
- 2022-02-13 Listed $120,000 West Penn MLS
- 2022-02-13 Listed $120,000 West Penn MLS
- 2018-03-29 Delisted — West Penn MLS
- 2018-03-29 Delisted — West Penn MLS
- 2018-03-27 Listed $60,000 West Penn MLS
- 2018-03-27 Listed $60,000 West Penn MLS
- 2011-08-22 Sold (Public Records) $22,000 Public Records
- 2011-08-16 Sold (MLS) $22,000 West Penn MLS
- 2011-08-16 Price Changed $25,000 West Penn MLS
- 2011-07-15 Listed $22,000 West Penn MLS
Property tax history
+4.4%/yrLatest (2026): $2,400 · +6.9% YoY. Source: county tax records.
Cash-flow waterfall
monthlySold comps — $/sqft
last 12 mo · ≤1 miLoading sold comps…