 Multi-family
3591 Kernan Blvd S · Jacksonville, FL
Flood risk 1/10 · Minimal
- FEMA flood zone
- X (unshaded)
- Chance of flooding over 30 yrs
- 0.0%
- Est. flood insurance / yr
- $507 – $1,088
Fire risk 5/10 · Moderate
- Est. fire insurance / yr
- $947 – $1,759
Heat risk 9/10 · Severe
- Hot days now (above 106°F)
- 7 days/yr
- Hot days in 30 yrs
- 20 days/yr
Wind risk 10/10 · Severe
- Chance of severe wind over 30 yrs
- 99.0%
Air-quality risk 4/10 · Minor
- Unhealthy air days now
- 4 days/yr
- Unhealthy air days in 30 yrs
- 7 days/yr
Risk factors via First Street. Map © Google.
Why this score? — see what drove the B grade
The composite is a weighted blend of 9 inputs, each scored 0–100. Each bar is that input's sub-score; the figure is the points it added to the 100-point composite (weight × sub-score).
- Cash flow +30.0/30.0
- 1% rule +10.0/10.0
- DSCR +10.0/10.0
- ARV discount +7.5/15.0
- Livability +4.2/5.0
- Schools +3.9/10.0
- Rent growth +3.3/5.0
- Condition / age +2.5/5.0
- Appreciation +0.0/10.0
$165,900
🖨 Deal sheet (PDF) 📄 Offer letter ✓ Due diligence
Multi-family units
County records classify this as Multi-Family (5+ Unit). Listing-text estimate: 1 unit. estimate disagrees with records
5+ unit building — per-unit beds/baths from public records are typically unavailable; the breakdown below (if shown) is an estimate from the listing text.
Listing remarks MLS
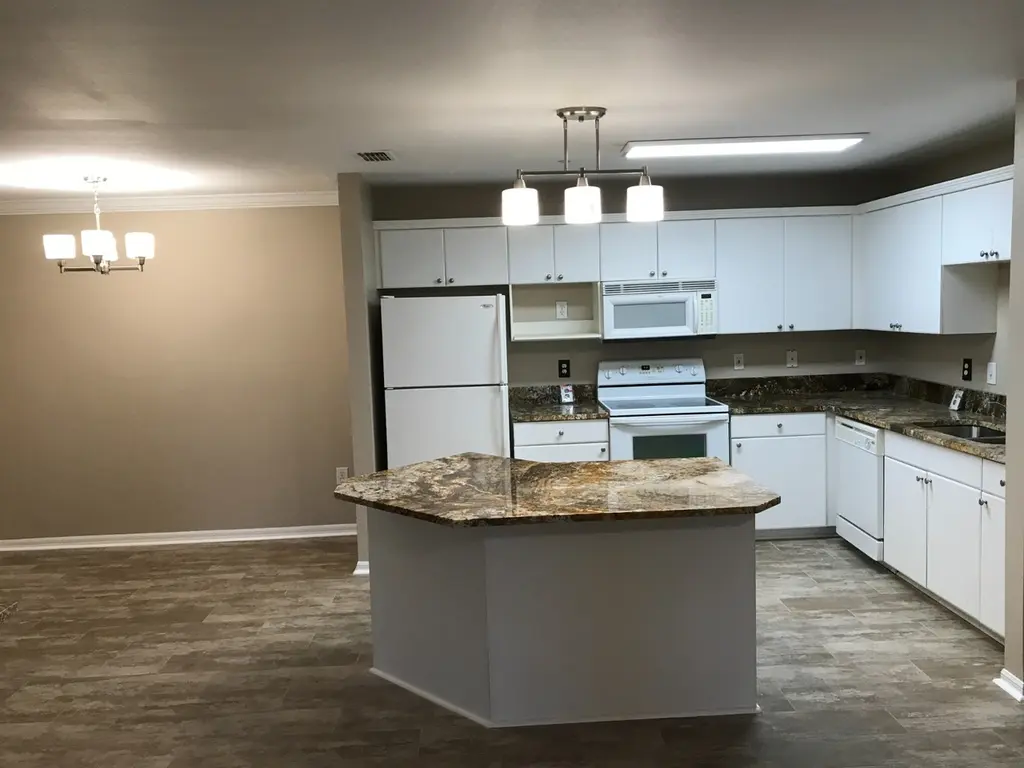
ACCEPTING BACK UP OFFERS LOCATION, LOCATION, LOCATION!!!Quiet and peaceful living in this top floor condo. Desirable floor-plan with 2 bedrooms and 2 full bathrooms. Screened in lanai. Open kitchen design. A must see!Washer and dryer included. Amenities include: swimming pool, hot tub, grill area, clubhouse, vehicle wash area, and exercise room. Condo Fee includes: water, sewer and pest control.
Key facts
- Tile floors
- Custom bathrooms
- Remodeled unit
Tags
Property features AI
Exterior
- Parking: 1-car garage
- Home design: Built in 2005
- Construction: Living area approximately 1,077 square feet
- Exterior features: Located at 3591 Kernan Blvd S, Jacksonville, FL 32224
Neighborhood map
What this means for you Summary
Snapshot
- This is a 2-bed/2.0-bath multifamily listed at $166k.
Deal economics
- At list price, monthly cash flow is $2k ($19k/yr) — positive.
- The deal already cash-flows at list — no discount required.
- Meets the 1% rule at list price ($3k rent vs $166k).
- Recommended offer: $163k (1.5% below list) — sets the bar for market timing.
- Cap rate 17.6% vs local median 4.0% in Jacksonville — top-decile yield for the area; either an underpriced asset or a hidden risk that comps aren't pricing in. Stress-test before assuming the spread holds.
Location & tenants
- Location reads 83/100 on livability (#50 in FL, #911 nationally) — a professional / high-income tenant draw. Strengths: amenities A+, commute A+, housing A+.
- Duval (urban): math 46% / reading 45% proficiency, ranked #48 of 73 in FL (top 66%) — families likely to look elsewhere, expect single-tenant / working-renter base with shorter leases.
- Market conditions: Rents rising (+3.0%/yr); 346 active listings in the ZIP; 15 comparable units currently listed for rent nearby; rentals leasing fast (median 5d on market — plan ~1-2 weeks tenant-placement turnaround); solid renter incomes; 6,503 units permitted in Duval County in 2024 (1,131 in 5+ unit buildings).
- At $3,432/mo this rent would consume 47% of the median local household income ($88k/yr) (locally 2511% of renters already pay >50% of income on rent) — very limited rent-growth headroom before tenants either downsize or default.
Forward outlook
- Local home prices are declining (-3.0%/yr); year-one equity from $1k of loan paydown is wiped out by about $5k of value loss. Plan a longer hold.
- Duval County population projected at +19% by 2050 — long-run rental-demand tailwind backs the buy-and-hold thesis.
- At projected returns (-3.0% appreciation + 3.0% rent growth), your $46k cash investment doubles in ~3 years — after that, you're playing with house money.
Negotiation context
- It's been on market 17 days — a 2% lower offer ($163k) is reasonable based on typical stale-listing flexibility.
- 41 sale attempts since 21y ago with the ask held roughly flat each time — persistent listings suggest the price (not the market) is what's stuck; bring a comps-based counter.
Risks & watch-outs
- Climate carrying-cost: severe wind risk, 99% chance of damaging wind over 30y; moderate wildfire risk; extreme-heat days projected 7→20/yr by 2055 (HVAC capex compounding) — expect insurance premiums to compound above CPI over the hold.
Questions for the listing agent
- Is there a deadline driving the sale (1031 exchange, divorce, estate, relocation)? That informs how much negotiation room exists.
- Schools are B-rated — typically a magnet for longer-tenancy family renters. What's the average tenant stay here, and is there a school-zone premium baked into asking?
- What's the average days-on-market for RENTAL listings here right now (not sales)? A rising rental-DOM trend means longer vacancies and softer asking-rent achievability than the comps imply.
- What's the recent tenant-quality profile in this submarket — average credit score on applications, eviction rate, late-payment / NSF rate, and stable-employment percentage? A property-management company in the area should have these aggregated.
- How much new apartment / multifamily construction is in the pipeline within 1–3 miles? Heavy new supply (>2% of stock underway) typically softens rents 12–24 months out; light construction supports rent growth.
Investment metrics
- 1% rule
- 2.07% ✓
- Cap rate
- 17.61%
- Cash-on-cash
- 40.42%
- DSCR
- 2.80
- GRM
- 4.0
CMA / ARV
No comps found within radius.
Projected returns pro-forma
-3.0% appreciation · 3.04% rent growth · sell at horizon
- IRR
- 36.9%
- Equity multiple
- 2.57×
- Total profit
- $72,969
- Equity at exit
- $24,736
- IRR
- 43.6%
- Equity multiple
- 5.15×
- Total profit
- $192,648
- Equity at exit
- $14,344
Cash invested: $46,452 (down + closing). Projections, not guarantees.
Landlord ↔ Tenant lean methodology
- Overall (STATE)
- 87 Strongly Landlord-Friendly
- State Florida
- 87 Strongly Landlord-Friendly · R+3
- County
- — inherits STATE
- City
- — inherits STATE
ZIP-level market 32224
- Home prices YoY
- -23.2%
- Rents YoY
- 3.0%
- Active inventory
- 346
- Price-to-rent
- 8.1×
Monthly cashflow live
- Estimated rent
- $3,432 medium interval (Pro) →
- Mortgage (P&I)
- −$870
- Tax est. 1.5%
- −$207 /mo · $2,488/yr
- Insurance
- −$69
- HOA
- −$0
- Vacancy / Maint / Mgmt
- −$721
- Net cashflow
- $1,565
Break-even live
Sensitivity live
| Price | -10% $1,679 | -5% $1,622 | +0% $1,565 | +5% $1,507 | +10% $1,450 |
|---|---|---|---|---|---|
| Rent | -10% $1,294 | -5% $1,429 | +0% $1,565 | +5% $1,700 | +10% $1,836 |
| Rate | -1.0pp $1,648 | -0.5pp $1,607 | base $1,565 | +0.5pp $1,522 | +1.0pp $1,478 |
2-unit breakdown (identical units grouped — click to expand)
| Units | Beds | Baths | Est. rent |
|---|---|---|---|
| 2× units | 2 | 2 | $3,432 |
| #1 | 2 | 2 | $1,716 |
| #2 | 2 | 2 | $1,716 |
| Total (2 units) | $3,432 | ||
UW: 25.0% down · 7.5% · 30yr · 1.5% tax · 5.0% vac · 8.0% maint · 8.0% mgmt
Financing live
Cash to close
- Down payment
- $41,475
- Closing costs
- $4,977
- Reserves months
- —
- Total cash needed
- —
Loan-product check · same deal, 3 products live
Conventional
25% down · 7.5% · 30yr
- Down + closing
- —
- Monthly P&I
- —
- Monthly cashflow
- —
- DSCR
- —
- Eligible?
- —
Personal DTI + credit; lowest rate.
DSCR
20% down · 8.5% · 30yr
- Down + closing
- —
- Monthly P&I
- —
- Monthly cashflow
- —
- DSCR
- —
- Eligible?
- —
No personal income docs; deal must DSCR.
Hard money
10% down · 12.0% · 12mo
- Down + closing
- —
- Monthly P&I
- —
- Monthly cashflow
- —
- DSCR
- —
- Eligible?
- —
Short-term bridge; refi at stabilization.
Rent comps 15 comps
| Address | Beds | Baths | Sqft | Rent | $/sqft | DOM | Units | Dist |
|---|---|---|---|---|---|---|---|---|
| 3591 Kernan Blvd S Jacksonville, FL | 1.0–2.0 | 1.0–2.0 | 988 | $1,450 | $1.47 | 24d | 2 | 0.03mi |
| 3591 Kernan Blvd S Jacksonville, FL | 1.0–2.0 | 1.0–2.0 | 1041 | $1,500 | $1.44 | 5d | 3 | 0.03mi |
| 3591 Kernan Blvd S Jacksonville, FL | 2.0 | 2.0 | 1177 | $1,475 | $1.25 | 4d | 2 | 0.03mi |
| 3601 Kernan Blvd S Jacksonville, FL | 2.0–4.0 | 2.0–4.0 | 1053 | $1,406 | $1.33 | 2d | 21 | 0.32mi |
| 12517 Beach Blvd Jacksonville, FL | 1.0–3.0 | 1.0–2.0 | 1000 | $1,823 | $1.82 | 2d | 25 | 0.44mi |
| 12171 Beach Blvd Jacksonville, FL | 1.0–3.0 | 1.0–2.0 | 999 | $1,638 | $1.64 | 2d | 12 | 0.62mi |
| 12645 Ash Harbor Dr Jacksonville, FL | 3.0 | 2.0 | 1260 | $2,400 | $1.90 | 17d | 1 | 0.68mi |
| 12193 Kernan Lake Dr Jacksonville, FL | 1.0–3.0 | 1.0–2.0 | 1197 | $1,918 | $1.60 | 2d | 23 | 0.78mi |
| 11990 Beach Blvd Jacksonville, FL | 1.0–2.0 | 1.0–2.5 | 930 | $1,696 | $1.82 | 2d | 8 | 0.86mi |
| 3504 Summerlin Ln Jacksonville, FL | 2.0 | 2.5 | 1110 | $1,475 | $1.33 | 24d | 1 | 1.09mi |
| 3684 Summerlin Ln Jacksonville, FL | 2.0 | 2.5 | 1110 | $1,600 | $1.44 | 24d | 1 | 1.19mi |
| 3477 Nightscape Cir Jacksonville, FL | 2.0 | 2.5 | 1078 | $1,750 | $1.62 | 24d | 1 | 1.21mi |
| 3435 Nightscape Cir Jacksonville, FL | 2.0 | 2.5 | 1078 | $1,800 | $1.67 | 24d | 1 | 1.22mi |
| 13364 Beach Blvd Jacksonville, FL | 2.0–3.0 | 2.0 | 1418 | $1,850 | $1.30 | 15d | 5 | 1.35mi |
| 13364 Beach Blvd Jacksonville, FL | 2.0–3.0 | 2.0 | 1418 | $1,800 | $1.27 | 4d | 6 | 1.35mi |
Listing history 10 events
-
2026-06-18days on market $165,900 Active 17 DOM
-
2026-06-17days on market $165,900 Active 16 DOM
-
2026-06-16days on market $165,900 Active 15 DOM
-
2026-06-15days on market $165,900 Active 14 DOM
-
2026-06-10days on market $165,900 Active 8 DOM
-
2026-06-08days on market $165,900 Active 7 DOM
-
2026-06-08days on market $165,900 Active 6 DOM
-
2026-06-03days on market $165,900 Active 2 DOM
-
2026-06-02remarks 282-char remark
-
2026-06-02$165,900 Active 1 DOM
ⓘ Source: listings_history table (triggers on properties + properties_extension) + one-shot
backfill from property_details.listing_events for pre-trigger history.
Climate risk First Street
- Flood 1/10 Low FEMA zone X (unshaded) · 0% chance over 30 yrs
- Wildfire 5/10 Major
- Heat 9/10 Extreme 7 d/yr ≥106°F today · 20 d/yr by 30 yrs out
- Wind 10/10 Extreme 99% chance of damaging wind over 30 yrs
- Air quality 4/10 Moderate 4 unhealthy d/yr today · 7 by 30 yrs out
Nearby sold comps map
Loading sold comps map…
Walkable amenities ~0.75 mi
Loading nearby amenities…
Taxation est. · year 1
- Rental income
- $41,184
- − Mortgage interest
- −$9,293
- − Property taxes
- −$2,488
- − Insurance
- −$830
- − Repairs & maintenance
- −$3,295
- − Management
- −$3,295
- − Depreciation
- −$4,826
- Taxable income
- $17,157
- Est. tax owed @ 24.0%
- −$4,118
- After-tax cash flow
- $14,660/yr
For passive investors: Depreciation is non-cash, so a rental often shows a tax loss while cash-flowing — sheltering income. Rental losses are passive: they offset passive income freely, and up to $25,000/yr can offset ordinary (W-2) income if you actively participate and your MAGI is under $100k (phasing out to $0 by $150k); unused losses carry forward. On sale, claimed depreciation is recaptured at up to 25%, and gains may owe capital-gains tax (a 1031 exchange can defer both). Figures are a year-1 estimate at your 24.0% rate — not tax advice; consult a CPA.
Schools (NCES district)
- District
- Duval
- NCES district ID
- 1200480
- Math proficiency
- 46% ▼ -11.00%
- Reading proficiency
- 45% ▼ -4.00%
- Median HH income
- $48,987
- Composite
- 38.97/100
- National rank
- #4076
- State rank
- #48 of 73 in FL
Livability — Jacksonville
- Score
- 83/100
- State rank
- #50
- US rank
- #911
Category grades
Schools grade is shown separately in the Schools card above.
Census & demographics
- Census place
- Jacksonville, FL
- County
- Duval County · 1,015,274 people
- City population
- 979,034
- Metro
- Jacksonville, FL
- Population (ZIP)
- 42,092
- Household income
- $88,259
- Rent vs Own
- Severe rent burden
- 2511.0
Population outlook (Duval County) Hauer SSP2
- Today (2025)
- 1,013,010 people
- By 2030
- 1,059,228 · +4.6%
- By 2040
- 1,141,439 · +12.7%
- By 2050
- 1,205,258 · +19.0%
- By 2075
- 1,324,282 · +30.7%
- By 2100
- 1,319,620 · +30.3%
Race, ethnicity, and origin ACS 2023
- Neighborhood character
- Diverse neighborhood (Simpson 0.56)
- Race & ethnicity
- White 64% Hispanic / Latino 14% Two or more races 12% Black 9% Asian 7%
- Hispanic origin (detail)
- Mexican 2% Puerto Rican 3% Cuban 2%
- Common ancestry
- Italian 3% Romanian 2% Slovak 2%
- Foreign-born
- 15% · Canada, Jamaica, China
- Languages at home
- 82% English-only · Spanish 10% Other Indo-European 3% Tagalog/Filipino 1%
Political lean MEDSL · Duval
- 2024 margin
- Toss-up / Even · D 48.7% · R 50.1% · Other 1.2%
- 2008→2024 swing
- +0.4pp no change · 2008: -1.9pp · 2024: -1.5pp
- All cycles
- 2024: R+1.5 2020: D+3.8 2016: R+1.5 2012: R+3.6 2008: R+1.9
Not yet ingested
- Civics
- —
Market trends
- HPI YoY
- ▼ -89.64%
- Current HPI
- 296.2667
- Rent YoY
- ▲ 3.04%
- Metro
- Jacksonville, FL
- State GDP YoY
- ▲ 3.28%
- F500 in state
- 36
Industry mix (Fortune 500 HQ in FL)
| Industry | F500 HQs | Revenue |
|---|---|---|
| Industrial Technology | 2 | $29B |
|
||
| Insurance | 2 | $17B |
|
||
| Retail | 1 | $60B |
|
||
| Technology Distribution | 1 | $58B |
|
||
| Homebuilding | 1 | $35B |
|
||
| Technology Manufacturing | 1 | $35B |
|
||
Price history
-99.3% since first listed92 events — show timeline
- 2026-06-01 Listed $165,900 FSBO.com
- 2026-04-21 Rental Removed $1,375 RENTALBEAST
- 2026-04-20 Listed for Rent $1,375 RENTALBEAST
- 2026-04-12 Rental Removed $1,600 APPFOLIO
- 2026-03-12 Listed for Rent $1,600 APPFOLIO
- 2025-10-12 Rental Removed $1,500 APPFOLIO
- 2025-10-05 Listed for Rent $1,500 APPFOLIO
- 2025-10-04 Rental Removed $1,500 APPFOLIO
- 2025-10-01 Rental Removed $1,500 TURBOTENANT
- 2025-09-03 Listed for Rent $1,500 APPFOLIO
- 2025-09-03 Rental Removed $1,850 APPFOLIO
- 2025-08-30 Listed for Rent $1,850 TURBOTENANT
- 2025-08-15 Price Changed $1,425 APPFOLIO
- 2025-08-14 Listed for Rent $1,450 APPFOLIO
- 2025-07-30 Rental Removed $1,550 RENTALBEAST
- 2025-07-19 Listed for Rent $1,550 RENTALBEAST
- 2025-07-03 Rental Removed $1,550 RENTALBEAST
- 2025-05-26 Listed for Rent $1,550 RENTALBEAST
- 2025-03-10 Rental Removed $1,600 RENTALBEAST
- 2025-03-08 Listed for Rent $1,600 RENTALBEAST
- 2025-01-30 Rental Removed $1,575 APPFOLIO
- 2025-01-16 Rental Removed $1,575 NEFLMLS
- 2025-01-16 Listed for Rent $1,575 APPFOLIO
- 2024-12-10 Listed for Rent $1,575 NEFLMLS
- 2024-11-28 Rental Removed $1,295 RENTALBEAST
- 2024-11-27 Listed for Rent $1,295 RENTALBEAST
- 2024-09-17 Rental Removed $1,300 APPFOLIO
- 2024-09-04 Listed for Rent $1,300 APPFOLIO
- 2024-08-15 Rental Removed $1,650 APPFOLIO
- 2024-08-15 Listed for Rent $1,650 APPFOLIO
- 2024-08-15 Rental Removed $1,475 APPFOLIO
- 2024-08-14 Listed for Rent $1,475 APPFOLIO
- 2024-08-02 Rental Removed $1,475 APPFOLIO
- 2024-07-26 Listed for Rent $1,475 APPFOLIO
- 2024-07-19 Rental Removed $1,525 APPFOLIO
- 2024-07-16 Price Changed $1,525 APPFOLIO
- 2024-07-09 Listed for Rent $1,550 APPFOLIO
- 2023-07-20 Rental Removed — RENT.
- 2021-10-13 Sold (MLS) $185,000 St. Augustine and St. Johns County Board of REALTORS®
- 2021-09-02 Listed $179,900 St. Augustine and St. Johns County Board of REALTORS®
- 2009-09-09 Listing Removed — realMLS
- 2009-09-08 Sold (MLS) $50,000 realMLS
- 2009-04-13 Listed $64,900 realMLS
- 2007-01-22 Listed $171,900 realMLS
- 2007-01-22 Listed $166,900 realMLS
- 2007-01-22 Sold (MLS) $171,900 realMLS
- 2007-01-22 Sold (MLS) $166,900 realMLS
- 2007-01-18 Listed $174,900 realMLS
- 2007-01-18 Listed $150,900 realMLS
- 2007-01-18 Listed $118,900 realMLS
- 2007-01-18 Sold (MLS) $174,900 realMLS
- 2007-01-18 Sold (MLS) $150,900 realMLS
- 2007-01-18 Sold (MLS) $118,900 realMLS
- 2007-01-17 Listed $178,900 realMLS
- 2007-01-17 Listed $169,900 realMLS
- 2007-01-17 Sold (MLS) $178,900 realMLS
- 2007-01-17 Sold (MLS) $169,900 realMLS
- 2007-01-16 Listed $110,900 realMLS
- 2007-01-16 Sold (MLS) $110,900 realMLS
- 2007-01-11 Listing Removed — realMLS
- 2006-11-29 Listing Removed — realMLS
- 2006-11-28 Listing Removed — realMLS
- 2006-06-26 Listing Removed — realMLS
- 2006-06-22 Listing Removed — realMLS
- 2006-06-20 Sold (MLS) $169,900 realMLS
- 2006-06-14 Listed $169,900 realMLS
- 2006-06-09 Sold (MLS) $164,900 realMLS
- 2006-05-08 Listing Removed — realMLS
- 2006-05-05 Listed $193,500 realMLS
- 2006-05-02 Listing Removed — realMLS
- 2006-04-13 Listed $164,900 realMLS
- 2006-03-31 Listed $186,900 realMLS
- 2006-03-31 Sold (MLS) $186,900 realMLS
- 2006-03-30 Sold (MLS) $139,900 realMLS
- 2006-03-30 Sold (MLS) $176,900 realMLS
- 2006-03-30 Sold (MLS) $179,900 realMLS
- 2006-03-30 Sold (MLS) $136,400 realMLS
- 2006-03-30 Sold (MLS) $176,900 realMLS
- 2006-03-30 Sold (MLS) $186,900 realMLS
- 2006-03-02 Sold (MLS) $174,900 realMLS
- 2006-01-16 Listed $174,900 realMLS
- 2005-12-09 Sold (MLS) $115,900 realMLS
- 2005-11-15 Sold (MLS) $142,900 realMLS
- 2005-10-29 Listed $134,900 realMLS
- 2005-10-28 Listed $162,900 realMLS
- 2005-10-28 Listed $179,900 realMLS
- 2005-10-28 Listed $126,900 realMLS
- 2005-10-28 Listed $166,900 realMLS
- 2005-10-28 Listed $186,900 realMLS
- 2005-10-10 Listed $115,900 realMLS
- 2005-10-10 Listed $142,900 realMLS
- 2005-05-03 Sold (Public Records) $24,500,000 Public Records
Cash-flow waterfall
monthlySold comps — $/sqft
last 12 mo · ≤1 miLoading sold comps…