4140 Rufe Snow Dr · North Richland Hills, TX
Flood risk 1/10 · Minimal
- FEMA flood zone
- X (unshaded)
- Chance of flooding over 30 yrs
- 0.0%
- Est. flood insurance / yr
- $507 – $1,088
Fire risk 1/10 · Minimal
- Est. fire insurance / yr
- $1,222 – $2,270
Heat risk 8/10 · Major
- Hot days now (above 109°F)
- 7 days/yr
- Hot days in 30 yrs
- 23 days/yr
Wind risk 4/10 · Minor
- Chance of severe wind over 30 yrs
- 24.0%
Air-quality risk 3/10 · Minor
- Unhealthy air days now
- 2 days/yr
- Unhealthy air days in 30 yrs
- 3 days/yr
Risk factors via First Street. Map © Google.
Why this score? — see what drove the D grade
The composite is a weighted blend of 9 inputs, each scored 0–100. Each bar is that input's sub-score; the figure is the points it added to the 100-point composite (weight × sub-score).
- ARV discount +14.0/15.0
- Cash flow +8.6/30.0
- 1% rule +3.9/10.0
- Schools +3.7/10.0
- Livability +3.6/5.0
- Condition / age +2.5/5.0
- DSCR +2.4/10.0
- Rent growth +2.1/5.0
- Appreciation +0.0/10.0
$239,900
🖨 Deal sheet 📄 Offer letter ✓ Due diligence
Listing remarks
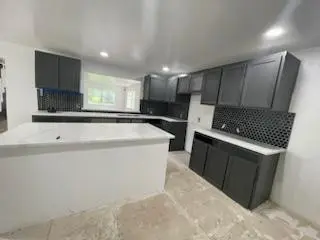
FOUNDATION REPAIR DONE ON 1.14.26! HOUSE IS PRICED TO SELL! Comfort, Style & Convenience in North Richland Hills! This charming 3-bedroom, 2.5-bath home offers the perfect blend of functionality and modern updates—quartz countertops, spacious living areas, and a versatile bonus room perfect for a media room or playroom. The oversized bedrooms are a true highlight, each offering ample space for rest and relaxation. This home offers incredible value in a prime location with easy access to TX-183, Loop 820, and DFW Airport. Enjoy nearby top-rated schools, shopping, dining, and recreational options. Don’t miss your chance to make this beautifully updated home yours—sche
Key facts
- Quartz countertops
- Versatile bonus room
- Prime location
Tags
Neighborhood map
What this means for you Summary
Snapshot
- This is a 3-bed/2.0-bath single-family listed at $240k.
Deal economics
- At list price, monthly cash flow is $-207 ($-2k/yr) — negative.
- To cash-flow at today's rent, offer at most $203k (15.2% below list).
- To meet the 1% rule (rent ≥ 1% of price), the offer needs to be $214k (10.6% below list).
- Recommended offer: $203k (15.2% below list) — sets the bar for cash-flow.
- Cap rate 5.3% vs local median 3.6% in North Richland Hills — top-decile yield for the area; either an underpriced asset or a hidden risk that comps aren't pricing in. Stress-test before assuming the spread holds.
Location & tenants
- Location reads 71/100 on livability (#286 in TX) — a middle-class / working-renter tenant base. Strengths: housing A+, cost of living A, employment A-; Watch: amenities F, commute F, health & safety D-.
- Birdville ISD (suburban): math 42% / reading 43% proficiency, ranked #299 of 826 in TX (top 36%) — families likely to look elsewhere, expect single-tenant / working-renter base with shorter leases.
- Market conditions: Rents soft (-1.6%/yr); 152 active listings in the ZIP; 33 comparable units currently listed for rent nearby; rentals at typical pace (median 25d on market — plan ~3-4 weeks tenant-placement turnaround); solid renter incomes; 18,938 units permitted in Tarrant County in 2024 (8,336 in 5+ unit buildings).
- This rent runs 32% of the median local income ($82k/yr) — at the standard rent-burdened threshold; future hikes will face affordability resistance.
Forward outlook
- Local home prices are declining (-3.0%/yr); year-one equity from $2k of loan paydown is wiped out by about $7k of value loss. Plan a longer hold.
- Tarrant County population projected at +41% by 2050 — long-run rental-demand tailwind backs the buy-and-hold thesis.
Negotiation context
- It's been on market 318 days — a 12% lower offer ($211k) is reasonable based on typical stale-listing flexibility.
- 9 sale attempts since 2y ago; this cycle's ask has dropped $40k (14%) from the opening price — seller is motivated, your offer sets the floor, not the list.
- Current owner paid $47k; list at $240k implies a 415% gain — meaningful room to come down on a strong offer.
Risks & watch-outs
- Watch-outs: property tax is 2.7% of price; built in 1957 — expect roof / HVAC / electrical / plumbing capex.
- Climate carrying-cost: extreme-heat days projected 7→23/yr by 2055 (HVAC capex compounding) — expect insurance premiums to compound above CPI over the hold.
Questions for the listing agent
- What do current leases actually rent for vs. the listed asking? Can we see a recent rent roll and the last 12 months of T-12 income?
- It's been on market 318 days. Have you received any prior offers? Is the seller open to a 15% concession, seller financing, or rate buy-down credit?
- Built in 1957 — when were the roof, HVAC, electrical panel, plumbing, and water heater last replaced?
- Property tax is high relative to price — has the assessment been appealed recently, and will the sale trigger a re-assessment?
- Why hasn't it sold? Are there any deal-killer items the seller is aware of (foundation, flood, title, zoning, code violations)?
- Is there a deadline driving the sale (1031 exchange, divorce, estate, relocation)? That informs how much negotiation room exists.
- Schools are B-rated — typically a magnet for longer-tenancy family renters. What's the average tenant stay here, and is there a school-zone premium baked into asking?
- The area grade is low — what's the realistic commute time and amenity access for the typical tenant pool here? Any planned neighborhood developments (good or bad) we should know about?
- What's the average days-on-market for RENTAL listings here right now (not sales)? A rising rental-DOM trend means longer vacancies and softer asking-rent achievability than the comps imply.
- What's the recent tenant-quality profile in this submarket — average credit score on applications, eviction rate, late-payment / NSF rate, and stable-employment percentage? A property-management company in the area should have these aggregated.
- How much new for-sale + rental construction is in the pipeline within 1–3 miles? Heavy new supply typically softens prices + rents 12–24 months out; constrained supply supports both.
Investment metrics
- 1% rule
- 0.89% ✗
- Cap rate
- 5.26%
- Cash-on-cash
- -3.70%
- DSCR
- 0.84
- GRM
- 9.3
CMA / ARV
- ARV (median comp)
- $280,200
- List price
- $239,900
- Delta
- -14.38%
- Verdict
- UNDERPRICED
- Comps
- 20 within 1.0 mi
Show comp detail 12 sales within ~0.75 mi
| Address | Dist | Beds/Ba | Sqft | Sold | Price | $/sf | Match |
|---|---|---|---|---|---|---|---|
| 6513 Circleview Dr | 0.46mi | 3/2.0 | 1,936 (-3%) | 0mo | $378,900 | $196 | 74 |
| 6729 Oliver Dr | 0.51mi | 3/2.0 | 1,988 (-0%) | 5mo | $350,000 | $176 | 72 |
| 6620 Diamond Ridge Dr | 0.46mi | 3/2.0 | 2,075 (+4%) | 1mo | $385,000 | $186 | 71 |
| 4724 Mackey Dr | 0.58mi | 3/2.0 | 1,995 (+0%) | 4mo | $359,000 | $180 | 70 |
| 6525 Briley Dr | 0.36mi | 3/2.0 | 2,140 (+7%) | 4mo | $450,000 | $210 | 68 |
| 6629 Tabor St | 0.19mi | 3/2.0 | 1,746 (-12%) | 4mo | $345,000 | $198 | 66 |
| 6428 St. George Ct | 0.45mi | 4/2.0 (+1) | 2,078 (+4%) | 2mo | $499,000 | $240 | 66 |
| 6425 ST George Ct | 0.45mi | 4/2.0 (+1) | 2,079 (+4%) | 3mo | $499,000 | $240 | 65 |
| 4412 Diamond Loch N | 0.38mi | 4/2.0 (+1) | 2,114 (+6%) | 4mo | $435,000 | $206 | 64 |
| 6728 Riviera Dr | 0.55mi | 3/2.0 | 1,751 (-12%) | 3mo | $335,000 | $191 | 52 |
| 4713 Holiday Ln W | 0.66mi | 3/3.0 | 1,824 (-8%) | 0mo | $359,000 | $197 | 51 |
| 3549 Holder St | 0.73mi | 4/3.0 (+1) | 2,035 (+2%) | 4mo | $400,000 | $197 | 50 |
Match score weights: distance 35% · size 25% · config 20% · recency 20%. Top-matched comps best support the ARV.
Projected returns pro-forma
-3.0% appreciation · 0.0% rent growth · sell at horizon
- IRR
- -26.4%
- Equity multiple
- 0.13×
- Total profit
- $-58,158
- Equity at exit
- $35,770
- IRR
- -41.5%
- Equity multiple
- -0.36×
- Total profit
- $-91,166
- Equity at exit
- $20,742
Cash invested: $67,172 (down + closing). Projections, not guarantees.
Landlord ↔ Tenant lean methodology
- Overall (STATE)
- 87 Strongly Landlord-Friendly
- State Texas
- 87 Strongly Landlord-Friendly · R+5
- County
- — inherits STATE
- City
- — inherits STATE
ZIP-level market 76180
- Rents YoY
- -1.6%
- Active inventory
- 152
- Price-to-rent
- 9.3×
Monthly cashflow live
- Estimated rent
- $2,145 high interval (Pro) →
- Mortgage (P&I)
- −$1,258
- Tax from tax record
- −$543 /mo · $6,520/yr
- Insurance
- −$100
- HOA
- −$0
- Vacancy / Maint / Mgmt
- −$450
- Net cashflow
- $-207
Break-even live
UW: 25.0% down · 7.5% · 30yr · 1.5% tax · 5.0% vac · 8.0% maint · 8.0% mgmt
Financing live
Cash to close
- Down payment
- $59,975
- Closing costs
- $7,197
- Reserves months
- —
- Total cash needed
- —
Loan-product check · same deal, 3 products live
Conventional
25% down · 7.5% · 30yr
- Down + closing
- —
- Monthly P&I
- —
- Monthly cashflow
- —
- DSCR
- —
- Eligible?
- —
Personal DTI + credit; lowest rate.
DSCR
20% down · 8.5% · 30yr
- Down + closing
- —
- Monthly P&I
- —
- Monthly cashflow
- —
- DSCR
- —
- Eligible?
- —
No personal income docs; deal must DSCR.
Hard money
10% down · 12.0% · 12mo
- Down + closing
- —
- Monthly P&I
- —
- Monthly cashflow
- —
- DSCR
- —
- Eligible?
- —
Short-term bridge; refi at stabilization.
Rent comps 33 comps
| Address | Beds | Baths | Sqft | Rent | $/sqft | DOM | Units | Dist |
|---|---|---|---|---|---|---|---|---|
| 4315 Mackey Dr North Richland Hills, TX | 3.0 | 1.5 | 1421 | $1,995 | $1.40 | 43d | 1 | 0.32mi |
| 4300 Mackey Dr Unit N North Richland Hills, TX | 3.0 | 2.0 | 1964 | $2,200 | $1.12 | 19d | 1 | 0.35mi |
| 4300 Mackey Dr North Richland Hills, TX | 3.0 | 2.0 | 1964 | $2,200 | $1.12 | 43d | 1 | 0.35mi |
| 6540 Victoria Ave North Richland Hills, TX | 4.0 | 3.0 | 2012 | $2,650 | $1.32 | 7d | 1 | 0.38mi |
| 6728 Karen Dr North Richland Hills, TX | 3.0 | 2.0 | 1645 | $1,900 | $1.16 | 24d | 1 | 0.76mi |
| 3625 Venice Dr North Richland Hills, TX | 4.0 | 2.0 | 1896 | $2,095 | $1.10 | 24d | 1 | 0.80mi |
| 3708 Holland Dr North Richland Hills, TX | 3.0 | 2.0 | 1675 | $2,050 | $1.22 | 15d | 1 | 0.84mi |
| 3319 Crites St Richland Hills, TX | 3.0 | 2.0 | 1600 | $1,650 | $1.03 | 43d | 1 | 1.11mi |
| 3319 Crites St Unit 101 Richland Hills, TX | 3.0 | 2.5 | 1580 | $1,650 | $1.04 | 24d | 1 | 1.11mi |
| 3319 Crites St Unit 203 Richland Hills, TX | 3.0 | 2.0 | 1680 | $1,595 | $0.95 | 43d | 1 | 1.11mi |
| 4421 Florence Ave North Richland Hills, TX | 1.0–3.0 | 1.0–3.0 | 1302 | $2,977 | $2.29 | 3d | 25 | 1.11mi |
| 5941 Tourist Dr North Richland Hills, TX | 4.0 | 2.5 | 1736 | $2,000 | $1.15 | 43d | 1 | 1.19mi |
| 4532 Tripp St North Richland Hills, TX | 3.0 | 2.5 | 1703 | $2,400 | $1.41 | 22d | 1 | 1.24mi |
| 5501 Crosby Dr North Richland Hills, TX | 4.0 | 3.0 | 2141 | $3,000 | $1.40 | 43d | 1 | 1.24mi |
| 4525 Ward St North Richland Hills, TX | 3.0 | 2.5 | 2362 | $3,300 | $1.40 | 1d | 1 | 1.26mi |
| 3517 Tourist Dr North Richland Hills, TX | 3.0 | 2.0 | 1401 | $2,200 | $1.57 | 43d | 1 | 1.29mi |
| 4512 Ward St North Richland Hills, TX | 3.0 | 2.5 | 1640 | $2,500 | $1.52 | 24d | 1 | 1.29mi |
| 4525 Bishop St North Richland Hills, TX | 3.0 | 2.5 | 1988 | $2,695 | $1.36 | 7d | 1 | 1.29mi |
| 6506 Park Place Dr Richland Hills, TX | 3.0 | 2.5 | 1528 | $1,995 | $1.31 | 22d | 1 | 1.30mi |
| 6506 Park Place Dr Richland Hills, TX | 3.0 | 2.5 | 1528 | $2,050 | $1.34 | 24d | 1 | 1.30mi |
| 6500 Park Place Dr Unit 6506 Richland Hills, TX | 3.0 | 2.5 | 1528 | $1,995 | $1.31 | 24d | 1 | 1.30mi |
| 4500 Ward St North Richland Hills, TX | 3.0 | 2.5 | 1649 | $2,599 | $1.58 | 24d | 1 | 1.30mi |
| 4513 Bishop St North Richland Hills, TX | 3.0 | 2.5 | 1678 | $2,700 | $1.61 | 43d | 1 | 1.30mi |
| 3417 Willowcrest Dr North Richland Hills, TX | 3.0 | 2.0 | 2228 | $2,141 | $0.96 | 22d | 1 | 1.31mi |
| 6605 Park Place Dr Unit A Richland Hills, TX | 3.0 | 2.5 | 1850 | $1,700 | $0.92 | 43d | 1 | 1.32mi |
| 6605 Park Place Dr Unit A Richland Hills, TX | 3.0 | 2.5 | 1388 | $1,595 | $1.15 | 14d | 1 | 1.32mi |
| 6520 Park Place Dr Richland Hills, TX | 2.0–3.0 | 1.0–2.0 | 1317 | $1,550 | $1.18 | 2d | 3 | 1.33mi |
| 4348 Henderson Ave North Richland Hills, TX | 3.0 | 2.5 | 1650 | $2,499 | $1.51 | 7d | 1 | 1.34mi |
| 5585 Crosby Dr North Richland Hills, TX | 3.0 | 3.5 | 1922 | $2,500 | $1.30 | 24d | 1 | 1.35mi |
| 5033 Winder Ct Unit C North Richland Hills, TX | 3.0 | 2.0 | 1457 | $1,670 | $1.15 | 7d | 1 | 1.35mi |
| 5821 Circular Dr North Richland Hills, TX | 4.0 | 2.0 | 1885 | $2,150 | $1.14 | 43d | 1 | 1.36mi |
| 6309 Iron Horse Blvd North Richland Hills, TX | 2.0 | 1.0–2.0 | 912 | $2,179 | $2.39 | 1d | 29 | 1.40mi |
| 6490 Iron Horse Blvd Unit 6523 North Richland Hills, TX | 3.0 | 2.0 | 1298 | $2,362 | $1.82 | 3d | 1 | 1.42mi |
Listing history 43 events
-
2026-06-18days on market $239,900 Active 318 DOM
-
2026-06-17days on market $239,900 Active 317 DOM
-
2026-06-16days on market $239,900 Active 316 DOM
-
2026-06-15days on market $239,900 Active 315 DOM
-
2026-06-13days on market $239,900 Active 313 DOM
-
2026-06-09days on market $239,900 Active 309 DOM
-
2026-06-08days on market $239,900 Active 308 DOM
-
2026-06-07days on market $239,900 Active 307 DOM
-
2026-06-04days on market $239,900 Active 304 DOM
-
2026-06-03days on market $239,900 Active 303 DOM
-
2026-06-02days on market $239,900 Active 302 DOM
-
2026-06-01days on market $239,900 Active 301 DOM
-
2026-05-31days on market $239,900 Active 300 DOM
-
2026-05-11status Active
-
2026-05-06historical Active Option Contract
-
2026-04-28status Active
-
2026-04-20historical Active Option Contract
-
2026-02-26status Active
-
2026-02-20historical Active Option Contract
-
2026-02-14status Active
-
2026-02-12historical Active Option Contract
-
2026-02-01status Active
-
2026-01-26historical Active Option Contract
-
2025-12-15price $229,900
-
2025-11-15price $239,900
-
2025-10-16price $249,900
-
2025-09-16price $259,900
-
2025-08-17price $269,900
-
2025-07-18$279,900 Active
-
2025-06-17historical
-
2025-03-04status Active
-
2025-02-23historical Active Option Contract
-
2024-12-10price $270,000
-
2024-10-17price $299,000
-
2024-09-27price $315,000
-
2024-09-16price $330,000
-
2024-09-06$340,000 Active
-
2024-06-12soldstatus Closed
-
2024-06-12soldstatus
-
2024-05-13price $270,000
-
2024-05-04$299,999 Active
-
2024-01-29soldstatus
-
1994-01-18soldstatus $46,550
ⓘ Source: listings_history table (triggers on properties + properties_extension) + one-shot
backfill from property_details.listing_events for pre-trigger history.
Tax reassessment forecast TX · Resets to sale price
- Current annual tax
- $6,520 · $543/mo
- Projected year-2 tax
- $6,520 · $543/mo
- Expected delta
- $0/yr ($0/mo · 0.0%)
ⓘ Screening estimate from a state-policy table — verify with the county assessor before closing.
Climate risk First Street
- Flood 1/10 Low FEMA zone X (unshaded) · 0% chance over 30 yrs
- Wildfire 1/10 Low
- Heat 8/10 Severe 7 d/yr ≥109°F today · 23 d/yr by 30 yrs out
- Wind 4/10 Moderate 24% chance of damaging wind over 30 yrs
- Air quality 3/10 Moderate 2 unhealthy d/yr today · 3 by 30 yrs out
Nearby sold comps map
Loading sold comps map…
Walkable amenities ~0.75 mi
Loading nearby amenities…
Taxation est. · year 1
- Rental income
- $25,738
- − Mortgage interest
- −$13,438
- − Property taxes
- −$6,520
- − Insurance
- −$1,200
- − Repairs & maintenance
- −$2,059
- − Management
- −$2,059
- − Depreciation
- −$6,979
- Taxable loss
- −$6,517
- Est. tax savings @ 24.0%
- +$1,564
- After-tax cash flow
- $-919/yr
For passive investors: Depreciation is non-cash, so a rental often shows a tax loss while cash-flowing — sheltering income. Rental losses are passive: they offset passive income freely, and up to $25,000/yr can offset ordinary (W-2) income if you actively participate and your MAGI is under $100k (phasing out to $0 by $150k); unused losses carry forward. On sale, claimed depreciation is recaptured at up to 25%, and gains may owe capital-gains tax (a 1031 exchange can defer both). Figures are a year-1 estimate at your 24.0% rate — not tax advice; consult a CPA.
Schools (NCES district)
- District
- Birdville ISD
- NCES district ID
- 4810230
- Math proficiency
- 42% ▼ -12.00%
- Reading proficiency
- 43% ▼ -6.00%
- Median HH income
- $55,930
- Composite
- 37.13/100
- National rank
- #4491
- State rank
- #299 of 826 in TX
Livability — North Richland Hills
- Score
- 71/100
- State rank
- #286
- US rank
- #6602
Category grades
Schools grade is shown separately in the Schools card above.
Census & demographics
- Census place
- North Richland Hills, TX
- County
- Tarrant County · 2,033,669 people
- City population
- 68,613
- Metro
- Dallas-Fort Worth-Arlington, TX
- Population (ZIP)
- 38,371
- Household income
- $81,503
- Rent vs Own
- Severe rent burden
- 1551.0
Population outlook (Tarrant County) Hauer SSP2
- Today (2025)
- 2,380,417 people
- By 2030
- 2,578,900 · +8.3%
- By 2040
- 2,974,995 · +25.0%
- By 2050
- 3,350,489 · +40.8%
- By 2075
- 4,216,909 · +77.2%
- By 2100
- 4,741,527 · +99.2%
Race, ethnicity, and origin ACS 2023
- Neighborhood character
- Diverse neighborhood (Simpson 0.55)
- Race & ethnicity
- White 62% Hispanic / Latino 22% Two or more races 10% Black 9% Asian 2% Native American 1%
- Hispanic origin (detail)
- Mexican 17% Puerto Rican 2%
- Common ancestry
- Slovak 3% Serbian 2% Lithuanian 2%
- Foreign-born
- 12% · Canada, Vietnam, South Korea
- Languages at home
- 78% English-only · Spanish 14% Other Indo-European 3% French/Haitian/Cajun 2%
Political lean MEDSL · Tarrant
- 2024 margin
- Lean R (+5.1) · D 46.7% · R 51.9% · Other 1.4%
- 2008→2024 swing
- +6.6pp toward D · 2008: -11.7pp · 2024: -5.1pp
- All cycles
- 2024: R+5.1 2020: D+0.2 2016: R+8.7 2012: R+15.7 2008: R+11.7
Not yet ingested
- Civics
- —
Market trends
- HPI YoY
- ▼ -223.22%
- Current HPI
- 279.046
- Rent YoY
- ▼ -1.60%
- Metro
- Dallas-Fort Worth-Arlington, TX
- State GDP YoY
- ▲ 3.95%
- F500 in state
- 110
Industry mix (Fortune 500 HQ in TX)
| Industry | F500 HQs | Revenue |
|---|---|---|
| Energy | 16 | $1,198B |
|
||
| Technology | 5 | $198B |
|
||
| Engineering / Construction | 4 | $72B |
|
||
| Energy Services | 3 | $60B |
|
||
| Utilities | 3 | $41B |
|
||
| Healthcare | 2 | $330B |
|
||
Price history
+393.9% since first listed30 events — show timeline
- 2026-05-11 Relisted — NTREIS
- 2026-05-06 Contingent — NTREIS
- 2026-04-28 Relisted — NTREIS
- 2026-04-20 Contingent — NTREIS
- 2026-02-26 Relisted — NTREIS
- 2026-02-20 Contingent — NTREIS
- 2026-02-14 Relisted — NTREIS
- 2026-02-12 Contingent — NTREIS
- 2026-02-01 Relisted — NTREIS
- 2026-01-26 Contingent — NTREIS
- 2025-12-15 Price Changed $229,900 NTREIS
- 2025-11-15 Price Changed $239,900 NTREIS
- 2025-10-16 Price Changed $249,900 NTREIS
- 2025-09-16 Price Changed $259,900 NTREIS
- 2025-08-17 Price Changed $269,900 NTREIS
- 2025-07-18 Listed $279,900 NTREIS
- 2025-06-17 Listing Removed — NTREIS
- 2025-03-04 Relisted — NTREIS
- 2025-02-23 Contingent — NTREIS
- 2024-12-10 Price Changed $270,000 NTREIS
- 2024-10-17 Price Changed $299,000 NTREIS
- 2024-09-27 Price Changed $315,000 NTREIS
- 2024-09-16 Price Changed $330,000 NTREIS
- 2024-09-06 Listed $340,000 NTREIS
- 2024-06-12 Sold (Public Records) — Public Records
- 2024-06-12 Sold (MLS) — NTREIS
- 2024-05-13 Price Changed $270,000 NTREIS
- 2024-05-04 Listed $299,999 NTREIS
- 2024-01-29 Sold (Public Records) — Public Records
- 1994-01-18 Sold (Public Records) $46,550 Public Records
Property tax history
+6.5%/yrLatest (2025): $6,520 · -1.0% YoY. Source: county tax records.
Cash-flow waterfall
monthlySold comps — $/sqft
last 12 mo · ≤1 miLoading sold comps…