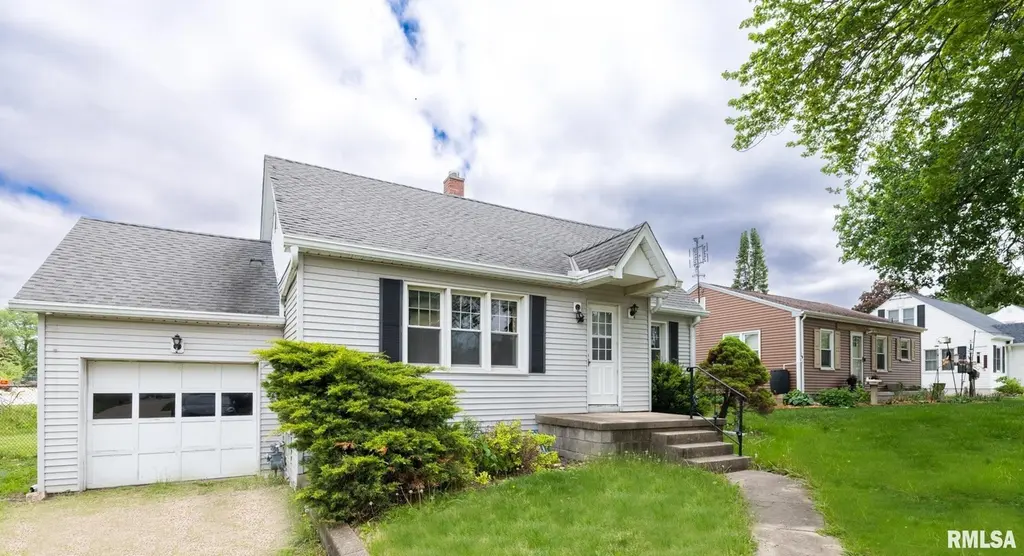
334 S Nelson Ave · Morton, IL
Flood risk 5/10 · Moderate
- FEMA flood zone
- X (unshaded)
- Chance of flooding over 30 yrs
- 0.5%
- Est. flood insurance / yr
- $473 – $860
Fire risk 1/10 · Minimal
- Est. fire insurance / yr
- $804 – $1,492
Heat risk 3/10 · Minor
- Hot days now (above 104°F)
- 7 days/yr
- Hot days in 30 yrs
- 18 days/yr
Wind risk 2/10 · Minimal
- Chance of severe wind over 30 yrs
- 1.0%
Air-quality risk 2/10 · Minimal
- Unhealthy air days now
- 1 days/yr
- Unhealthy air days in 30 yrs
- 2 days/yr
Risk factors via First Street. Map © Google.
Why this score? — see what drove the D+ grade
The composite is a weighted blend of 9 inputs, each scored 0–100. Each bar is that input's sub-score; the figure is the points it added to the 100-point composite (weight × sub-score).
- Cash flow +18.4/30.0
- ARV discount +6.1/15.0
- DSCR +5.8/10.0
- Schools +4.8/10.0
- 1% rule +4.6/10.0
- Livability +4.3/5.0
- Rent growth +2.5/5.0
- Condition / age +2.5/5.0
- Appreciation +0.0/10.0
$153,900
🖨 Deal sheet (PDF) 📄 Offer letter ✓ Due diligence
Listing remarks
MORTON SCHOOL DISTRICT! GREAT CURB APPEAL ON DEAD END STREET FOR THIS RANCH STYLE HOME WITH ATTACHED GARAGE. HOME DOES NEED SOME UPGRADES AND COSMETIC IMPROVEMENTS BUT REFLECTED IN THE PRICE INCLUDING NEEDS SOME NEW FLOORING. COULD BE WORTH MUCH MORE. GREAT INVESTMENT PROPERTY! SPACIOUS LIVING ROOM WITH LOTS OF DAYLIGHT PLUS KITCHEN LOADED WITH CABINETRY SPACE FOR STORAGE. FULL USABLE BASEMENT WITH LOADS OF STORAGE AREAS. IMMEDIATE POSSESSION. HOME SOLD IN AN ESTATE
Key facts
- Attached garage
- New flooring
- Dead end street
Tags
Property features AI
Exterior
- Parking: Attached garage (1 car); On-street parking available
- Utilities: Public water; Public sewer
- Home design: Single family residence; Built in 1947; One-story main level with upper, lower and basement levels
- Construction: Shingle roof
- Exterior features: Shed(s); Level lot on a dead-end street
Interior
- Kitchen: Refrigerator
- Bedrooms: 2 bedrooms (both on the main level)
- Flooring: Vinyl flooring in dining room and kitchen; Other flooring in bedrooms, living room and other areas
- Bathrooms: 1 full bathroom
- Heating & cooling: Forced air heating; Central air conditioning
- Interior features: Cable available; Full basement
- Laundry & utility: Washer; Dryer; Laundry room in basement
Neighborhood map
What this means for you Summary
Snapshot
- This is a 2-bed/1.0-bath single-family listed at $154k.
Deal economics
- At list price, monthly cash flow is $143 ($2k/yr) — positive.
- The deal already cash-flows at list — no discount required.
- To meet the 1% rule (rent ≥ 1% of price), the offer needs to be $147k (4.2% below list).
- Recommended offer: $147k (4.2% below list) — sets the bar for 1% rule.
- Cap rate 7.4% vs local median 2.9% in Morton — top-decile yield for the area; either an underpriced asset or a hidden risk that comps aren't pricing in. Stress-test before assuming the spread holds.
Location & tenants
- Location reads 86/100 on livability (#22 in IL, #419 nationally) — a professional / high-income tenant draw. Strengths: crime A+, employment A+, housing A+; Watch: commute F.
- Morton CUSD 709 (suburban): math 48% / reading 59% proficiency, ranked #41 of 620 in IL (top 7%) — acceptable for families but not a draw, mixed tenant base, ~2y average lease; only 12% free/reduced lunch — higher-income household profile.
- Zoned schools: Morton Jr High School (math 46% / reading 68%, grade B, #30 of 665 statewide, top 5%, 485 students, 0% FRL); Morton High School (math 52% / reading 51%, grade D+, #38 of 693 statewide, top 6%, 1,061 students, 0% FRL).
- Market conditions: 63 active listings in the ZIP; 2 comparable units currently listed for rent nearby; 77 units permitted in Tazewell County in 2024 (0 in 5+ unit buildings).
Forward outlook
- Local home prices are declining (-3.0%/yr); year-one equity from $1k of loan paydown is wiped out by about $5k of value loss. Plan a longer hold.
- Tazewell County population projected at -15% by 2050 — secular population decline; favor cash flow + early exit over multi-decade hold.
Negotiation context
- Only 12 days on market — expect competitive offers; lowballing is unlikely to land.
Risks & watch-outs
- Watch-outs: built in 1947 — expect roof / HVAC / electrical / plumbing capex.
- Climate carrying-cost: moderate flood risk — expect insurance premiums to compound above CPI over the hold.
Questions for the listing agent
- Built in 1947 — when were the roof, HVAC, electrical panel, plumbing, and water heater last replaced?
- Is there a deadline driving the sale (1031 exchange, divorce, estate, relocation)? That informs how much negotiation room exists.
- Schools are B-rated — typically a magnet for longer-tenancy family renters. What's the average tenant stay here, and is there a school-zone premium baked into asking?
- The area grade is low — what's the realistic commute time and amenity access for the typical tenant pool here? Any planned neighborhood developments (good or bad) we should know about?
- What's the average days-on-market for RENTAL listings here right now (not sales)? A rising rental-DOM trend means longer vacancies and softer asking-rent achievability than the comps imply.
- What's the recent tenant-quality profile in this submarket — average credit score on applications, eviction rate, late-payment / NSF rate, and stable-employment percentage? A property-management company in the area should have these aggregated.
- How much new for-sale + rental construction is in the pipeline within 1–3 miles? Heavy new supply typically softens prices + rents 12–24 months out; constrained supply supports both.
Investment metrics
- 1% rule
- 0.96% ✗
- Cap rate
- 7.41%
- Cash-on-cash
- 3.98%
- DSCR
- 1.18
- GRM
- 8.7
CMA / ARV
- ARV (median comp)
- $149,207
- List price
- $153,900
- Delta
- 3.15%
- Verdict
- FAIR
- Comps
- 20 within 1.0 mi
Show comp detail 6 sales within ~0.75 mi
| Address | Dist | Beds/Ba | Sqft | Sold | Price | $/sf | Match |
|---|---|---|---|---|---|---|---|
| 334 S Nelson Ave | 0.00mi | 2/1.0 | 916 (0%) | 0mo | $148,900 | $163 | 100 |
| 512 S Carol Ave | 0.18mi | 2/1.0 | 875 (-4%) | 12mo | $156,250 | $179 | 74 |
| 625 W Jefferson St | 0.44mi | 2/1.0 | 919 (+0%) | 14mo | $157,000 | $171 | 67 |
| 210 W Wagler St | 0.35mi | 2/2.0 | 982 (+7%) | 8mo | $167,500 | $171 | 61 |
| 605 N Main St | 0.70mi | 2/1.0 | 822 (-10%) | 2mo | $172,000 | $209 | 49 |
| 207 W Bond St | 0.62mi | 3/1.0 (+1) | 1,040 (+14%) | 10mo | $154,000 | $148 | 36 |
Match score weights: distance 35% · size 25% · config 20% · recency 20%. Top-matched comps best support the ARV.
Projected returns pro-forma
-3.0% appreciation · 3.0% rent growth · sell at horizon
- IRR
- -10.1%
- Equity multiple
- 0.63×
- Total profit
- $-15,842
- Equity at exit
- $22,947
- IRR
- -0.7%
- Equity multiple
- 0.95×
- Total profit
- $-2,091
- Equity at exit
- $13,306
Cash invested: $43,092 (down + closing). Projections, not guarantees.
Landlord ↔ Tenant lean methodology
- Overall (STATE)
- 43 Moderately Tenant-Leaning
- State Illinois
- 43 Moderately Tenant-Leaning · D+7
- County
- — inherits STATE
- City
- — inherits STATE
ZIP-level market 61550
- Active inventory
- 63
- Price-to-rent
- 8.7×
Monthly cashflow live
- Estimated rent
- $1,474 medium interval (Pro) →
- Mortgage (P&I)
- −$807
- Tax from tax record
- −$150 /mo · $1,806/yr
- Insurance
- −$64
- HOA
- −$0
- Vacancy / Maint / Mgmt
- −$310
- Net cashflow
- $143
Break-even live
Sensitivity live
| Price | -10% $230 | -5% $186 | +0% $143 | +5% $99 | +10% $56 |
|---|---|---|---|---|---|
| Rent | -10% $26 | -5% $85 | +0% $143 | +5% $201 | +10% $259 |
| Rate | -1.0pp $220 | -0.5pp $182 | base $143 | +0.5pp $103 | +1.0pp $62 |
UW: 25.0% down · 7.5% · 30yr · 1.5% tax · 5.0% vac · 8.0% maint · 8.0% mgmt
Financing live
Cash to close
- Down payment
- $38,475
- Closing costs
- $4,617
- Reserves months
- —
- Total cash needed
- —
Loan-product check · same deal, 3 products live
Conventional
25% down · 7.5% · 30yr
- Down + closing
- —
- Monthly P&I
- —
- Monthly cashflow
- —
- DSCR
- —
- Eligible?
- —
Personal DTI + credit; lowest rate.
DSCR
20% down · 8.5% · 30yr
- Down + closing
- —
- Monthly P&I
- —
- Monthly cashflow
- —
- DSCR
- —
- Eligible?
- —
No personal income docs; deal must DSCR.
Hard money
10% down · 12.0% · 12mo
- Down + closing
- —
- Monthly P&I
- —
- Monthly cashflow
- —
- DSCR
- —
- Eligible?
- —
Short-term bridge; refi at stabilization.
Rent comps 2 comps
| Address | Beds | Baths | Sqft | Rent | $/sqft | DOM | Units | Dist |
|---|---|---|---|---|---|---|---|---|
| 514 N Main St Morton, IL | 2.0 | 1.0 | 1087 | $1,600 | $1.47 | 23d | 1 | 0.55mi |
| 1240 S Main St Morton, IL | 1.0–2.0 | 1.0–1.5 | 1000 | $1,300 | $1.30 | 15d | 2 | 0.83mi |
Listing history 3 events
-
2026-05-12status Pending 471-char remark
-
2026-05-04price $153,900 471-char remark
-
2026-04-30$164,900 Active 471-char remark
ⓘ Source: listings_history table (triggers on properties + properties_extension) + one-shot
backfill from property_details.listing_events for pre-trigger history.
Tax reassessment forecast IL · Partial reset (capped growth)
- Current annual tax
- $1,806 · $150/mo
- Projected year-2 tax
- $2,650 · $221/mo
- Expected delta
- +$844/yr (+$70/mo · 46.7%)
ⓘ Screening estimate from a state-policy table — verify with the county assessor before closing.
Climate risk First Street
- Flood 5/10 Major FEMA zone X (unshaded) · 50% chance over 30 yrs
- Wildfire 1/10 Low
- Heat 3/10 Moderate 7 d/yr ≥104°F today · 18 d/yr by 30 yrs out
- Wind 2/10 Low 100% chance of damaging wind over 30 yrs
- Air quality 2/10 Low 1 unhealthy d/yr today · 2 by 30 yrs out
Nearby sold comps map
Loading sold comps map…
Walkable amenities ~0.75 mi
Loading nearby amenities…
Taxation est. · year 1
- Rental income
- $17,689
- − Mortgage interest
- −$8,621
- − Property taxes
- −$1,806
- − Insurance
- −$770
- − Repairs & maintenance
- −$1,415
- − Management
- −$1,415
- − Depreciation
- −$4,477
- Taxable loss
- −$814
- Est. tax savings @ 24.0%
- +$195
- After-tax cash flow
- $1,910/yr
For passive investors: Depreciation is non-cash, so a rental often shows a tax loss while cash-flowing — sheltering income. Rental losses are passive: they offset passive income freely, and up to $25,000/yr can offset ordinary (W-2) income if you actively participate and your MAGI is under $100k (phasing out to $0 by $150k); unused losses carry forward. On sale, claimed depreciation is recaptured at up to 25%, and gains may owe capital-gains tax (a 1031 exchange can defer both). Figures are a year-1 estimate at your 24.0% rate — not tax advice; consult a CPA.
Schools (NCES district)
- District
- Morton CUSD 709
- NCES district ID
- 1726800
- Math proficiency
- 48% ▼ -3.00%
- Reading proficiency
- 59% ▼ -6.00%
- Median HH income
- $71,729
- Composite
- 47.72/100
- National rank
- #2239
- State rank
- #41 of 620 in IL
Livability — Morton
- Score
- 86/100
- State rank
- #22
- US rank
- #419
Category grades
Schools grade is shown separately in the Schools card above.
Census & demographics
- Census place
- Morton, IL
- City population
- 18,688
- Population (ZIP)
- 18,688
Population outlook (Tazewell County) Hauer SSP2
- Today (2025)
- 131,252 people
- By 2030
- 128,028 · -2.5%
- By 2040
- 120,443 · -8.2%
- By 2050
- 111,872 · -14.8%
- By 2075
- 89,843 · -31.5%
- By 2100
- 66,468 · -49.4%
Race, ethnicity, and origin ACS 2023
- Neighborhood character
- Predominantly White (92%)
- Race & ethnicity
- White 92% Two or more races 3% Asian 3% Hispanic / Latino 2%
- Common ancestry
- Italian 4% Lithuanian 3% Romanian 2%
- Foreign-born
- 2% · China
- Languages at home
- 97% English-only · Chinese 1% Spanish 1% Other Indo-European 1%
Political lean MEDSL · Tazewell
- 2024 margin
- Strong R (+26.7) · D 35.8% · R 62.5% · Other 1.8%
- 2008→2024 swing
- -20.6pp toward R · 2008: -6.0pp · 2024: -26.7pp
- All cycles
- 2024: R+26.7 2020: R+25.6 2016: R+28.5 2012: R+17.9 2008: R+6.0
Not yet ingested
- Civics
- —
Market trends
- HPI YoY
- ▼ -102.61%
- Current HPI
- 159.6287
- Rent YoY
- —
- Metro
- —
- State GDP YoY
- ▲ 1.59%
- F500 in state
- 60
Industry mix (Fortune 500 HQ in IL)
| Industry | F500 HQs | Revenue |
|---|---|---|
| Insurance | 4 | $201B |
|
||
| Consumer Goods | 4 | $87B |
|
||
| Industrial Machinery | 3 | $64B |
|
||
| Healthcare | 2 | $55B |
|
||
| Retail / Pharmacy | 1 | $148B |
|
||
| Agriculture / Food | 1 | $86B |
|
||
Price history
-9.7% since first listed4 events — show timeline
- 2026-06-15 Sold (MLS) $148,900 RMLSA as Distributed by MLS Grid
- 2026-05-12 Pending — RMLSA as Distributed by MLS Grid
- 2026-05-04 Price Changed $153,900 RMLSA as Distributed by MLS Grid
- 2026-04-30 Listed $164,900 RMLSA as Distributed by MLS Grid
Property tax history
+3.6%/yrLatest (2024): $1,806 · +31.5% YoY. Source: county tax records.
Cash-flow waterfall
monthlySold comps — $/sqft
last 12 mo · ≤1 miLoading sold comps…