 Fourplex
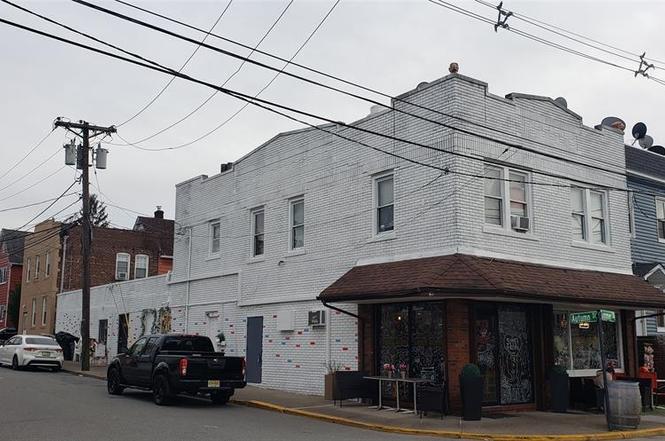
17 Summer St · Lodi, NJ
Flood risk No data
- FEMA flood zone
- —
- Chance of flooding over 30 yrs
- —
- Est. flood insurance / yr
- —
Fire risk No data
- Est. fire insurance / yr
- —
Heat risk No data
- Hot days now (above threshold)
- —
- Hot days in 30 yrs
- —
Wind risk No data
- Chance of severe wind over 30 yrs
- —
Air-quality risk No data
- Unhealthy air days now
- —
- Unhealthy air days in 30 yrs
- —
Risk factors via First Street. Map © Google.
Why this score? — see what drove the D+ grade
The composite is a weighted blend of 9 inputs, each scored 0–100. Each bar is that input's sub-score; the figure is the points it added to the 100-point composite (weight × sub-score).
- Cash flow +16.3/30.0
- ARV discount +7.5/15.0
- DSCR +5.1/10.0
- 1% rule +4.5/10.0
- Rent growth +3.7/5.0
- Livability +3.4/5.0
- Schools +2.9/10.0
- Condition / age +2.5/5.0
- Appreciation +0.0/10.0
$926,000
🖨 Deal sheet 📄 Offer letter ✓ Due diligence
Multi-family units
County records classify this as Multi-Family (5+ Unit). Listing-text estimate: 4 units. estimate disagrees with records
5+ unit building — per-unit beds/baths from public records are typically unavailable; the breakdown below (if shown) is an estimate from the listing text.
Listing remarks
Corner property just behind of shopping mall with Amazon Fresh, Aldi tenants , 2story 4unit mixed use( 2 commercial unit+ 2 apt), 1st floor : one tenant use two units together ( front unit; cafe, rear unit: catering & party), 2nd floor; 2apt (1bed each) , separate gas & heating electricity. The 75% of water bill paid by the cafe
Key facts
- Mixed use
- Separate gas
- Commercial unit
Tags
Property features AI
Exterior
- Home design: Residential income property; Mixed-use property
- Exterior features: Asphalt roof
Neighborhood map
What this means for you Summary
Snapshot
- This is a 4 × 1-bed/1.0-bath units multifamily listed at $926k.
Deal economics
- At list price, monthly cash flow is $516 ($6k/yr) — positive. Per door: $129/mo.
- The deal already cash-flows at list — no discount required.
- To meet the 1% rule (rent ≥ 1% of price), the offer needs to be $875k (5.5% below list).
- Recommended offer: $815k (12.0% below list) — sets the bar for market timing.
- Cap rate 7.0% vs local median 2.0% in Lodi — top-decile yield for the area; either an underpriced asset or a hidden risk that comps aren't pricing in. Stress-test before assuming the spread holds.
Location & tenants
- Location reads 67/100 on livability (#342 in NJ) — a middle-class / working-renter tenant base. Strengths: schools A-, crime A-, employment B+; Watch: amenities D-, commute F, cost of living F.
- Lodi School District (suburban): math 18% / reading 49% proficiency, ranked #315 of 472 in NJ (top 67%) — families likely to look elsewhere, expect single-tenant / working-renter base with shorter leases.
- Market conditions: Rents rising fast (+4.8%/yr); 38 active listings in the ZIP; 40 comparable units currently listed for rent nearby; rentals at typical pace (median 21d on market — plan ~3-4 weeks tenant-placement turnaround); solid renter incomes; 3,488 units permitted in Bergen County in 2024 (1,610 in 5+ unit buildings).
- At $8,754/mo this rent would consume 118% of the median local household income ($89k/yr) (locally 1445% of renters already pay >50% of income on rent) — very limited rent-growth headroom before tenants either downsize or default.
Forward outlook
- Local home prices are declining (-3.0%/yr); year-one equity from $6k of loan paydown is wiped out by about $28k of value loss. Plan a longer hold.
- Bergen County population projected at +20% by 2050 — long-run rental-demand tailwind backs the buy-and-hold thesis.
Negotiation context
- It's been on market 160 days — a 12% lower offer ($815k) is reasonable based on typical stale-listing flexibility.
- 2 sale attempts with the ask held roughly flat each time — persistent listings suggest the price (not the market) is what's stuck; bring a comps-based counter.
Questions for the listing agent
- It's been on market 160 days. Have you received any prior offers? Is the seller open to a 12% concession, seller financing, or rate buy-down credit?
- Can we see the unit-by-unit rent roll, current vacancy, and any below-market leases? What's the average tenancy length?
- What capital expenditures (roof, boiler, parking lot, exteriors) have been made in the last 5 years, and what's planned in the next 2?
- Why hasn't it sold? Are there any deal-killer items the seller is aware of (foundation, flood, title, zoning, code violations)?
- Is there a deadline driving the sale (1031 exchange, divorce, estate, relocation)? That informs how much negotiation room exists.
- Schools are A-rated — typically a magnet for longer-tenancy family renters. What's the average tenant stay here, and is there a school-zone premium baked into asking?
- The area grade is low — what's the realistic commute time and amenity access for the typical tenant pool here? Any planned neighborhood developments (good or bad) we should know about?
- What's the average days-on-market for RENTAL listings here right now (not sales)? A rising rental-DOM trend means longer vacancies and softer asking-rent achievability than the comps imply.
- What's the recent tenant-quality profile in this submarket — average credit score on applications, eviction rate, late-payment / NSF rate, and stable-employment percentage? A property-management company in the area should have these aggregated.
- How much new apartment / multifamily construction is in the pipeline within 1–3 miles? Heavy new supply (>2% of stock underway) typically softens rents 12–24 months out; light construction supports rent growth.
Investment metrics
- 1% rule
- 0.95% ✗
- Cap rate
- 6.96%
- Cash-on-cash
- 2.39%
- DSCR
- 1.11
- GRM
- 8.8
CMA / ARV
No comps found within radius.
Show comp detail 12 sales within ~0.75 mi
| Address | Dist | Beds/Ba | Sqft | Sold | Price | $/sf | Match |
|---|---|---|---|---|---|---|---|
| 54 Spring St | 0.06mi | 4/2.0 | — | 2mo | $650,000 | — | 83 |
| 22 Bernice Pl | 0.21mi | 5/3.0 | — | 2mo | $672,000 | — | 76 |
| 175 Union St | 0.37mi | 4/1.5 | — | 2mo | $720,000 | — | 69 |
| 45 Arnot St | 0.36mi | 6/2.0 | — | 2mo | $760,000 | — | 69 |
| 89 Norwood Ave | 0.42mi | 6/4.5 | — | 1mo | $999,000 | — | 67 |
| 144 S Main St | 0.37mi | 6/3.5 | — | 4mo | $940,000 | — | 67 |
| 93 Richmond St | 0.51mi | 5/4.0 | — | 3mo | $992,500 | — | 61 |
| 102 Charlton Ave | 0.60mi | 4/3.5 | — | 4mo | $1,150,000 | — | 57 |
| 247 Malcolm Ave | 0.68mi | 5/3.0 | — | 0mo | $757,000 | — | 56 |
| 89 Westminster Pl | 0.66mi | 4/2.0 | — | 2mo | $789,000 | — | 56 |
| 363 Macarthur Ave | 0.65mi | 7/3.0 | — | 3mo | $699,900 | — | 54 |
| 19 Victor St | 0.71mi | 4/2.0 | — | 2mo | $805,000 | — | 53 |
Match score weights: distance 35% · size 25% · config 20% · recency 20%. Top-matched comps best support the ARV.
Projected returns pro-forma
-3.0% appreciation · 4.85% rent growth · sell at horizon
- IRR
- -10.4%
- Equity multiple
- 0.61×
- Total profit
- $-100,443
- Equity at exit
- $138,070
- IRR
- 1.3%
- Equity multiple
- 1.10×
- Total profit
- $26,134
- Equity at exit
- $80,064
Cash invested: $259,280 (down + closing). Projections, not guarantees.
Landlord ↔ Tenant lean methodology
- Overall (STATE)
- 21 Tenant-Leaning
- State New Jersey
- 21 Tenant-Leaning · D+6
- County
- — inherits STATE
- City
- — inherits STATE
ZIP-level market 07644
- Home prices YoY
- -12.0%
- Rents YoY
- 4.8%
- Active inventory
- 38
- Price-to-rent
- 35.3×
Monthly cashflow live
- Estimated rent
- $8,754 high interval (Pro) →
- Mortgage (P&I)
- −$4,856
- Tax est. 1.5%
- −$1,158 /mo · $13,890/yr
- Insurance
- −$386
- HOA
- −$0
- Vacancy / Maint / Mgmt
- −$1,838
- Net cashflow
- $516
Break-even live
4-unit breakdown (identical units grouped — click to expand)
| Units | Beds | Baths | Est. rent |
|---|---|---|---|
| 4× units | 1 | 1 | $8,756 |
| #1 | 1 | 1 | $2,189 |
| #2 | 1 | 1 | $2,189 |
| #3 | 1 | 1 | $2,189 |
| #4 | 1 | 1 | $2,189 |
| Total (4 units) | $8,754 | ||
UW: 25.0% down · 7.5% · 30yr · 1.5% tax · 5.0% vac · 8.0% maint · 8.0% mgmt
Financing live
Cash to close
- Down payment
- $231,500
- Closing costs
- $27,780
- Reserves months
- —
- Total cash needed
- —
Loan-product check · same deal, 3 products live
Conventional
25% down · 7.5% · 30yr
- Down + closing
- —
- Monthly P&I
- —
- Monthly cashflow
- —
- DSCR
- —
- Eligible?
- —
Personal DTI + credit; lowest rate.
DSCR
20% down · 8.5% · 30yr
- Down + closing
- —
- Monthly P&I
- —
- Monthly cashflow
- —
- DSCR
- —
- Eligible?
- —
No personal income docs; deal must DSCR.
Hard money
10% down · 12.0% · 12mo
- Down + closing
- —
- Monthly P&I
- —
- Monthly cashflow
- —
- DSCR
- —
- Eligible?
- —
Short-term bridge; refi at stabilization.
Rent comps 40 comps
| Address | Beds | Baths | Sqft | Rent | $/sqft | DOM | Units | Dist |
|---|---|---|---|---|---|---|---|---|
| 56 Spring St Lodi, NJ | 3.0 | 1.0 | — | $2,690 | — | 1d | 1 | 0.07mi |
| 55 Spring St Unit 2 Lodi, NJ | 2.0 | 1.0 | — | $2,400 | — | 11d | 1 | 0.08mi |
| 55 Spring St Unit 1 Lodi, NJ | 3.0 | 2.0 | — | $3,000 | — | 12d | 1 | 0.08mi |
| 61 Spring St Unit 1st floor Lodi, NJ | 3.0 | 2.0 | — | $2,800 | — | 14d | 1 | 0.08mi |
| 44 S Main St Lodi, NJ | 1.0 | 1.0 | 740 | $2,250 | $3.04 | 2d | 2 | 0.11mi |
| 44 S Main St Unit 6F Lodi, NJ | 1.0 | 1.0 | — | $2,100 | — | 24d | 1 | 0.11mi |
| 25 James St #2 Lodi, NJ | 3.0 | 2.0 | — | $3,300 | — | 24d | 1 | 0.13mi |
| 35 East Pl Lodi, NJ | 3.0 | 2.0 | — | $2,800 | — | 24d | 1 | 0.14mi |
| 13 Roosevelt Ave Unit A Lodi, NJ | 3.0 | 3.0 | — | $4,000 | — | 24d | 1 | 0.15mi |
| 49 Prospect St Lodi, NJ | 2.0 | 1.0 | — | $2,200 | — | 24d | 1 | 0.17mi |
| 60 Roosevelt Ave Unit 2ND FLR Lodi, NJ | 2.0 | 1.0 | — | $2,000 | — | 24d | 1 | 0.22mi |
| 68 Liberty St Unit 1st floor Lodi, NJ | 3.0 | 2.0 | — | $3,100 | — | 24d | 1 | 0.22mi |
| 15 Bernice Pl Unit 2 Lodi, NJ | 2.0 | 1.0 | — | $2,300 | — | 20d | 1 | 0.25mi |
| 133 Washington St Unit 1 Lodi, NJ | 3.0 | 1.0 | — | $2,850 | — | 2d | 1 | 0.26mi |
| 12 Madison Ave Unit 1 Lodi, NJ | 2.0 | 1.5 | — | $2,600 | — | 24d | 1 | 0.27mi |
| 14 River St Lodi, NJ | 1.0 | 1.0 | — | $1,750 | — | 24d | 1 | 0.29mi |
| 124 S Main St Unit back Lodi, NJ | 3.0 | 1.0 | — | $2,500 | — | 24d | 1 | 0.29mi |
| 120 Union St Lodi, NJ | 2.0 | 1.0 | — | $2,450 | — | 10d | 1 | 0.29mi |
| 126 Union St Lodi, NJ | 2.0 | 1.5 | — | $2,000 | — | 21d | 1 | 0.30mi |
| 61 Union St Lodi, NJ | 3.0 | 1.0 | — | $2,600 | — | 21d | 1 | 0.30mi |
| 11 Massey St Lodi, NJ | 1.0 | 1.0 | 710 | $2,050 | $2.89 | 16d | 2 | 0.32mi |
| 37 Corabelle Ave Lodi, NJ | 2.0 | 1.0 | — | $2,250 | — | 2d | 1 | 0.34mi |
| 144 S Main St Unit 1 Lodi, NJ | 2.0 | 2.0 | — | $2,700 | — | 11d | 1 | 0.35mi |
| 144 S Main St Unit 1 Lodi, NJ | 2.0 | 2.0 | — | $2,650 | — | 2d | 1 | 0.35mi |
| 385 Passaic Ave Unit 3 Lodi, NJ | 2.0 | 2.0 | — | $3,200 | — | 6d | 1 | 0.36mi |
| 34 Burns Ave Unit 1 Lodi, NJ | 1.0 | 1.0 | — | $1,900 | — | 24d | 1 | 0.36mi |
| 48 Burns Ave Unit 2 Lodi, NJ | 3.0 | 2.0 | — | $3,690 | — | 4d | 1 | 0.37mi |
| 28 Burns Ave Unit 1 Lodi, NJ | 1.0 | 1.0 | — | $1,700 | — | 12d | 1 | 0.37mi |
| 173 Paterson Ave Fl 1 Lodi, NJ | 2.0 | 1.0 | — | $2,500 | — | 18d | 1 | 0.38mi |
| 61 Chestnut St Unit 2 Lodi, NJ | 3.0 | 2.0 | — | $3,900 | — | 7d | 1 | 0.43mi |
| 60 Church St Unit First Floor Lodi, NJ | 3.0 | 2.0 | — | $2,950 | — | 1d | 1 | 0.44mi |
| 94 1st St Lodi, NJ | 2.0 | 1.0 | 1000 | $2,100 | $2.10 | 6d | 1 | 0.45mi |
| 125 McKinley Ave Lodi, NJ | 3.0 | 2.0 | — | $2,900 | — | 24d | 1 | 0.45mi |
| 238 Westminster Pl Lodi, NJ | 3.0 | 1.0 | — | $3,000 | — | 24d | 1 | 0.46mi |
| 15 Dell Glen Ave Unit 2 Lodi, NJ | 3.0 | 1.0 | — | $3,000 | — | 24d | 1 | 0.48mi |
| 15 Dell Glen Ave Unit 1st floor Lodi, NJ | 1.0 | 1.0 | — | $2,000 | — | 10d | 1 | 0.48mi |
| 81 Church St #4 Lodi, NJ | 2.0 | 1.5 | — | $2,900 | — | 24d | 1 | 0.48mi |
| 285 Westminster Pl Lodi, NJ | 2.0 | 1.0 | — | $2,350 | — | 24d | 1 | 0.49mi |
| 25 Dell Glen Ave Lodi, NJ | 3.0 | 1.0 | — | $2,995 | — | 7d | 1 | 0.50mi |
| 309 Westminster Pl Lodi, NJ | 1.0 | 1.0 | 800 | $2,500 | $3.12 | 24d | 1 | 0.51mi |
Listing history 15 events
-
2026-06-18days on market $926,000 Active 160 DOM
-
2026-06-17days on market $926,000 Active 159 DOM
-
2026-06-16days on market $926,000 Active 158 DOM
-
2026-06-15days on market $926,000 Active 157 DOM
-
2026-06-13days on market $926,000 Active 155 DOM
-
2026-06-09days on market $926,000 Active 151 DOM
-
2026-06-08days on market $926,000 Active 150 DOM
-
2026-06-07days on market $926,000 Active 149 DOM
-
2026-06-04days on market $926,000 Active 146 DOM
-
2026-06-03days on market $926,000 Active 145 DOM
-
2026-06-02days on market $926,000 Active 144 DOM
-
2026-06-01days on market $926,000 Active 143 DOM
-
2026-05-31days on market $926,000 Active 142 DOM
-
2026-03-02status Active
-
2026-01-09$926,000 Active
ⓘ Source: listings_history table (triggers on properties + properties_extension) + one-shot
backfill from property_details.listing_events for pre-trigger history.
Nearby sold comps map
Loading sold comps map…
Walkable amenities ~0.75 mi
Loading nearby amenities…
Taxation est. · year 1
- Rental income
- $105,048
- − Mortgage interest
- −$51,870
- − Property taxes
- −$13,890
- − Insurance
- −$4,630
- − Repairs & maintenance
- −$8,404
- − Management
- −$8,404
- − Depreciation
- −$26,938
- Taxable loss
- −$9,088
- Est. tax savings @ 24.0%
- +$2,181
- After-tax cash flow
- $8,377/yr
For passive investors: Depreciation is non-cash, so a rental often shows a tax loss while cash-flowing — sheltering income. Rental losses are passive: they offset passive income freely, and up to $25,000/yr can offset ordinary (W-2) income if you actively participate and your MAGI is under $100k (phasing out to $0 by $150k); unused losses carry forward. On sale, claimed depreciation is recaptured at up to 25%, and gains may owe capital-gains tax (a 1031 exchange can defer both). Figures are a year-1 estimate at your 24.0% rate — not tax advice; consult a CPA.
Schools (NCES district)
- District
- Lodi School District
- NCES district ID
- 3408850
- Math proficiency
- 18% ▼ -32.00%
- Reading proficiency
- 49% ▼ -24.00%
- Median HH income
- $54,154
- Composite
- 29.38/100
- National rank
- #6528
- State rank
- #315 of 472 in NJ
Livability — Lodi
- Score
- 67/100
- State rank
- #342
- US rank
- #11056
Category grades
Schools grade is shown separately in the Schools card above.
Census & demographics
- Census place
- Lodi, NJ
- County
- Bergen County · 586,961 people
- City population
- 26,082
- Metro
- New York-Newark-Jersey City, NY-NJ-PA
- Population (ZIP)
- 26,082
- Household income
- $89,305
- Rent vs Own
- Severe rent burden
- 1445.0
Population outlook (Bergen County) Hauer SSP2
- Today (2025)
- 1,021,896 people
- By 2030
- 1,063,119 · +4.0%
- By 2040
- 1,146,566 · +12.2%
- By 2050
- 1,229,132 · +20.3%
- By 2075
- 1,429,694 · +39.9%
- By 2100
- 1,547,614 · +51.4%
Race, ethnicity, and origin ACS 2023
- Neighborhood character
- Diverse neighborhood (Simpson 0.67)
- Race & ethnicity
- Hispanic / Latino 40% White 39% Two or more races 20% Black 8% Asian 8%
- Hispanic origin (detail)
- Mexican 2% Puerto Rican 4% Cuban 1% Dominican 12%
- Common ancestry
- Romanian 4% Russian 3% Scottish 1%
- Foreign-born
- 38% · Canada, Jamaica, India
- Languages at home
- 48% English-only · Spanish 33% Other Indo-European 7% Tagalog/Filipino 3%
Political lean MEDSL · Bergen
- 2024 margin
- Toss-up / Even · D 50.7% · R 47.3% · Other 2.0%
- 2008→2024 swing
- -6.1pp toward R · 2008: 9.5pp · 2024: 3.4pp
- All cycles
- 2024: D+3.4 2020: D+16.4 2016: D+12.0 2012: D+10.8 2008: D+9.5
Not yet ingested
- Civics
- —
Market trends
- HPI YoY
- ▼ -45.34%
- Current HPI
- 333.1595
- Rent YoY
- ▲ 4.85%
- Metro
- New York-Newark-Jersey City, NY-NJ-PA
- State GDP YoY
- ▲ 2.05%
- F500 in state
- 34
Industry mix (Fortune 500 HQ in NJ)
| Industry | F500 HQs | Revenue |
|---|---|---|
| Consumer Goods | 3 | $31B |
|
||
| Pharmaceuticals | 2 | $153B |
|
||
| Technology | 2 | $21B |
|
||
| Insurance | 2 | $20B |
|
||
| Healthcare | 2 | $19B |
|
||
| Financial Services | 1 | $70B |
|
||
Price history
2 events — show timeline
- 2026-03-02 Relisted — NJMLS
- 2026-01-09 Listed $926,000 NJMLS
Cash-flow waterfall
monthlySold comps — $/sqft
last 12 mo · ≤1 miLoading sold comps…