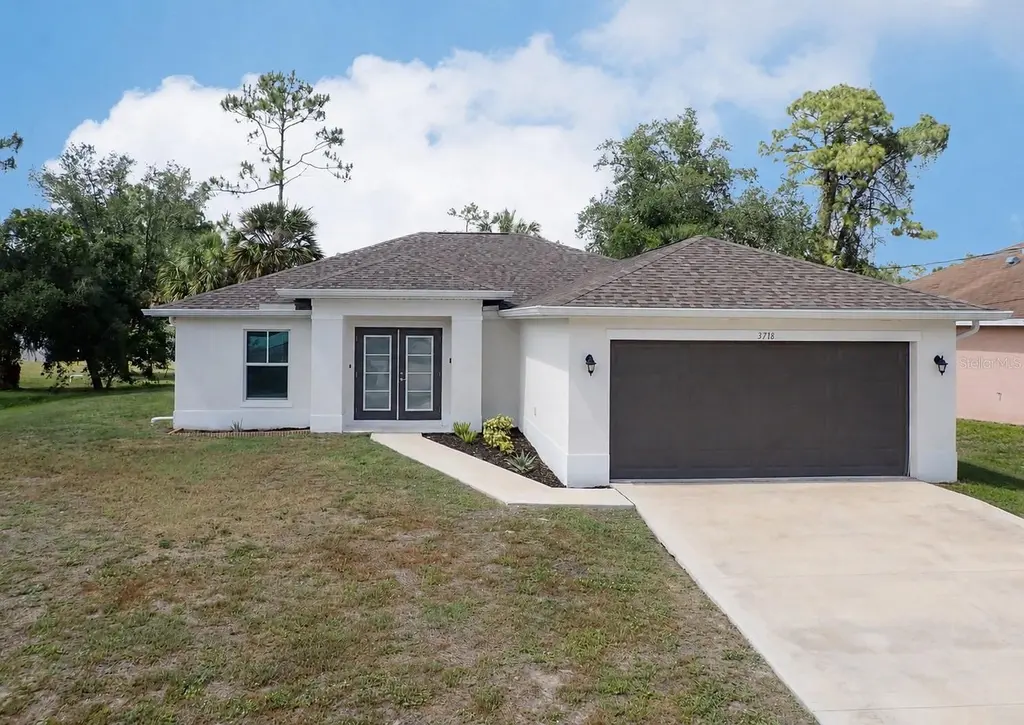
3718 Donahue Ave · North Port, FL
Flood risk 2/10 · Minimal
- FEMA flood zone
- X (unshaded)
- Chance of flooding over 30 yrs
- 0.05%
- Est. flood insurance / yr
- $507 – $1,088
Fire risk 1/10 · Minimal
- Est. fire insurance / yr
- $947 – $1,759
Heat risk 10/10 · Severe
- Hot days now (above 108°F)
- 7 days/yr
- Hot days in 30 yrs
- 28 days/yr
Wind risk 10/10 · Severe
- Chance of severe wind over 30 yrs
- 99.0%
Air-quality risk 3/10 · Minor
- Unhealthy air days now
- 2 days/yr
- Unhealthy air days in 30 yrs
- 2 days/yr
Risk factors via First Street. Map © Google.
Why this score? — see what drove the D- grade
The composite is a weighted blend of 9 inputs, each scored 0–100. Each bar is that input's sub-score; the figure is the points it added to the 100-point composite (weight × sub-score).
- ARV discount +15.0/15.0
- Cash flow +7.4/30.0
- Schools +5.4/10.0
- Livability +3.8/5.0
- Condition / age +2.5/5.0
- 1% rule +2.2/10.0
- DSCR +1.5/10.0
- Rent growth +1.2/5.0
- Appreciation +0.0/10.0
$299,900
🖨 Deal sheet (PDF) 📄 Offer letter ✓ Due diligence
Listing remarks
Under contract-accepting backup offers. One or more photo(s) has been virtually staged. PLEASE SEE THE 3D INTERACTIVE TOUR! Better than new and built in 2023, this stunning 4-bedroom, 2-bathroom home with a 2-car garage offers modern design, quality finishes, and peace of mind in one of Southwest Florida's fastest-growing communities. Featuring a desirable open-concept floor plan, this home is highlighted by luxury vinyl plank flooring throughout, creating a seamless and low-maintenance living space. The spacious kitchen is designed to impress with elegant quartz countertops, stylish shaker-style cabinetry, stainless steel appliances, and ample counter space—perfect for both everyday
Key facts
- 3d interactive tour
- 0.23 acre lot
- 2 garage spots
Tags
Property features AI
Finance
- Other: Property type: Residential, single-family; Zoning: RSF2
- Financial info: Lease restrictions apply
- HOA & community: No association indicated
Exterior
- Parking: Attached garage with garage door opener; 2-car garage
- Utilities: Well water; Septic sewer; Cable available
- Home design: Single-family residence; One story; Faces south
- Construction: Block and stucco construction; Shingle roof; Slab foundation; Built by Kanopy Homes (Builder model: Banyan)
- Exterior features: Sliding doors; Paved public road access; Lot about 0.23 acres (0 to less than 1/4 acre)
Interior
- Kitchen: Dishwasher; Microwave; Range; Refrigerator
- Bedrooms: 4 bedrooms
- Bathrooms: 2 full bathrooms
- Heating & cooling: Central heating; Central air
- Interior features: Open floorplan; Solid surface counters; Solid wood cabinets; Thermostat; Vaulted ceilings
- Laundry & utility: Inside laundry room; Electric water heater
Neighborhood map
What this means for you Summary
Snapshot
- This is a 3-bed/2.0-bath single-family listed at $300k.
Deal economics
- At list price, monthly cash flow is $-386 ($-5k/yr) — negative.
- To cash-flow at today's rent, offer at most $232k (22.7% below list).
- To meet the 1% rule (rent ≥ 1% of price), the offer needs to be $215k (28.4% below list).
- Recommended offer: $215k (28.4% below list) — sets the bar for 1% rule.
- Cap rate 4.7% vs local median 3.8% in North Port — meaningfully above typical; check what's discounted (condition, days-on-market, listing class) to confirm the premium yield is real.
Location & tenants
- Location reads 75/100 on livability (#252 in FL, #3,975 nationally) — a middle-class / working-renter tenant base. Strengths: crime A+, housing A+, health & safety A+; Watch: amenities F, commute F.
- Sarasota (urban): math 63% / reading 63% proficiency, ranked #7 of 73 in FL (top 10%) — acceptable for families but not a draw, mixed tenant base, ~2y average lease.
- Zoned schools: Atwater Elementary (math 68% / reading 63%, grade B+, #500 of 2,144 statewide, top 24%, 802 students, 65% FRL); Woodland Middle School (math 57% / reading 57%, grade B, #164 of 571 statewide, top 30%, 978 students, 55% FRL); North Port High School (math 44% / reading 57%, grade D+, #171 of 667 statewide, top 26%, 2,562 students, 54% FRL) — zoned schools average 58% FRL vs 42% district-wide (16 pts higher); higher-poverty schools than district average — tighter screening recommended.
- Market conditions: Rents falling (-5.4%/yr); 1401 active listings in the ZIP; 9 comparable units currently listed for rent nearby; rentals at typical pace (median 23d on market — plan ~3-4 weeks tenant-placement turnaround); solid renter incomes; 7,466 units permitted in Sarasota County in 2024 (2,138 in 5+ unit buildings).
- This rent runs 31% of the median local income ($84k/yr) — at the standard rent-burdened threshold; future hikes will face affordability resistance.
Forward outlook
- Local home prices are declining (-3.0%/yr); year-one equity from $2k of loan paydown is wiped out by about $9k of value loss. Plan a longer hold.
- Sarasota County population projected at +20% by 2050 — long-run rental-demand tailwind backs the buy-and-hold thesis.
Negotiation context
- Only 5 days on market — expect competitive offers; lowballing is unlikely to land.
- 4 sale attempts with the ask held roughly flat each time — persistent listings suggest the price (not the market) is what's stuck; bring a comps-based counter.
Risks & watch-outs
- Climate carrying-cost: severe wind risk, 99% chance of damaging wind over 30y; extreme-heat days projected 7→28/yr by 2055 (HVAC capex compounding) — expect insurance premiums to compound above CPI over the hold.
Questions for the listing agent
- What do current leases actually rent for vs. the listed asking? Can we see a recent rent roll and the last 12 months of T-12 income?
- Is there a deadline driving the sale (1031 exchange, divorce, estate, relocation)? That informs how much negotiation room exists.
- Schools are B-rated — typically a magnet for longer-tenancy family renters. What's the average tenant stay here, and is there a school-zone premium baked into asking?
- The area grade is low — what's the realistic commute time and amenity access for the typical tenant pool here? Any planned neighborhood developments (good or bad) we should know about?
- What's the average days-on-market for RENTAL listings here right now (not sales)? A rising rental-DOM trend means longer vacancies and softer asking-rent achievability than the comps imply.
- What's the recent tenant-quality profile in this submarket — average credit score on applications, eviction rate, late-payment / NSF rate, and stable-employment percentage? A property-management company in the area should have these aggregated.
- How much new for-sale + rental construction is in the pipeline within 1–3 miles? Heavy new supply typically softens prices + rents 12–24 months out; constrained supply supports both.
Investment metrics
- 1% rule
- 0.72% ✗
- Cap rate
- 4.75%
- Cash-on-cash
- -5.51%
- DSCR
- 0.75
- GRM
- 11.6
CMA / ARV
- ARV (median comp)
- $377,476
- List price
- $299,900
- Delta
- -20.55%
- Verdict
- UNDERPRICED
- Comps
- 19 within 1.0 mi
Show comp detail 2 sales within ~0.75 mi
| Address | Dist | Beds/Ba | Sqft | Sold | Price | $/sf | Match |
|---|---|---|---|---|---|---|---|
| 19079 Willard Ave | 0.64mi | 3/2.0 | 1,437 (-8%) | 13mo | $315,000 | $219 | 47 |
| 18375 Gypsy Ave | 0.56mi | 3/2.0 | 1,456 (-6%) | 20mo | $300,500 | $206 | 47 |
Match score weights: distance 35% · size 25% · config 20% · recency 20%. Top-matched comps best support the ARV.
Projected returns pro-forma
-3.0% appreciation · 0.0% rent growth · sell at horizon
- IRR
- -29.1%
- Equity multiple
- 0.05×
- Total profit
- $-79,417
- Equity at exit
- $44,716
- IRR
- -47.4%
- Equity multiple
- -0.49×
- Total profit
- $-124,946
- Equity at exit
- $25,930
Cash invested: $83,972 (down + closing). Projections, not guarantees.
Landlord ↔ Tenant lean methodology
- Overall (STATE)
- 87 Strongly Landlord-Friendly
- State Florida
- 87 Strongly Landlord-Friendly · R+3
- County
- — inherits STATE
- City
- — inherits STATE
ZIP-level market 34288
- Home prices YoY
- -12.2%
- Rents YoY
- -5.4%
- Active inventory
- 1401
- Price-to-rent
- 11.6×
Monthly cashflow live
- Estimated rent
- $2,146 high interval (Pro) →
- Mortgage (P&I)
- −$1,573
- Tax from tax record
- −$384 /mo · $4,604/yr
- Insurance
- −$125
- HOA
- −$0
- Vacancy / Maint / Mgmt
- −$451
- Net cashflow
- $-386
Break-even live
Sensitivity live
| Price | -10% $-216 | -5% $-301 | +0% $-386 | +5% $-471 | +10% $-556 |
|---|---|---|---|---|---|
| Rent | -10% $-555 | -5% $-471 | +0% $-386 | +5% $-301 | +10% $-216 |
| Rate | -1.0pp $-235 | -0.5pp $-309 | base $-386 | +0.5pp $-463 | +1.0pp $-543 |
UW: 25.0% down · 7.5% · 30yr · 1.5% tax · 5.0% vac · 8.0% maint · 8.0% mgmt
Financing live
Cash to close
- Down payment
- $74,975
- Closing costs
- $8,997
- Reserves months
- —
- Total cash needed
- —
Loan-product check · same deal, 3 products live
Conventional
25% down · 7.5% · 30yr
- Down + closing
- —
- Monthly P&I
- —
- Monthly cashflow
- —
- DSCR
- —
- Eligible?
- —
Personal DTI + credit; lowest rate.
DSCR
20% down · 8.5% · 30yr
- Down + closing
- —
- Monthly P&I
- —
- Monthly cashflow
- —
- DSCR
- —
- Eligible?
- —
No personal income docs; deal must DSCR.
Hard money
10% down · 12.0% · 12mo
- Down + closing
- —
- Monthly P&I
- —
- Monthly cashflow
- —
- DSCR
- —
- Eligible?
- —
Short-term bridge; refi at stabilization.
Rent comps 9 comps
| Address | Beds | Baths | Sqft | Rent | $/sqft | DOM | Units | Dist |
|---|---|---|---|---|---|---|---|---|
| 18412 Moonshadow Ave Port Charlotte, FL | 4.0 | 2.0 | 1833 | $1,895 | $1.03 | 23d | 1 | 0.80mi |
| 18404 Moonshadow Ave Port Charlotte, FL | 4.0 | 2.0 | 1833 | $1,995 | $1.09 | 23d | 1 | 0.81mi |
| 375 Denver Dr Port Charlotte, FL | 3.0 | 2.0 | 1534 | $2,199 | $1.43 | 23d | 1 | 0.91mi |
| 225 Overbrook St Unit NA Port Charlotte, FL | 3.0 | 2.0 | 1698 | $2,400 | $1.41 | 15d | 1 | 0.99mi |
| 18400 Tulane Ave Port Charlotte, FL | 4.0 | 2.0 | 1636 | $2,600 | $1.59 | 15d | 1 | 1.06mi |
| 678 Rutland Cir Port Charlotte, FL | 4.0 | 2.0 | 1833 | $1,925 | $1.05 | 15d | 1 | 1.11mi |
| 20217 Renwick Ave Port Charlotte, FL | 4.0 | 2.0 | 1556 | $2,050 | $1.32 | 23d | 1 | 1.28mi |
| 18118 Sullivan Ave Port Charlotte, FL | 4.0 | 2.0 | 1481 | $1,860 | $1.26 | 23d | 1 | 1.31mi |
| 19335 Water Oak Dr #108 Port Charlotte, FL | 3.0 | 2.0 | 1207 | $1,950 | $1.62 | 23d | 1 | 1.41mi |
Listing history 12 events
-
2026-05-16status Pending 1320-char remark
-
2026-05-11$299,900 Active 1320-char remark
-
2026-04-22historical $2,050
-
2026-03-13$2,050
-
2026-03-13historical $2,100
-
2026-02-28$2,100
-
2026-02-28historical $2,100
-
2026-02-10$2,100
-
2023-09-12soldstatus $325,000
-
2021-03-01soldstatus $85,400
-
2019-10-15soldstatus $12,500
-
2012-06-11soldstatus $16,100
ⓘ Source: listings_history table (triggers on properties + properties_extension) + one-shot
backfill from property_details.listing_events for pre-trigger history.
Tax reassessment forecast FL · Resets to sale price
- Current annual tax
- $4,604 · $384/mo
- Projected year-2 tax
- $4,604 · $384/mo
- Expected delta
- $0/yr ($0/mo · 0.0%)
ⓘ Screening estimate from a state-policy table — verify with the county assessor before closing.
Climate risk First Street
- Flood 2/10 Low FEMA zone X (unshaded) · 5% chance over 30 yrs
- Wildfire 1/10 Low
- Heat 10/10 Extreme 7 d/yr ≥108°F today · 28 d/yr by 30 yrs out
- Wind 10/10 Extreme 99% chance of damaging wind over 30 yrs
- Air quality 3/10 Moderate 2 unhealthy d/yr today · 2 by 30 yrs out
Nearby sold comps map
Loading sold comps map…
Walkable amenities ~0.75 mi
Loading nearby amenities…
Taxation est. · year 1
- Rental income
- $25,756
- − Mortgage interest
- −$16,799
- − Property taxes
- −$4,604
- − Insurance
- −$1,500
- − Repairs & maintenance
- −$2,060
- − Management
- −$2,060
- − Depreciation
- −$8,724
- Taxable loss
- −$9,992
- Est. tax savings @ 24.0%
- +$2,398
- After-tax cash flow
- $-2,231/yr
For passive investors: Depreciation is non-cash, so a rental often shows a tax loss while cash-flowing — sheltering income. Rental losses are passive: they offset passive income freely, and up to $25,000/yr can offset ordinary (W-2) income if you actively participate and your MAGI is under $100k (phasing out to $0 by $150k); unused losses carry forward. On sale, claimed depreciation is recaptured at up to 25%, and gains may owe capital-gains tax (a 1031 exchange can defer both). Figures are a year-1 estimate at your 24.0% rate — not tax advice; consult a CPA.
Schools (NCES district)
- District
- Sarasota
- NCES district ID
- 1201680
- Math proficiency
- 63% ▼ -8.00%
- Reading proficiency
- 63% ▼ -3.00%
- Median HH income
- $51,167
- Composite
- 53.68/100
- National rank
- #1428
- State rank
- #7 of 73 in FL
Livability — North Port
- Score
- 75/100
- State rank
- #252
- US rank
- #3975
Category grades
Schools grade is shown separately in the Schools card above.
Census & demographics
- Census place
- North Port, FL
- County
- Sarasota County · 448,376 people
- City population
- 75,324
- Metro
- North Port-Sarasota-Bradenton, FL
- Population (ZIP)
- 18,231
- Household income
- $84,211
- Rent vs Own
- Severe rent burden
- 177.0
Population outlook (Sarasota County) Hauer SSP2
- Today (2025)
- 452,380 people
- By 2030
- 474,175 · +4.8%
- By 2040
- 511,577 · +13.1%
- By 2050
- 541,467 · +19.7%
- By 2075
- 604,947 · +33.7%
- By 2100
- 621,965 · +37.5%
Race, ethnicity, and origin ACS 2023
- Neighborhood character
- Predominantly White (73%)
- Race & ethnicity
- White 73% Hispanic / Latino 11% Two or more races 9% Black 8% Asian 2%
- Hispanic origin (detail)
- Mexican 2% Puerto Rican 6% Cuban 3%
- Common ancestry
- Romanian 7% Lithuanian 4% Hispanic 3%
- Foreign-born
- 12% · Canada, South Korea
- Languages at home
- 85% English-only · Spanish 6% French/Haitian/Cajun 5% Russian/Polish/Slavic 1%
Political lean MEDSL · Sarasota
- 2024 margin
- R (+18.2) · D 40.5% · R 58.7%
- 2008→2024 swing
- -18.1pp toward R · 2008: -0.1pp · 2024: -18.2pp
- All cycles
- 2024: R+18.2 2020: R+10.4 2016: R+11.6 2012: R+7.4 2008: R+0.1
Not yet ingested
- Civics
- —
Market trends
- HPI YoY
- ▼ -34.39%
- Current HPI
- 248.3322
- Rent YoY
- ▼ -5.40%
- Metro
- North Port-Sarasota-Bradenton, FL
- State GDP YoY
- ▲ 3.28%
- F500 in state
- 36
Industry mix (Fortune 500 HQ in FL)
| Industry | F500 HQs | Revenue |
|---|---|---|
| Industrial Technology | 2 | $29B |
|
||
| Insurance | 2 | $17B |
|
||
| Retail | 1 | $60B |
|
||
| Technology Distribution | 1 | $58B |
|
||
| Homebuilding | 1 | $35B |
|
||
| Technology Manufacturing | 1 | $35B |
|
||
Price history
+1762.7% since first listed12 events — show timeline
- 2026-05-16 Pending — Stellar MLS as Distributed by MLS Grid
- 2026-05-11 Listed $299,900 Stellar MLS as Distributed by MLS Grid
- 2026-04-22 Rental Removed $2,050 NAPLESMLS
- 2026-03-13 Listed for Rent $2,050 NAPLESMLS
- 2026-03-13 Rental Removed $2,100 FGCMLS
- 2026-02-28 Listed for Rent $2,100 FGCMLS
- 2026-02-28 Rental Removed $2,100 NAPLESMLS
- 2026-02-10 Listed for Rent $2,100 NAPLESMLS
- 2023-09-12 Sold (Public Records) $325,000 Public Records
- 2021-03-01 Sold (Public Records) $85,400 Public Records
- 2019-10-15 Sold (Public Records) $12,500 Public Records
- 2012-06-11 Sold (Public Records) $16,100 Public Records
Property tax history
+24.9%/yrLatest (2025): $4,604 · -6.4% YoY. Source: county tax records.
Cash-flow waterfall
monthlySold comps — $/sqft
last 12 mo · ≤1 miLoading sold comps…