10105 Vaughan Ave · Flagler Estates, FL
Flood risk 1/10 · Minimal
- FEMA flood zone
- X (unshaded)
- Chance of flooding over 30 yrs
- 0.0%
- Est. flood insurance / yr
- $507 – $1,088
Fire risk 7/10 · Major
- Est. fire insurance / yr
- $947 – $1,759
Heat risk 9/10 · Severe
- Hot days now (above 107°F)
- 7 days/yr
- Hot days in 30 yrs
- 20 days/yr
Wind risk 9/10 · Severe
- Chance of severe wind over 30 yrs
- 99.0%
Air-quality risk 2/10 · Minimal
- Unhealthy air days now
- 2 days/yr
- Unhealthy air days in 30 yrs
- 2 days/yr
Risk factors via First Street. Map © Google.
Why this score? — see what drove the A grade
The composite is a weighted blend of 9 inputs, each scored 0–100. Each bar is that input's sub-score; the figure is the points it added to the 100-point composite (weight × sub-score).
- Cash flow +30.0/30.0
- ARV discount +15.0/15.0
- 1% rule +10.0/10.0
- DSCR +10.0/10.0
- Appreciation +10.0/10.0
- Schools +6.4/10.0
- Livability +3.1/5.0
- Rent growth +2.5/5.0
- Condition / age +2.5/5.0
$115,000
🖨 Deal sheet 📄 Offer letter ✓ Due diligence
Listing remarks
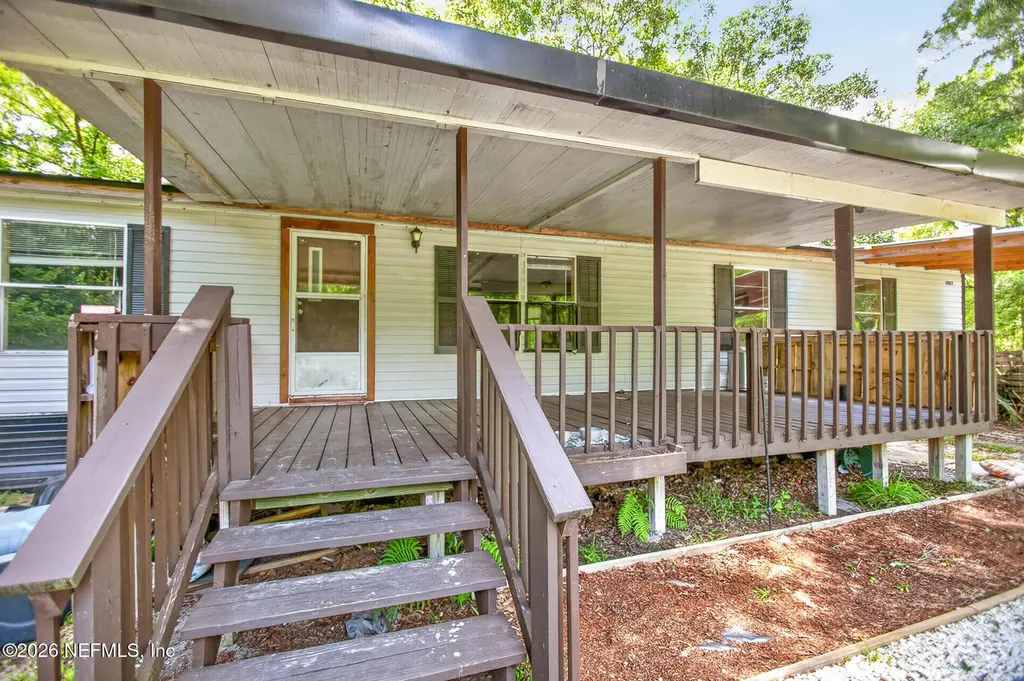
Incredible opportunity to own a 3-bedroom, 2-bathroom double-wide situated on over an acre of land and priced to sell! Whether you're a homeowner looking to build instant equity or an investor searching for your next rental or renovation project, this property offers exceptional potential. Located in a rapidly growing area with continued development and demand, the possibilities are endless. Enjoy the space, privacy, and upside that come with acreage while taking advantage of a value-packed purchase price. Opportunities like this don't come around often--schedule your showing today before it's gone!
Key facts
- 1.14 acre lot
- Built 1996
- Listed 6 days
Property features AI
Finance
- Financial info: Property tax information available
- HOA & community: Not a senior community
Exterior
- Parking: Additional parking
- Utilities: Septic tank; Electricity available; Sewer available; Water available
- Home design: Double wide mobile home; One level; Facing east; Residential use
- Construction: Aluminum siding; Metal roof
- Exterior features: Deck; Back yard fence; Many trees; Wooded lot
Interior
- Kitchen: No appliances included
- Bedrooms: 3 bedrooms
- Flooring: Laminate
- Bathrooms: 2 full bathrooms
- Heating & cooling: Central heating; Central air conditioning
- Interior features: Open floor plan
- Laundry & utility: Washer hookup; Electric dryer hookup
Neighborhood map
What this means for you Summary
Snapshot
- This is a 3-bed/2.0-bath manufactured listed at $115k.
Deal economics
- At list price, monthly cash flow is $624 ($7k/yr) — positive.
- The deal already cash-flows at list — no discount required.
- Meets the 1% rule at list price ($2k rent vs $115k).
- Cap rate 12.8% vs local median 4.0% in Flagler Estates — top-decile yield for the area; either an underpriced asset or a hidden risk that comps aren't pricing in. Stress-test before assuming the spread holds.
Location & tenants
- Location reads 62/100 on livability (#763 in FL) — a middle-class / working-renter tenant base. Strengths: cost of living A+, housing A+, crime A-; Watch: health & safety C-, amenities F, commute F.
- St. Johns (rural): math 75% / reading 73% proficiency, ranked #2 of 73 in FL (top 3%) — strong family-tenant draw, lease renewals of 3-5y typical; only 20% free/reduced lunch — higher-income household profile.
- Zoned schools: South Woods Elementary School (math 51% / reading 46%, grade D, #1,152 of 2,144 statewide, top 55%, 689 students, 66% FRL); Gamble Rogers Middle School (math 61% / reading 55%, grade B, #151 of 571 statewide, top 27%, 925 students, 47% FRL); Pedro Menendez High School (math 31% / reading 54%, grade F, #264 of 667 statewide, top 41%, 1,519 students, 39% FRL) — zoned schools average 51% FRL vs 20% district-wide (31 pts higher); higher-poverty schools than district average — tighter screening recommended.
- Zoned-school proficiency averages 50% at this address vs 74% district-wide (-24 pts) — the specific schools serving this property underperform the St. Johns average; the district grade overstates school quality for this exact location.
- Market conditions: 234 active listings in the ZIP; 5,575 units permitted in St. Johns County in 2024 (584 in 5+ unit buildings).
Forward outlook
- In year one you build about $12k of equity ($795 loan paydown + $12k appreciation (10.0% local appreciation)).
- St. Johns County population projected at +60% by 2050 — long-run rental-demand tailwind backs the buy-and-hold thesis.
- At projected returns (10.0% appreciation + 3.0% rent growth), your $32k cash investment doubles in ~2 years — after that, you're playing with house money.
- By year 3, paydown + projected appreciation supports a ~$31k cash-out refi (75% LTV) — recoverable capital for the next deal without selling this one.
Negotiation context
- Only 7 days on market — expect competitive offers; lowballing is unlikely to land.
- 2 sale attempts since 17y ago with the ask held roughly flat each time — persistent listings suggest the price (not the market) is what's stuck; bring a comps-based counter.
- Current owner paid $50k; list at $115k implies a 130% gain — meaningful room to come down on a strong offer.
Risks & watch-outs
- Climate carrying-cost: severe wind risk, 99% chance of damaging wind over 30y; major wildfire risk; extreme-heat days projected 7→20/yr by 2055 (HVAC capex compounding) — expect insurance premiums to compound above CPI over the hold.
Questions for the listing agent
- Is there a deadline driving the sale (1031 exchange, divorce, estate, relocation)? That informs how much negotiation room exists.
- Schools are F-rated, which usually means shorter tenancies and higher turnover. Who's the typical renter profile here, and what's been the actual vacancy rate?
- What's the average days-on-market for RENTAL listings here right now (not sales)? A rising rental-DOM trend means longer vacancies and softer asking-rent achievability than the comps imply.
- What's the recent tenant-quality profile in this submarket — average credit score on applications, eviction rate, late-payment / NSF rate, and stable-employment percentage? A property-management company in the area should have these aggregated.
- How much new for-sale + rental construction is in the pipeline within 1–3 miles? Heavy new supply typically softens prices + rents 12–24 months out; constrained supply supports both.
Investment metrics
- 1% rule
- 1.51% ✓
- Cap rate
- 12.80%
- Cash-on-cash
- 23.24%
- DSCR
- 2.03
- GRM
- 5.5
CMA / ARV
- ARV (on-the-fly)
- $213,192
- Comps found
- 3
Show comp detail 3 sales within ~0.75 mi
| Address | Dist | Beds/Ba | Sqft | Sold | Price | $/sf | Match |
|---|---|---|---|---|---|---|---|
| 10020 Vaughan Ave | 0.17mi | 3/2.0 | 1,600 (+6%) | 2mo | $249,900 | $156 | 81 |
| 4865 Olaf St | 0.44mi | 3/2.0 | 1,458 (-4%) | 12mo | $190,000 | $130 | 64 |
| 4810 Kenneth St | 0.61mi | 3/2.0 | 1,560 (+3%) | 23mo | $220,000 | $141 | 47 |
Match score weights: distance 35% · size 25% · config 20% · recency 20%. Top-matched comps best support the ARV.
Projected returns pro-forma
10.0% appreciation · 3.0% rent growth · sell at horizon
- IRR
- 41.7%
- Equity multiple
- 4.18×
- Total profit
- $102,350
- Equity at exit
- $103,601
- IRR
- 36.0%
- Equity multiple
- 9.39×
- Total profit
- $270,161
- Equity at exit
- $223,420
Cash invested: $32,200 (down + closing). Projections, not guarantees.
Landlord ↔ Tenant lean methodology
- Overall (STATE)
- 87 Strongly Landlord-Friendly
- State Florida
- 87 Strongly Landlord-Friendly · R+3
- County
- — inherits STATE
- City
- — inherits STATE
ZIP-level market 32145
- Home prices YoY
- 19.1%
- Active inventory
- 234
- Price-to-rent
- 5.5×
Monthly cashflow live
- Estimated rent
- $1,734 medium interval (Pro) →
- Mortgage (P&I)
- −$603
- Tax from tax record
- −$95 /mo · $1,145/yr
- Insurance
- −$48
- HOA
- −$0
- Vacancy / Maint / Mgmt
- −$364
- Net cashflow
- $624
Break-even live
UW: 25.0% down · 7.5% · 30yr · 1.5% tax · 5.0% vac · 8.0% maint · 8.0% mgmt
Financing live
Cash to close
- Down payment
- $28,750
- Closing costs
- $3,450
- Reserves months
- —
- Total cash needed
- —
Loan-product check · same deal, 3 products live
Conventional
25% down · 7.5% · 30yr
- Down + closing
- —
- Monthly P&I
- —
- Monthly cashflow
- —
- DSCR
- —
- Eligible?
- —
Personal DTI + credit; lowest rate.
DSCR
20% down · 8.5% · 30yr
- Down + closing
- —
- Monthly P&I
- —
- Monthly cashflow
- —
- DSCR
- —
- Eligible?
- —
No personal income docs; deal must DSCR.
Hard money
10% down · 12.0% · 12mo
- Down + closing
- —
- Monthly P&I
- —
- Monthly cashflow
- —
- DSCR
- —
- Eligible?
- —
Short-term bridge; refi at stabilization.
Listing history 9 events
-
2026-06-03days on market $115,000 Active 7 DOM
-
2026-06-02days on market $115,000 Active 6 DOM
-
2026-06-01days on market $115,000 Active 5 DOM
-
2026-05-31days on market $115,000 Active 4 DOM
-
2026-05-27$115,000 Active
-
2011-02-14soldstatus $50,000
-
2010-08-03historical
-
2009-10-24$24,900
-
1978-01-01soldstatus $5,000
ⓘ Source: listings_history table (triggers on properties + properties_extension) + one-shot
backfill from property_details.listing_events for pre-trigger history.
Tax reassessment forecast FL · Resets to sale price
- Current annual tax
- $1,145 · $95/mo
- Projected year-2 tax
- $1,145 · $95/mo
- Expected delta
- $0/yr ($0/mo · 0.0%)
ⓘ Screening estimate from a state-policy table — verify with the county assessor before closing.
Climate risk First Street
- Flood 1/10 Low FEMA zone X (unshaded) · 0% chance over 30 yrs
- Wildfire 7/10 Severe
- Heat 9/10 Extreme 7 d/yr ≥107°F today · 20 d/yr by 30 yrs out
- Wind 9/10 Extreme 99% chance of damaging wind over 30 yrs
- Air quality 2/10 Low 2 unhealthy d/yr today · 2 by 30 yrs out
Nearby sold comps map
Loading sold comps map…
Walkable amenities ~0.75 mi
Loading nearby amenities…
Taxation est. · year 1
- Rental income
- $20,811
- − Mortgage interest
- −$6,442
- − Property taxes
- −$1,145
- − Insurance
- −$575
- − Repairs & maintenance
- −$1,665
- − Management
- −$1,665
- − Depreciation
- −$3,345
- Taxable income
- $5,974
- Est. tax owed @ 24.0%
- −$1,434
- After-tax cash flow
- $6,050/yr
For passive investors: Depreciation is non-cash, so a rental often shows a tax loss while cash-flowing — sheltering income. Rental losses are passive: they offset passive income freely, and up to $25,000/yr can offset ordinary (W-2) income if you actively participate and your MAGI is under $100k (phasing out to $0 by $150k); unused losses carry forward. On sale, claimed depreciation is recaptured at up to 25%, and gains may owe capital-gains tax (a 1031 exchange can defer both). Figures are a year-1 estimate at your 24.0% rate — not tax advice; consult a CPA.
Schools (NCES district)
- District
- St. Johns
- NCES district ID
- 1201740
- Math proficiency
- 75% ▼ -5.00%
- Reading proficiency
- 73% ▼ -2.00%
- Median HH income
- $66,842
- Composite
- 64.31/100
- National rank
- #556
- State rank
- #2 of 73 in FL
Livability — Flagler Estates
- Score
- 62/100
- State rank
- #763
- US rank
- #16863
Category grades
Schools grade is shown separately in the Schools card above.
Census & demographics
- Census place
- Flagler Estates, FL
- Population (ZIP)
- 5,750
Population outlook (St. Johns County) Hauer SSP2
- Today (2025)
- 303,941 people
- By 2030
- 342,590 · +12.7%
- By 2040
- 417,328 · +37.3%
- By 2050
- 487,011 · +60.2%
- By 2075
- 635,395 · +109.1%
- By 2100
- 717,469 · +136.1%
Race, ethnicity, and origin ACS 2023
- Neighborhood character
- Predominantly White (76%)
- Race & ethnicity
- White 76% Two or more races 16% Hispanic / Latino 9% Black 7%
- Hispanic origin (detail)
- Mexican 8%
- Common ancestry
- Lithuanian 3% Romanian 3% Estonian 3%
- Foreign-born
- 12% · Canada
- Languages at home
- 86% English-only · Spanish 9% Other Indo-European 5%
Political lean MEDSL · St. Johns
- 2024 margin
- Solid R (+31.4) · D 33.9% · R 65.2%
- 2008→2024 swing
- +0.2pp no change · 2008: -31.6pp · 2024: -31.4pp
- All cycles
- 2024: R+31.4 2020: R+26.7 2016: R+33.4 2012: R+37.8 2008: R+31.6
Not yet ingested
- Civics
- —
Market trends
- HPI YoY
- ▲ 40.24%
- Current HPI
- 250.8035
- Rent YoY
- —
- Metro
- —
- State GDP YoY
- ▲ 3.28%
- F500 in state
- 36
Industry mix (Fortune 500 HQ in FL)
| Industry | F500 HQs | Revenue |
|---|---|---|
| Industrial Technology | 2 | $29B |
|
||
| Insurance | 2 | $17B |
|
||
| Retail | 1 | $60B |
|
||
| Technology Distribution | 1 | $58B |
|
||
| Homebuilding | 1 | $35B |
|
||
| Technology Manufacturing | 1 | $35B |
|
||
Price history
+2200.0% since first listed5 events — show timeline
- 2026-05-27 Listed $115,000 realMLS
- 2011-02-14 Sold (Public Records) $50,000 Public Records
- 2010-08-03 Listing Removed — realMLS
- 2009-10-24 Listed $24,900 realMLS
- 1978-01-01 Sold (Public Records) $5,000 Public Records
Property tax history
+9.4%/yrLatest (2025): $1,145 · +15.0% YoY. Source: county tax records.
Cash-flow waterfall
monthlySold comps — $/sqft
last 12 mo · ≤1 miLoading sold comps…