 🏢 Co-op
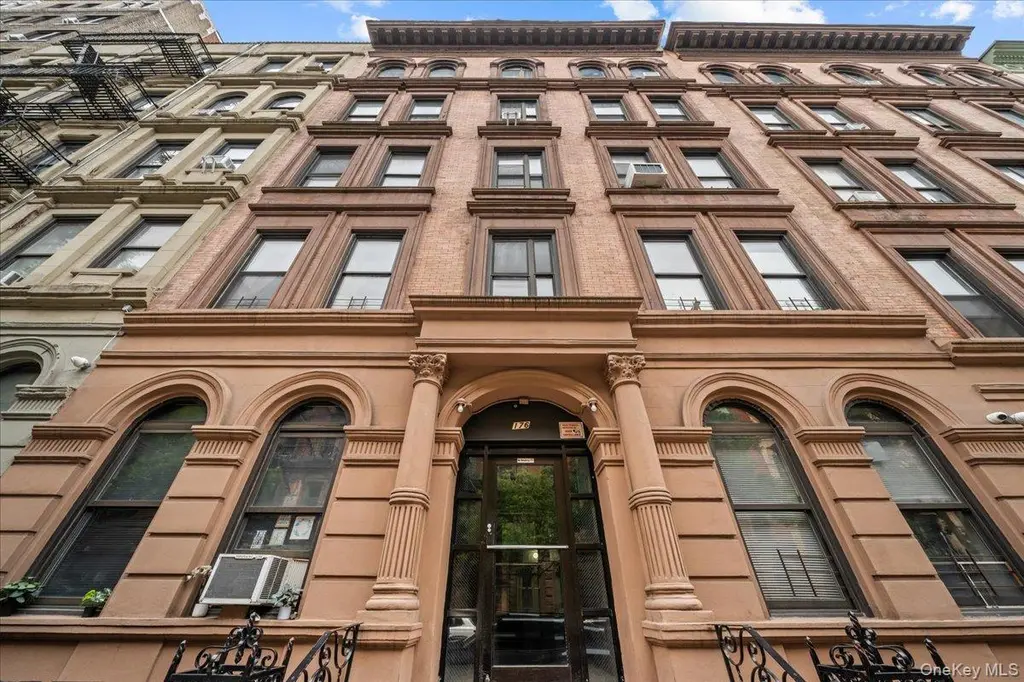
176 W 81 St Unit 3E · New York, NY
Flood risk 1/10 · Minimal
- FEMA flood zone
- X (unshaded)
- Chance of flooding over 30 yrs
- 0.0%
- Est. flood insurance / yr
- $507 – $1,088
Fire risk 1/10 · Minimal
- Est. fire insurance / yr
- $691 – $1,283
Heat risk 6/10 · Moderate
- Hot days now (above 99°F)
- 7 days/yr
- Hot days in 30 yrs
- 15 days/yr
Wind risk 6/10 · Moderate
- Chance of severe wind over 30 yrs
- 27.0%
Air-quality risk 4/10 · Minor
- Unhealthy air days now
- 5 days/yr
- Unhealthy air days in 30 yrs
- 6 days/yr
Risk factors via First Street. Map © Google.
Why this score? — see what drove the A- grade
The composite is a weighted blend of 9 inputs, each scored 0–100. Each bar is that input's sub-score; the figure is the points it added to the 100-point composite (weight × sub-score).
- Cash flow +30.0/30.0
- DSCR +10.0/10.0
- 1% rule +9.3/10.0
- Appreciation +7.7/10.0
- ARV discount +7.5/15.0
- Schools +5.0/10.0
- Rent growth +4.5/5.0
- Livability +3.8/5.0
- Condition / age +2.5/5.0
$699,000
🖨 Deal sheet (PDF) 📄 Offer letter ✓ Due diligence
Listing remarks
CASH ONLY - BACK ON MARKET - Located at 176 W 81st Street, this 4bd/1bth apartment sits on the 3rd floor of a well-maintained walk-up HDFC Coop building. The unit was recently refreshed with new paint and basic updates, offering a comfortable and functional layout. Maintenance is just $525/month and includes heat, hot water and gas. .. an excellent value for the area. As an HDFC Coop, income restrictions apply based on 120% of the Area Median Income (AMI). Maximum allowable household income limits are: 1 person: $136,080, 2 people: $155,520, 3 people: $174,960, 4 people: $194,400, 5 people: $210,000, 6 people: $225,600. The unit must be used as a primary residence, subletting is not permitt
Key facts
- New paint
- Basic updates
- Built 1900
Tags
Property features AI
Finance
- HOA & community: Pets allowed: contact management
Exterior
- Parking: No carport; No designated parking
- Utilities: Electric service by Con Edison; Public sewer; Additional utilities: see remarks
- Home design: Stock cooperative; 5-story building; Located between 3rd and 5th floors; Directions: between Amsterdam Ave & Columbus Ave
- Construction: Brick construction; Other foundation
- Exterior features: Brick exterior; Not waterfront
Interior
- Kitchen: Gas range; Refrigerator
- Flooring: Hardwood; Laminate
- Bathrooms: 1 full bathroom
- Heating & cooling: Radiant heat; Steam heat; Wall/window air conditioning units
- Interior features: High ceilings; Walk-up building
Neighborhood map
What this means for you Summary
Snapshot
- This is a 4-bed/1.0-bath condo listed at $699k.
Deal economics
- At list price, monthly cash flow is $3k ($37k/yr) — positive.
- The deal already cash-flows at list — no discount required.
- Meets the 1% rule at list price ($10k rent vs $699k).
- Recommended offer: $615k (12.0% below list) — sets the bar for market timing.
- Cap rate 11.5% vs local median 2.6% in New York — top-decile yield for the area; either an underpriced asset or a hidden risk that comps aren't pricing in. Stress-test before assuming the spread holds.
Location & tenants
- Location reads 75/100 on livability (#268 in NY, #4,188 nationally) — a middle-class / working-renter tenant base. Strengths: amenities A+, commute A+, health & safety A; Watch: crime F, cost of living F.
- Market conditions: Rents rising fast (+8.2%/yr); 327 active listings in the ZIP; 25 comparable units currently listed for rent nearby; rentals leasing fast (median 9d on market — plan ~1-2 weeks tenant-placement turnaround); high-income renter base; 4,467 units permitted in New York County in 2024 (4,463 in 5+ unit buildings).
- At $9,986/mo this rent would consume 66% of the median local household income ($182k/yr) (locally 3388% of renters already pay >50% of income on rent) — very limited rent-growth headroom before tenants either downsize or default.
Forward outlook
- In year one you build about $42k of equity ($5k loan paydown + $37k appreciation (5.3% local appreciation)).
- New York County population projected at +21% by 2050 — long-run rental-demand tailwind backs the buy-and-hold thesis.
- At projected returns (5.3% appreciation + 8.0% rent growth), your $196k cash investment doubles in ~3 years — after that, you're playing with house money.
- By year 2, paydown + projected appreciation supports a ~$67k cash-out refi (75% LTV) — recoverable capital for the next deal without selling this one.
Negotiation context
- It's been on market 175 days — a 12% lower offer ($615k) is reasonable based on typical stale-listing flexibility.
- 4 sale attempts with the ask held roughly flat each time — persistent listings suggest the price (not the market) is what's stuck; bring a comps-based counter.
Risks & watch-outs
- Watch-outs: built in 1900 — expect roof / HVAC / electrical / plumbing capex.
- Climate carrying-cost: major wind risk, 27% chance of damaging wind over 30y; extreme-heat days projected 7→15/yr by 2055 (HVAC capex compounding) — expect insurance premiums to compound above CPI over the hold.
Questions for the listing agent
- It's been on market 175 days. Have you received any prior offers? Is the seller open to a 12% concession, seller financing, or rate buy-down credit?
- Built in 1900 — when were the roof, HVAC, electrical panel, plumbing, and water heater last replaced?
- Any open or pending special assessments — roof, HVAC, plumbing, elevator, façade? What's the per-unit balance and payoff schedule, and is the seller paying it off at close or rolling it to the buyer?
- Why hasn't it sold? Are there any deal-killer items the seller is aware of (foundation, flood, title, zoning, code violations)?
- Is there a deadline driving the sale (1031 exchange, divorce, estate, relocation)? That informs how much negotiation room exists.
- Schools are B-rated — typically a magnet for longer-tenancy family renters. What's the average tenant stay here, and is there a school-zone premium baked into asking?
- Crime grade is F in this area — have there been break-ins, vandalism, or insurance claims at this property in the last 3 years? What carrier currently insures it and at what premium?
- What's the average days-on-market for RENTAL listings here right now (not sales)? A rising rental-DOM trend means longer vacancies and softer asking-rent achievability than the comps imply.
- What's the recent tenant-quality profile in this submarket — average credit score on applications, eviction rate, late-payment / NSF rate, and stable-employment percentage? A property-management company in the area should have these aggregated.
- How much new apartment / multifamily construction is in the pipeline within 1–3 miles? Heavy new supply (>2% of stock underway) typically softens rents 12–24 months out; light construction supports rent growth.
Investment metrics
- 1% rule
- 1.43% ✓
- Cap rate
- 11.54%
- Cash-on-cash
- 18.75%
- DSCR
- 1.83
- GRM
- 5.8
CMA / ARV
No comps found within radius.
Projected returns pro-forma
5.32% appreciation · 8.0% rent growth · sell at horizon
- IRR
- 33.0%
- Equity multiple
- 3.15×
- Total profit
- $421,509
- Equity at exit
- $409,620
- IRR
- 33.6%
- Equity multiple
- 7.27×
- Total profit
- $1,227,141
- Equity at exit
- $718,376
Cash invested: $195,720 (down + closing). Projections, not guarantees.
Landlord ↔ Tenant lean methodology
- Overall (CITY)
- 0 Strongly Tenant-Friendly
- State New York
- 15 Strongly Tenant-Friendly · D+10
- County
- — inherits STATE
- City New York
- 0 Strongly Tenant-Friendly · D+34
ZIP-level market 10024
- Home prices YoY
- 2.2%
- Rents YoY
- 8.2%
- Active inventory
- 327
- Price-to-rent
- 5.8×
Monthly cashflow live
- Estimated rent
- $9,986 high interval (Pro) →
- Mortgage (P&I)
- −$3,666
- Tax est. 1.5%
- −$874 /mo · $10,485/yr
- Insurance
- −$291
- HOA
- −$0
- Vacancy / Maint / Mgmt
- −$2,097
- Net cashflow
- $3,058
Break-even live
Sensitivity live
| Price | -10% $3,541 | -5% $3,300 | +0% $3,058 | +5% $2,817 | +10% $2,575 |
|---|---|---|---|---|---|
| Rent | -10% $2,269 | -5% $2,664 | +0% $3,058 | +5% $3,453 | +10% $3,847 |
| Rate | -1.0pp $3,410 | -0.5pp $3,236 | base $3,058 | +0.5pp $2,877 | +1.0pp $2,693 |
UW: 25.0% down · 7.5% · 30yr · 1.5% tax · 5.0% vac · 8.0% maint · 8.0% mgmt
Financing live
Cash to close
- Down payment
- $174,750
- Closing costs
- $20,970
- Reserves months
- —
- Total cash needed
- —
Loan-product check · same deal, 3 products live
Conventional
25% down · 7.5% · 30yr
- Down + closing
- —
- Monthly P&I
- —
- Monthly cashflow
- —
- DSCR
- —
- Eligible?
- —
Personal DTI + credit; lowest rate.
DSCR
20% down · 8.5% · 30yr
- Down + closing
- —
- Monthly P&I
- —
- Monthly cashflow
- —
- DSCR
- —
- Eligible?
- —
No personal income docs; deal must DSCR.
Hard money
10% down · 12.0% · 12mo
- Down + closing
- —
- Monthly P&I
- —
- Monthly cashflow
- —
- DSCR
- —
- Eligible?
- —
Short-term bridge; refi at stabilization.
Rent comps 25 comps
| Address | Beds | Baths | Sqft | Rent | $/sqft | DOM | Units | Dist |
|---|---|---|---|---|---|---|---|---|
| 155 W 70th St New York, NY | 2.0–3.0 | 2.0–2.5 | 1112 | $14,995 | $13.48 | 23d | 4 | 0.53mi |
| 155 W 70th St New York, NY | 2.0–3.0 | 2.0–2.5 | 1300 | $13,750 | $10.58 | 22d | 3 | 0.53mi |
| 70 W 95th St New York, NY | 1.0–4.0 | 1.0–2.0 | 1095 | $19,500 | $17.80 | 18d | 1 | 0.73mi |
| 788 Columbus Ave #1323 New York, NY | 1.0–3.0 | 1.0–1.5 | 900 | $8,980 | $9.98 | 25d | 2 | 0.90mi |
| 7 E 75th St #1615 New York, NY | 1.0–3.0 | 1.0–2.0 | 656 | $11,330 | $17.26 | 0d | 3 | 0.93mi |
| 7 E 75th St New York, NY | 1.0–3.0 | 1.0–2.0 | 790 | $11,100 | $14.05 | 25d | 2 | 0.93mi |
| 400 W 61st St New York, NY | 4.0 | 1.0–4.0 | 1567 | $43,500 | $27.76 | 0d | 51 | 1.04mi |
| 21 W End Ave New York, NY | 2.0–3.0 | 2.0 | 750 | $11,500 | $15.33 | 25d | 2 | 1.05mi |
| 5 W 103rd St Apt 4W New York, NY | 4.0 | 2.0 | 1200 | $7,495 | $6.25 | 20d | 1 | 1.17mi |
| 53-55 E 95th St Unit 4A New York, NY | 3.0 | 2.0 | 803 | $7,495 | $9.33 | 9d | 1 | 1.22mi |
| 160 Central Park S New York, NY | 1.0–3.0 | 1.0–3.5 | 1550 | $50,000 | $32.26 | 9d | 10 | 1.23mi |
| 160 Central Park S New York, NY | 1.0–3.0 | 1.0–3.5 | 1550 | $50,000 | $32.26 | 8d | 9 | 1.23mi |
| 160 Central Park S New York, NY | 1.0–3.0 | 1.5–3.5 | 1578 | $50,000 | $31.68 | 3d | 9 | 1.23mi |
| 915 W End Ave #1020 New York, NY | 1.0–3.0 | 1.0–2.0 | 851 | $8,540 | $10.04 | 0d | 2 | 1.23mi |
| 7912 River Rd North Bergen, NJ | 1.0–3.0 | 1.0–2.0 | 1136 | $5,595 | $4.93 | 0d | 13 | 1.30mi |
| 4 Ave at Port Imperial West New York, NJ | 1.0–3.0 | 1.0–2.0 | 1110 | $5,551 | $5.00 | 0d | 16 | 1.33mi |
| 7601 River Rd North Bergen, NJ | 3.0 | 1.0–3.0 | 1150 | $6,580 | $5.72 | 0d | 16 | 1.34mi |
| 550 W 54th St Unit 1243 New York, NY | 1.0–3.0 | 1.0–2.0 | 913 | $8,170 | $8.94 | 9d | 3 | 1.36mi |
| 1435 2nd Ave Unit 1021957P New York, NY | 3.0 | 2.0 | 1194 | $7,740 | $6.48 | 14d | 1 | 1.38mi |
| 4 W 108th St Unit 28 New York, NY | 4.0 | 1.0 | 750 | $5,550 | $7.40 | 21d | 1 | 1.40mi |
| 11 Ave At Port Imperial West New York, NJ | 3.0 | 1.0–2.0 | 1047 | $6,634 | $6.33 | 0d | 11 | 1.41mi |
| 64 70th St #2 Guttenberg, NJ | 3.0 | 2.0 | 1450 | $2,900 | $2.00 | 0d | 1 | 1.43mi |
| 305 E 86th St New York, NY | 1.0–3.0 | 1.0–2.0 | 820 | $14,500 | $17.67 | 25d | 10 | 1.43mi |
| 8200 Boulevard East North Bergen, NJ | 3.0 | 1.0–3.5 | 1486 | $5,000 | $3.36 | 4d | 4 | 1.47mi |
| 15 W 55th St #736 New York, NY | 2.0–3.0 | 1.0–2.0 | 1250 | $8,630 | $6.90 | 0d | 2 | 1.50mi |
HOA detail condo
- Monthly dues
- $0 · $0/yr
- Likely covers
- watergas
- Assessments
- None detected in remarks — confirm with the listing agent.
Listing history 10 events
-
2026-06-04status $699,000 Pending 175 DOM
-
2026-06-03days on market $699,000 Active 175 DOM
-
2026-06-01days on market $699,000 Active 173 DOM
-
2026-05-31days on market $699,000 Active 172 DOM
-
2026-02-24status Active
-
2025-12-16status Pending
-
2025-10-30status Active
-
2025-10-03status Active
-
2025-07-16status Pending
-
2025-06-13$699,000 Active
ⓘ Source: listings_history table (triggers on properties + properties_extension) + one-shot
backfill from property_details.listing_events for pre-trigger history.
Climate risk First Street
- Flood 1/10 Low FEMA zone X (unshaded) · 0% chance over 30 yrs
- Wildfire 1/10 Low
- Heat 6/10 Major 7 d/yr ≥99°F today · 15 d/yr by 30 yrs out
- Wind 6/10 Major 27% chance of damaging wind over 30 yrs
- Air quality 4/10 Moderate 5 unhealthy d/yr today · 6 by 30 yrs out
Nearby sold comps map
Loading sold comps map…
Walkable amenities ~0.75 mi
Loading nearby amenities…
Taxation est. · year 1
- Rental income
- $119,831
- − Mortgage interest
- −$39,155
- − Property taxes
- −$10,485
- − Insurance
- −$3,495
- − Repairs & maintenance
- −$9,586
- − Management
- −$9,586
- − Depreciation
- −$20,335
- Taxable income
- $27,188
- Est. tax owed @ 24.0%
- −$6,525
- After-tax cash flow
- $30,173/yr
For passive investors: Depreciation is non-cash, so a rental often shows a tax loss while cash-flowing — sheltering income. Rental losses are passive: they offset passive income freely, and up to $25,000/yr can offset ordinary (W-2) income if you actively participate and your MAGI is under $100k (phasing out to $0 by $150k); unused losses carry forward. On sale, claimed depreciation is recaptured at up to 25%, and gains may owe capital-gains tax (a 1031 exchange can defer both). Figures are a year-1 estimate at your 24.0% rate — not tax advice; consult a CPA.
Schools (NCES district)
No district data.
Livability — New York
- Score
- 75/100
- State rank
- #268
- US rank
- #4188
Category grades
Schools grade is shown separately in the Schools card above.
Census & demographics
- Census place
- New York, NY
- County
- New York County · 1,599,927 people
- City population
- 7,731,280
- Metro
- New York-Newark-Jersey City, NY-NJ-PA
- Population (ZIP)
- 63,115
- Household income
- $181,560
- Rent vs Own
- Severe rent burden
- 3388.0
Population outlook (New York County) Hauer SSP2
- Today (2025)
- 1,825,725 people
- By 2030
- 1,904,611 · +4.3%
- By 2040
- 2,052,719 · +12.4%
- By 2050
- 2,206,601 · +20.9%
- By 2075
- 2,509,427 · +37.4%
- By 2100
- 2,702,933 · +48.0%
Race, ethnicity, and origin ACS 2023
- Neighborhood character
- Predominantly White (79%)
- Race & ethnicity
- White 79% Hispanic / Latino 9% Two or more races 6% Asian 5% Black 3%
- Hispanic origin (detail)
- Mexican 2% Puerto Rican 3% Dominican 2%
- Common ancestry
- Scotch-Irish 8% Romanian 5% Italian 3%
- Foreign-born
- 19% · Canada, China, South Korea
- Languages at home
- 79% English-only · Spanish 8% Other Indo-European 3% Russian/Polish/Slavic 3%
Political lean MEDSL · New York
- 2024 margin
- Solid D (+64.8) · D 82.4% · R 17.6%
- 2008→2024 swing
- -7.4pp toward R · 2008: 72.2pp · 2024: 64.8pp
- All cycles
- 2024: D+64.8 2020: D+74.5 2016: D+77.2 2012: D+69.6 2008: D+72.2
Not yet ingested
- Civics
- —
Market trends
- HPI YoY
- ▲ 5.32%
- Current HPI
- 251.6447
- Rent YoY
- ▲ 8.15%
- Metro
- New York-Newark-Jersey City, NY-NJ-PA
- State GDP YoY
- ▲ 2.60%
- F500 in state
- 92
Industry mix (Fortune 500 HQ in NY)
| Industry | F500 HQs | Revenue |
|---|---|---|
| Financial Services | 10 | $950B |
|
||
| Consumer Goods | 9 | $162B |
|
||
| Insurance | 4 | $225B |
|
||
| Telecommunications | 2 | $144B |
|
||
| Pharmaceuticals | 2 | $112B |
|
||
| Media / Entertainment | 2 | $69B |
|
||
Price history
6 events — show timeline
- 2026-02-24 Relisted — OneKey® MLS as Distributed by MLS Grid
- 2025-12-16 Pending — OneKey® MLS as Distributed by MLS Grid
- 2025-10-30 Relisted — OneKey® MLS as Distributed by MLS Grid
- 2025-10-03 Relisted — OneKey® MLS as Distributed by MLS Grid
- 2025-07-16 Pending — OneKey® MLS as Distributed by MLS Grid
- 2025-06-13 Listed $699,000 OneKey® MLS as Distributed by MLS Grid
Cash-flow waterfall
monthlySold comps — $/sqft
last 12 mo · ≤1 miLoading sold comps…