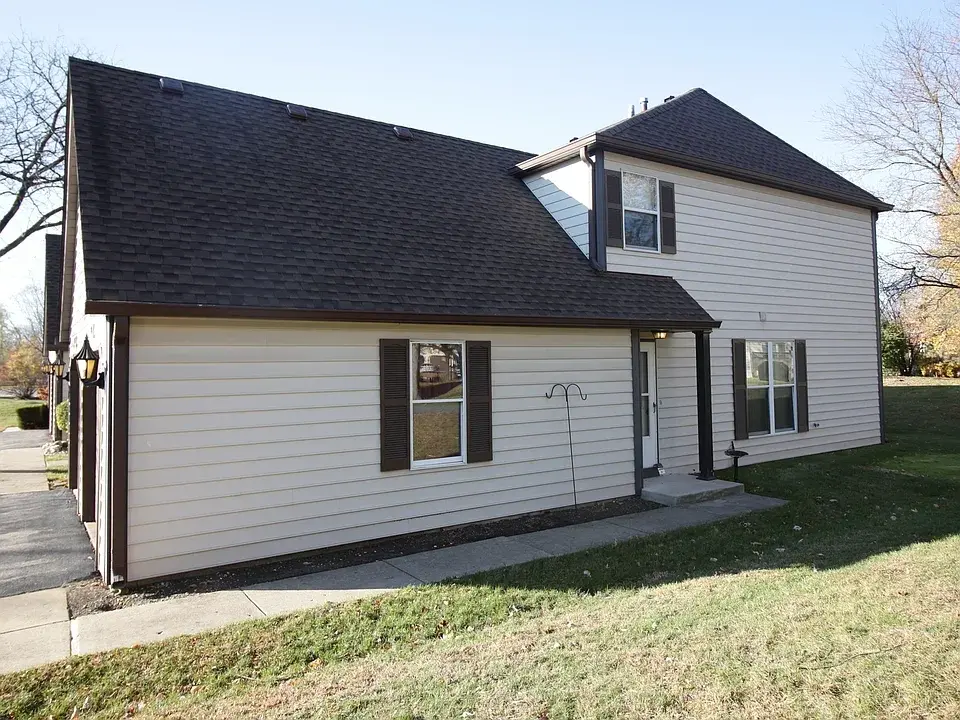
2605 Wingate Ct · Aurora, IL
Flood risk 4/10 · Minor
- FEMA flood zone
- X (unshaded)
- Chance of flooding over 30 yrs
- 0.2%
- Est. flood insurance / yr
- $507 – $1,088
Fire risk 1/10 · Minimal
- Est. fire insurance / yr
- $804 – $1,492
Heat risk 3/10 · Minor
- Hot days now (above 103°F)
- 7 days/yr
- Hot days in 30 yrs
- 15 days/yr
Wind risk 2/10 · Minimal
- Chance of severe wind over 30 yrs
- 1.0%
Air-quality risk 3/10 · Minor
- Unhealthy air days now
- 3 days/yr
- Unhealthy air days in 30 yrs
- 4 days/yr
Risk factors via First Street. Map © Google.
Why this score? — see what drove the C grade
The composite is a weighted blend of 9 inputs, each scored 0–100. Each bar is that input's sub-score; the figure is the points it added to the 100-point composite (weight × sub-score).
- Cash flow +22.1/30.0
- ARV discount +7.5/15.0
- DSCR +7.1/10.0
- 1% rule +5.9/10.0
- Schools +4.5/10.0
- Livability +3.8/5.0
- Rent growth +2.8/5.0
- Condition / age +2.5/5.0
- Appreciation +0.0/10.0
$245,000
🖨 Deal sheet 📄 Offer letter ✓ Due diligence
Listing remarks MLS
Almost everything in this townhome is new! Situated on a cul-de-sac with plenty of parking, this townhome is move-in ready and has plenty of features: * Brand New Kitchen: New 36" Cabinets, Soft-closing doors, New Stainless Steel Appliances, New Countertops, Garbage Disposal * All New Flooring Throughout: Premium Vinyl Flooring & Plush Carpet * New Windows, great lighting throughout * New Bathroom Fixtures & Vanities * New Bedroom Ceiling Fans * New Interior Solid-Core Doors and powder room pocket door * Laundry: Second Floor Washer & Dryer * Fully New Drywalled Garage * New Garage Door Motor Located between Butterfield Road and I-88, just south of FermiLab, this townhome is within the boundaries of Top-Rated Indian Prairie School District 204, is 2 miles from the Chicago Premium Outlets, situated for quick I-88 access, within walking distance to Butterfield Park, and nearby to the DuPage County Big Woods Forest Preserve. Great location! Townhomes in this neighborhood are going fast, so don't delay and call for a showing today.
Key facts
- Garage
- Built 1982
- Listed 12 days
Property features AI
Exterior
- Parking: Detached 1-car garage
- Home design: Built in 1982
- Exterior features: Located in the Country Oaks subdivision
Neighborhood map
What this means for you Summary
Snapshot
- This is a 2-bed/1.5-bath other listed at $245k.
Deal economics
- At list price, monthly cash flow is $396 ($5k/yr) — positive.
- The deal already cash-flows at list — no discount required.
- Meets the 1% rule at list price ($3k rent vs $245k).
- Cap rate 8.2% vs local median 3.5% in Aurora — top-decile yield for the area; either an underpriced asset or a hidden risk that comps aren't pricing in. Stress-test before assuming the spread holds.
Location & tenants
- Location reads 75/100 on livability (#232 in IL, #4,272 nationally) — a middle-class / working-renter tenant base. Strengths: commute A+, housing A+, employment A-; Watch: schools F, amenities F, health & safety F.
- Indian Prairie CUSD 204 (urban): math 47% / reading 47% proficiency, ranked #52 of 620 in IL (top 8%) — families likely to look elsewhere, expect single-tenant / working-renter base with shorter leases; only 13% free/reduced lunch — higher-income household profile.
- Market conditions: Rents rising (+1.2%/yr); 73 active listings in the ZIP; 5 comparable units currently listed for rent nearby; rentals at typical pace (median 24d on market — plan ~3-4 weeks tenant-placement turnaround); high-income renter base; 1,378 units permitted in DuPage County in 2024 (594 in 5+ unit buildings).
Forward outlook
- Local home prices are declining (-3.0%/yr); year-one equity from $2k of loan paydown is wiped out by about $7k of value loss. Plan a longer hold.
Negotiation context
- Only 12 days on market — expect competitive offers; lowballing is unlikely to land.
- 4 sale attempts since 6y ago with the ask held roughly flat each time — persistent listings suggest the price (not the market) is what's stuck; bring a comps-based counter.
- Current owner paid $167k; 47% above their basis — modest negotiation headroom, anchor on the comps not their cost.
Questions for the listing agent
- Is there a deadline driving the sale (1031 exchange, divorce, estate, relocation)? That informs how much negotiation room exists.
- Schools are F-rated, which usually means shorter tenancies and higher turnover. Who's the typical renter profile here, and what's been the actual vacancy rate?
- What's the average days-on-market for RENTAL listings here right now (not sales)? A rising rental-DOM trend means longer vacancies and softer asking-rent achievability than the comps imply.
- What's the recent tenant-quality profile in this submarket — average credit score on applications, eviction rate, late-payment / NSF rate, and stable-employment percentage? A property-management company in the area should have these aggregated.
- How much new for-sale + rental construction is in the pipeline within 1–3 miles? Heavy new supply typically softens prices + rents 12–24 months out; constrained supply supports both.
Investment metrics
- 1% rule
- 1.09% ✓
- Cap rate
- 8.23%
- Cash-on-cash
- 6.92%
- DSCR
- 1.31
- GRM
- 7.7
CMA / ARV
No comps found within radius.
Projected returns pro-forma
-3.0% appreciation · 1.2% rent growth · sell at horizon
- IRR
- -7.7%
- Equity multiple
- 0.72×
- Total profit
- $-19,199
- Equity at exit
- $36,530
- IRR
- -0.7%
- Equity multiple
- 0.96×
- Total profit
- $-2,849
- Equity at exit
- $21,183
Cash invested: $68,600 (down + closing). Projections, not guarantees.
Landlord ↔ Tenant lean methodology
- Overall (STATE)
- 43 Moderately Tenant-Leaning
- State Illinois
- 43 Moderately Tenant-Leaning · D+7
- County
- — inherits STATE
- City
- — inherits STATE
ZIP-level market 60502
- Home prices YoY
- -29.6%
- Rents YoY
- 1.2%
- Active inventory
- 73
- Price-to-rent
- 7.7×
Monthly cashflow live
- Estimated rent
- $2,668 high interval (Pro) →
- Mortgage (P&I)
- −$1,285
- Tax from tax record
- −$325 /mo · $3,900/yr
- Insurance
- −$102
- HOA
- −$0
- Vacancy / Maint / Mgmt
- −$560
- Net cashflow
- $396
Break-even live
UW: 25.0% down · 7.5% · 30yr · 1.5% tax · 5.0% vac · 8.0% maint · 8.0% mgmt
Financing live
Cash to close
- Down payment
- $61,250
- Closing costs
- $7,350
- Reserves months
- —
- Total cash needed
- —
Loan-product check · same deal, 3 products live
Conventional
25% down · 7.5% · 30yr
- Down + closing
- —
- Monthly P&I
- —
- Monthly cashflow
- —
- DSCR
- —
- Eligible?
- —
Personal DTI + credit; lowest rate.
DSCR
20% down · 8.5% · 30yr
- Down + closing
- —
- Monthly P&I
- —
- Monthly cashflow
- —
- DSCR
- —
- Eligible?
- —
No personal income docs; deal must DSCR.
Hard money
10% down · 12.0% · 12mo
- Down + closing
- —
- Monthly P&I
- —
- Monthly cashflow
- —
- DSCR
- —
- Eligible?
- —
Short-term bridge; refi at stabilization.
Rent comps 5 comps
| Address | Beds | Baths | Sqft | Rent | $/sqft | DOM | Units | Dist |
|---|---|---|---|---|---|---|---|---|
| 2621 Wingate Ct Aurora, IL | 2.0 | 1.5 | 900 | $4,250 | $4.72 | 43d | 1 | 0.05mi |
| 2454 Devonshire Ct Unit 2454 Aurora, IL | 2.0 | 1.5 | 1008 | $2,250 | $2.23 | 21d | 1 | 0.06mi |
| 2684 Waterford Ct Aurora, IL | 2.0 | 1.5 | 1028 | $1,950 | $1.90 | 24d | 1 | 0.14mi |
| 2715 Wilshire Ct Unit 2715 Aurora, IL | 2.0 | 1.0 | 686 | $1,850 | $2.70 | 24d | 1 | 0.16mi |
| 2288 Oakmeadow Dr Aurora, IL | 1.0–2.0 | 1.0–2.0 | 916 | $2,286 | $2.49 | 7d | 14 | 0.64mi |
Listing history 10 events
-
2026-06-18days on market $245,000 Active 12 DOM
-
2026-06-17days on market $245,000 Active 11 DOM
-
2026-06-16days on market $245,000 Active 10 DOM
-
2026-06-15days on market $245,000 Active 9 DOM
-
2026-06-13days on market $245,000 Active 7 DOM
-
2026-06-09remarks 411-char remark
-
2026-06-09days on market $245,000 Active 3 DOM
-
2026-06-08days on market $245,000 Active 2 DOM
-
2026-06-07remarks 382-char remark
-
2026-06-07$245,000 Active 1 DOM
ⓘ Source: listings_history table (triggers on properties + properties_extension) + one-shot
backfill from property_details.listing_events for pre-trigger history.
Tax reassessment forecast IL · Partial reset (capped growth)
- Current annual tax
- $3,900 · $325/mo
- Projected year-2 tax
- $4,731 · $394/mo
- Expected delta
- +$831/yr (+$69/mo · 21.3%)
ⓘ Screening estimate from a state-policy table — verify with the county assessor before closing.
Climate risk First Street
- Flood 4/10 Moderate FEMA zone X (unshaded) · 20% chance over 30 yrs
- Wildfire 1/10 Low
- Heat 3/10 Moderate 7 d/yr ≥103°F today · 15 d/yr by 30 yrs out
- Wind 2/10 Low 100% chance of damaging wind over 30 yrs
- Air quality 3/10 Moderate 3 unhealthy d/yr today · 4 by 30 yrs out
Nearby sold comps map
Loading sold comps map…
Walkable amenities ~0.75 mi
Loading nearby amenities…
Taxation est. · year 1
- Rental income
- $32,013
- − Mortgage interest
- −$13,724
- − Property taxes
- −$3,900
- − Insurance
- −$1,225
- − Repairs & maintenance
- −$2,561
- − Management
- −$2,561
- − Depreciation
- −$7,127
- Taxable income
- $914
- Est. tax owed @ 24.0%
- −$219
- After-tax cash flow
- $4,528/yr
For passive investors: Depreciation is non-cash, so a rental often shows a tax loss while cash-flowing — sheltering income. Rental losses are passive: they offset passive income freely, and up to $25,000/yr can offset ordinary (W-2) income if you actively participate and your MAGI is under $100k (phasing out to $0 by $150k); unused losses carry forward. On sale, claimed depreciation is recaptured at up to 25%, and gains may owe capital-gains tax (a 1031 exchange can defer both). Figures are a year-1 estimate at your 24.0% rate — not tax advice; consult a CPA.
Schools (NCES district)
- District
- Indian Prairie CUSD 204
- NCES district ID
- 1741690
- Math proficiency
- 47% ▼ -10.00%
- Reading proficiency
- 47% ▼ -12.00%
- Median HH income
- $100,618
- Composite
- 45.14/100
- National rank
- #2680
- State rank
- #52 of 620 in IL
Livability — Aurora
- Score
- 75/100
- State rank
- #232
- US rank
- #4272
Category grades
Schools grade is shown separately in the Schools card above.
Census & demographics
- Census place
- Aurora, IL
- County
- DuPage County · 904,569 people
- City population
- 186,692
- Metro
- Chicago-Naperville-Elgin, IL-IN-WI
- Population (ZIP)
- 23,308
- Household income
- $156,904
- Rent vs Own
- Severe rent burden
- 361.0
Population outlook (DuPage County) Hauer SSP2
- Today (2025)
- 960,187 people
- By 2030
- 965,850 · +0.6%
- By 2040
- 965,812 · +0.6%
- By 2050
- 954,890 · -0.6%
- By 2075
- 910,185 · -5.2%
- By 2100
- 816,255 · -15.0%
Race, ethnicity, and origin ACS 2023
- Neighborhood character
- Diverse neighborhood (Simpson 0.66)
- Race & ethnicity
- White 51% Asian 25% Hispanic / Latino 11% Two or more races 10% Black 9%
- Hispanic origin (detail)
- Mexican 8%
- Common ancestry
- Romanian 7% Italian 2% Portuguese 2%
- Foreign-born
- 24% · Canada, China
- Languages at home
- 66% English-only · Other Indo-European 12% Other Asian/Pacific 7% Spanish 6%
Political lean MEDSL · DuPage
- 2024 margin
- D (+13.3) · D 55.9% · R 42.5% · Other 1.6%
- 2008→2024 swing
- +2.5pp toward D · 2008: 10.8pp · 2024: 13.3pp
- All cycles
- 2024: D+13.3 2020: D+18.1 2016: D+14.1 2012: D+1.0 2008: D+10.8
Not yet ingested
- Civics
- —
Market trends
- HPI YoY
- ▼ -82.71%
- Current HPI
- 196.4892
- Rent YoY
- ▲ 1.20%
- Metro
- Chicago-Naperville-Elgin, IL-IN-WI
- State GDP YoY
- ▲ 1.59%
- F500 in state
- 60
Industry mix (Fortune 500 HQ in IL)
| Industry | F500 HQs | Revenue |
|---|---|---|
| Insurance | 4 | $201B |
|
||
| Consumer Goods | 4 | $87B |
|
||
| Industrial Machinery | 3 | $64B |
|
||
| Healthcare | 2 | $55B |
|
||
| Retail / Pharmacy | 1 | $148B |
|
||
| Agriculture / Food | 1 | $86B |
|
||
Price history
+491.9% since first listed13 events — show timeline
- 2026-06-06 Listed $245,000 FSBO.com
- 2021-06-03 Sold (Public Records) $167,000 Public Records
- 2021-04-06 Sold (MLS) $167,000 MRED as Distributed by MLS Grid
- 2021-02-16 Pending — MRED as Distributed by MLS Grid
- 2021-02-12 Listed $165,000 MRED as Distributed by MLS Grid
- 2021-02-10 Sold (Public Records) $94,000 Public Records
- 2020-11-24 Sold (MLS) $94,000 MRED as Distributed by MLS Grid
- 2020-11-13 Pending — MRED as Distributed by MLS Grid
- 2020-11-11 Relisted — MRED as Distributed by MLS Grid
- 2020-11-06 Pending — MRED as Distributed by MLS Grid
- 2020-11-04 Listed $99,900 MRED as Distributed by MLS Grid
- 1994-12-05 Sold (Public Records) $65,000 Public Records
- 1983-06-01 Sold (Public Records) $41,390 Public Records
Property tax history
+1.7%/yrLatest (2024): $3,900 · +4.1% YoY. Source: county tax records.
Cash-flow waterfall
monthlySold comps — $/sqft
last 12 mo · ≤1 miLoading sold comps…