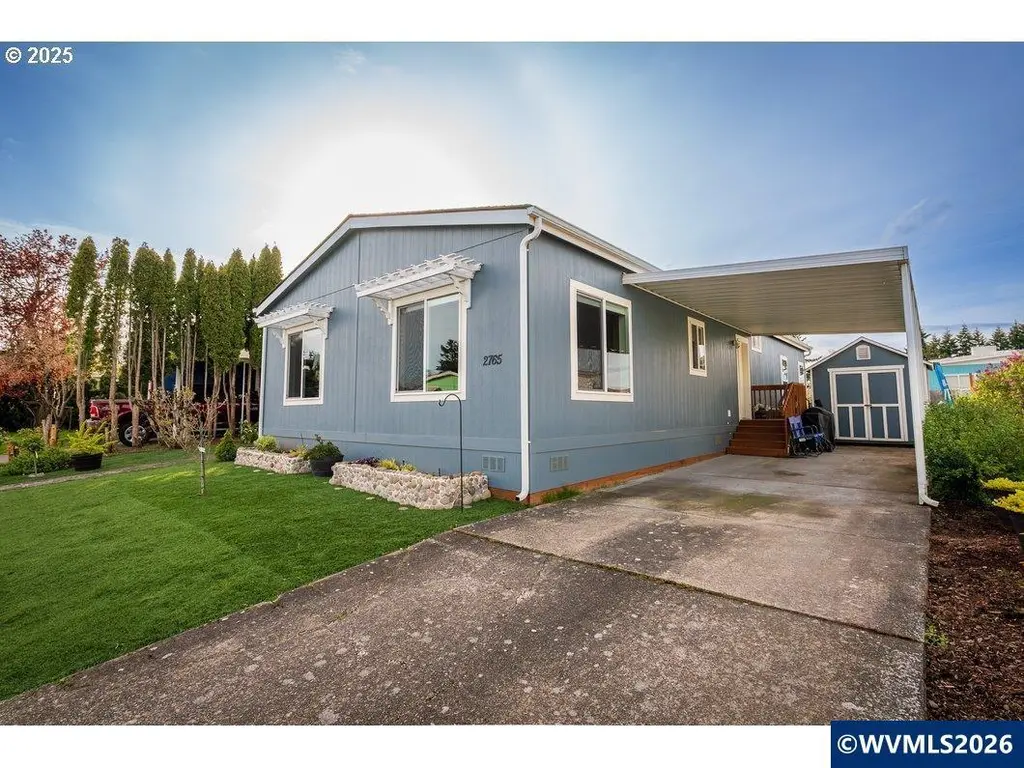
2765 SE Oakland Loop · Salem, OR
Flood risk 1/10 · Minimal
- FEMA flood zone
- X (unshaded)
- Chance of flooding over 30 yrs
- 0.0%
- Est. flood insurance / yr
- $507 – $1,088
Fire risk 3/10 · Minor
- Est. fire insurance / yr
- $498 – $926
Heat risk 4/10 · Minor
- Hot days now (above 91°F)
- 7 days/yr
- Hot days in 30 yrs
- 15 days/yr
Wind risk 1/10 · Minimal
- Chance of severe wind over 30 yrs
- —
Air-quality risk 9/10 · Severe
- Unhealthy air days now
- 12 days/yr
- Unhealthy air days in 30 yrs
- 13 days/yr
Risk factors via First Street. Map © Google.
Why this score? — see what drove the B grade
The composite is a weighted blend of 9 inputs, each scored 0–100. Each bar is that input's sub-score; the figure is the points it added to the 100-point composite (weight × sub-score).
- Cash flow +30.0/30.0
- 1% rule +10.0/10.0
- DSCR +10.0/10.0
- ARV discount +7.5/15.0
- Livability +4.0/5.0
- Schools +3.7/10.0
- Rent growth +3.2/5.0
- Condition / age +2.5/5.0
- Appreciation +0.0/10.0
$110,000
🖨 Deal sheet 📄 Offer letter ✓ Due diligence
Listing remarks MLS
Like new, all electric 2018 Fleetwood w/ 3 BR/2 BA in Meadowlark Estates' 55+ park where park rent covers water, sewer, garbage & clubhouse. Open floor plan w/ numerous windows for light/bright. Laminate flooring in dining, kitchen & high traffic areas; carpet in living & bedrooms. Stainless steel appls in kitchen w/ lg eat-in bar & pantry. 10 ft ceilings throughout; MBR w/ WIcloset & MBA w/ WIshower & dual sinks; hall BA w/ tub/sh combo; irrigation system; partially fenced yard; shed w/elec and freezer.
Key facts
- Low-maintenance yard
- Open-concept layout
- 2 garage spots
Tags
Property features AI
Finance
- Other: Home warranty: negotiable; Mobile home make: Fleetwood, model Waverly, serial FLE210OR18; Size source: county
- HOA & community: Adult-only park; Park rent includes: see remarks
Exterior
- Parking: Carport; 2-car garage
- Utilities: City water; City sewer; Electric water heater
- Home design: Double wide mobile home; Front door at left; Exterior color: blue and white
- Construction: Built in 2018; Pier foundation; Fiber cement lap siding; Shingle roof
- Exterior features: Partial fenced yard; Covered patio; Landscaped yard; Shed (outbuilding); Irregular lot
Interior
- Kitchen: Dishwasher; Electric range
- Bedrooms: Master bedroom on main level (13 x 10); Bedroom 2 on main level (13 x 10); Bedroom 3 on main level (13 x 13)
- Flooring: Carpet; Laminate
- Bathrooms: Two bathrooms on main level
- Heating & cooling: Electric heating; Heat pump; Forced air
- Interior features: High-speed internet available; Area dining (combination); Disposal
- Laundry & utility: Utility room on main level (9 x 6)
Neighborhood map
What this means for you Summary
Snapshot
- This is a 3-bed/2.0-bath other listed at $110k.
Deal economics
- At list price, monthly cash flow is $911 ($11k/yr) — positive.
- The deal already cash-flows at list — no discount required.
- Meets the 1% rule at list price ($2k rent vs $110k).
- Cap rate 16.2% vs local median 2.9% in Salem — top-decile yield for the area; either an underpriced asset or a hidden risk that comps aren't pricing in. Stress-test before assuming the spread holds.
Location & tenants
- Location reads 79/100 on livability (#59 in OR, #2,084 nationally) — a middle-class / working-renter tenant base. Strengths: amenities A+, commute A+, housing A+; Watch: crime F.
- Salem-Keizer SD 24J (urban): math 34% / reading 47% proficiency, ranked #103 of 183 in OR (top 56%) — families likely to look elsewhere, expect single-tenant / working-renter base with shorter leases.
- Zoned schools: North Salem High School (2,239 students, 74% FRL) — zoned schools average 74% FRL vs 53% district-wide (21 pts higher); higher-poverty schools than district average — tighter screening recommended.
- Market conditions: Rents rising (+2.6%/yr); 133 active listings in the ZIP; 8 comparable units currently listed for rent nearby; rentals leasing fast (median 14d on market — plan ~1-2 weeks tenant-placement turnaround); solid renter incomes; 1,591 units permitted in Marion County in 2024 (716 in 5+ unit buildings).
- This rent runs 31% of the median local income ($84k/yr) — at the standard rent-burdened threshold; future hikes will face affordability resistance.
Forward outlook
- Local home prices are declining (-3.0%/yr); year-one equity from $761 of loan paydown is wiped out by about $3k of value loss. Plan a longer hold.
- Marion County population projected at +17% by 2050 — long-run rental-demand tailwind backs the buy-and-hold thesis.
- At projected returns (-3.0% appreciation + 2.6% rent growth), your $31k cash investment doubles in ~4 years — after that, you're playing with house money.
Negotiation context
- Only 9 days on market — expect competitive offers; lowballing is unlikely to land.
- 2 sale attempts since 4y ago with the ask held roughly flat each time — persistent listings suggest the price (not the market) is what's stuck; bring a comps-based counter.
Questions for the listing agent
- Is there a deadline driving the sale (1031 exchange, divorce, estate, relocation)? That informs how much negotiation room exists.
- Schools are D-rated, which usually means shorter tenancies and higher turnover. Who's the typical renter profile here, and what's been the actual vacancy rate?
- Crime grade is F in this area — have there been break-ins, vandalism, or insurance claims at this property in the last 3 years? What carrier currently insures it and at what premium?
- What's the average days-on-market for RENTAL listings here right now (not sales)? A rising rental-DOM trend means longer vacancies and softer asking-rent achievability than the comps imply.
- What's the recent tenant-quality profile in this submarket — average credit score on applications, eviction rate, late-payment / NSF rate, and stable-employment percentage? A property-management company in the area should have these aggregated.
- How much new for-sale + rental construction is in the pipeline within 1–3 miles? Heavy new supply typically softens prices + rents 12–24 months out; constrained supply supports both.
Investment metrics
- 1% rule
- 1.95% ✓
- Cap rate
- 16.24%
- Cash-on-cash
- 35.51%
- DSCR
- 2.58
- GRM
- 4.3
CMA / ARV
No comps found within radius.
Projected returns pro-forma
-3.0% appreciation · 2.62% rent growth · sell at horizon
- IRR
- 30.7%
- Equity multiple
- 2.28×
- Total profit
- $39,455
- Equity at exit
- $16,401
- IRR
- 37.7%
- Equity multiple
- 4.44×
- Total profit
- $105,969
- Equity at exit
- $9,511
Cash invested: $30,800 (down + closing). Projections, not guarantees.
Landlord ↔ Tenant lean methodology
- Overall (STATE)
- 28 Tenant-Leaning
- State Oregon
- 28 Tenant-Leaning · D+6
- County
- — inherits STATE
- City
- — inherits STATE
ZIP-level market 97317
- Rents YoY
- 2.6%
- Active inventory
- 133
- Price-to-rent
- 4.3×
Monthly cashflow live
- Estimated rent
- $2,147 high interval (Pro) →
- Mortgage (P&I)
- −$577
- Tax from tax record
- −$162 /mo · $1,946/yr
- Insurance
- −$46
- HOA
- −$0
- Vacancy / Maint / Mgmt
- −$451
- Net cashflow
- $911
Break-even live
UW: 25.0% down · 7.5% · 30yr · 1.5% tax · 5.0% vac · 8.0% maint · 8.0% mgmt
Financing live
Cash to close
- Down payment
- $27,500
- Closing costs
- $3,300
- Reserves months
- —
- Total cash needed
- —
Loan-product check · same deal, 3 products live
Conventional
25% down · 7.5% · 30yr
- Down + closing
- —
- Monthly P&I
- —
- Monthly cashflow
- —
- DSCR
- —
- Eligible?
- —
Personal DTI + credit; lowest rate.
DSCR
20% down · 8.5% · 30yr
- Down + closing
- —
- Monthly P&I
- —
- Monthly cashflow
- —
- DSCR
- —
- Eligible?
- —
No personal income docs; deal must DSCR.
Hard money
10% down · 12.0% · 12mo
- Down + closing
- —
- Monthly P&I
- —
- Monthly cashflow
- —
- DSCR
- —
- Eligible?
- —
Short-term bridge; refi at stabilization.
Rent comps 8 comps
| Address | Beds | Baths | Sqft | Rent | $/sqft | DOM | Units | Dist |
|---|---|---|---|---|---|---|---|---|
| 4665 Campbell Dr SE Salem, OR | 1.0–3.0 | 1.0–2.0 | 923 | $2,099 | $2.27 | 13d | 1 | 0.28mi |
| 1447 Connecticut St SE Salem, OR | 3.0 | 2.0 | 1258 | $2,675 | $2.13 | 43d | 1 | 0.59mi |
| 1569 Whitaker Dr SE Salem, OR | 1.0–3.0 | 1.0–2.0 | 933 | $2,299 | $2.46 | 13d | 1 | 0.71mi |
| 4776 Buffalo Dr SE Salem, OR | 3.0 | 1.0 | 1369 | $2,150 | $1.57 | 43d | 1 | 0.99mi |
| 4807 Chinook Ct SE Salem, OR | 3.0 | 1.5 | 1104 | $2,200 | $1.99 | 13d | 1 | 1.11mi |
| 5192 Caplinger Rd SE Salem, OR | 1.0–3.0 | 1.0–2.0 | 927 | $1,802 | $1.94 | 13d | 25 | 1.13mi |
| 3897 Meadowlawn Loop SE Salem, OR | 1.0–3.0 | 1.0–2.0 | 962 | $1,958 | $2.03 | 13d | 26 | 1.43mi |
| 4836 Tanglewood Ct SE Salem, OR | 3.0 | 2.0 | 1316 | $2,150 | $1.63 | 23d | 1 | 1.50mi |
Listing history 18 events
-
2026-06-18days on market $110,000 Active 9 DOM
-
2026-06-17days on market $110,000 Active 8 DOM
-
2026-06-16days on market $110,000 Active 7 DOM
-
2026-06-15days on market $110,000 Active 6 DOM
-
2026-06-14days on market $110,000 Active 4 DOM
-
2026-06-10days on market $110,000 Active 1 DOM
-
2026-06-09days on market $110,000 Active 12 DOM
-
2026-06-08days on market $110,000 Active 11 DOM
-
2026-06-07days on market $110,000 Active 10 DOM
-
2026-06-03days on market $110,000 Active 6 DOM
-
2026-06-02days on market $110,000 Active 5 DOM
-
2026-06-01days on market $110,000 Active 4 DOM
-
2026-05-31days on market $110,000 Active 3 DOM
-
2026-05-30days on market $110,000 Active 2 DOM
-
2026-05-28$110,000 Active
-
2022-06-01soldstatus $149,900 Sold 533-char remark
Show marketing remark (533 chars)
Like new, all electric 2018 Fleetwood w/ 3 BR/2 BA in Meadowlark Estates' 55+ park where park rent covers water, sewer, garbage & clubhouse. Open floor plan w/ numerous windows for light/bright. Laminate flooring in dining, kitchen & high traffic areas; carpet in living & bedrooms. Stainless steel appls in kitchen w/ lg eat-in bar & pantry. 10 ft ceilings throughout; MBR w/ WIcloset & MBA w/ WIshower & dual sinks; hall BA w/ tub/sh combo; irrigation system; partially fenced yard; shed w/elec and freezer.
-
2022-05-18historical Active under Contract 533-char remark
Show marketing remark (533 chars)
Like new, all electric 2018 Fleetwood w/ 3 BR/2 BA in Meadowlark Estates' 55+ park where park rent covers water, sewer, garbage & clubhouse. Open floor plan w/ numerous windows for light/bright. Laminate flooring in dining, kitchen & high traffic areas; carpet in living & bedrooms. Stainless steel appls in kitchen w/ lg eat-in bar & pantry. 10 ft ceilings throughout; MBR w/ WIcloset & MBA w/ WIshower & dual sinks; hall BA w/ tub/sh combo; irrigation system; partially fenced yard; shed w/elec and freezer.
-
2022-05-16$149,900 Active 533-char remark
Show marketing remark (533 chars)
Like new, all electric 2018 Fleetwood w/ 3 BR/2 BA in Meadowlark Estates' 55+ park where park rent covers water, sewer, garbage & clubhouse. Open floor plan w/ numerous windows for light/bright. Laminate flooring in dining, kitchen & high traffic areas; carpet in living & bedrooms. Stainless steel appls in kitchen w/ lg eat-in bar & pantry. 10 ft ceilings throughout; MBR w/ WIcloset & MBA w/ WIshower & dual sinks; hall BA w/ tub/sh combo; irrigation system; partially fenced yard; shed w/elec and freezer.
ⓘ Source: listings_history table (triggers on properties + properties_extension) + one-shot
backfill from property_details.listing_events for pre-trigger history.
Tax reassessment forecast OR · Resets to sale price
- Current annual tax
- $1,946 · $162/mo
- Projected year-2 tax
- $1,946 · $162/mo
- Expected delta
- $0/yr ($0/mo · 0.0%)
ⓘ Screening estimate from a state-policy table — verify with the county assessor before closing.
Climate risk First Street
- Flood 1/10 Low FEMA zone X (unshaded) · 0% chance over 30 yrs
- Wildfire 3/10 Moderate
- Heat 4/10 Moderate 7 d/yr ≥91°F today · 15 d/yr by 30 yrs out
- Wind 1/10 Low
- Air quality 9/10 Extreme 12 unhealthy d/yr today · 13 by 30 yrs out
Nearby sold comps map
Loading sold comps map…
Walkable amenities ~0.75 mi
Loading nearby amenities…
Taxation est. · year 1
- Rental income
- $25,766
- − Mortgage interest
- −$6,162
- − Property taxes
- −$1,946
- − Insurance
- −$550
- − Repairs & maintenance
- −$2,061
- − Management
- −$2,061
- − Depreciation
- −$3,200
- Taxable income
- $9,786
- Est. tax owed @ 24.0%
- −$2,349
- After-tax cash flow
- $8,589/yr
For passive investors: Depreciation is non-cash, so a rental often shows a tax loss while cash-flowing — sheltering income. Rental losses are passive: they offset passive income freely, and up to $25,000/yr can offset ordinary (W-2) income if you actively participate and your MAGI is under $100k (phasing out to $0 by $150k); unused losses carry forward. On sale, claimed depreciation is recaptured at up to 25%, and gains may owe capital-gains tax (a 1031 exchange can defer both). Figures are a year-1 estimate at your 24.0% rate — not tax advice; consult a CPA.
Schools (NCES district)
- District
- Salem-Keizer SD 24J
- NCES district ID
- 4110820
- Math proficiency
- 34% ▼ -1.00%
- Reading proficiency
- 47% ▼ -2.00%
- Median HH income
- $48,632
- Composite
- 37.16/100
- National rank
- #9017
- State rank
- #103 of 183 in OR
Livability — Salem
- Score
- 79/100
- State rank
- #59
- US rank
- #2084
Category grades
Schools grade is shown separately in the Schools card above.
Census & demographics
- Census place
- Salem, OR
- County
- Marion County · 258,219 people
- City population
- 193,601
- Metro
- Salem, OR
- Population (ZIP)
- 25,966
- Household income
- $84,393
- Rent vs Own
- Severe rent burden
- 395.0
Population outlook (Marion County) Hauer SSP2
- Today (2025)
- 360,940 people
- By 2030
- 375,178 · +3.9%
- By 2040
- 400,914 · +11.1%
- By 2050
- 422,187 · +17.0%
- By 2075
- 460,305 · +27.5%
- By 2100
- 464,025 · +28.6%
Race, ethnicity, and origin ACS 2023
- Neighborhood character
- Majority White (61%)
- Race & ethnicity
- White 61% Hispanic / Latino 28% Two or more races 17% Asian 2% Pacific Islander 2%
- Hispanic origin (detail)
- Mexican 26%
- Common ancestry
- Portuguese 4% Italian 2% Lithuanian 2%
- Foreign-born
- 11% · Canada, Vietnam
- Languages at home
- 74% English-only · Spanish 22% Russian/Polish/Slavic 2% German/W. Germanic 1%
Political lean MEDSL · Marion
- 2024 margin
- Toss-up / Even · D 47.5% · R 49.5% · Other 3.0%
- 2008→2024 swing
- -4.2pp toward R · 2008: 2.2pp · 2024: -2.0pp
- All cycles
- 2024: R+2.0 2020: D+1.1 2016: R+5.0 2012: R+3.5 2008: D+2.2
Not yet ingested
- Civics
- —
Market trends
- HPI YoY
- ▼ -471.73%
- Current HPI
- 307.3264
- Rent YoY
- ▲ 2.62%
- Metro
- Salem, OR
- State GDP YoY
- ▲ 2.05%
- F500 in state
- 2
Industry mix (Fortune 500 HQ in OR)
| Industry | F500 HQs | Revenue |
|---|---|---|
| Consumer Goods | 1 | $51B |
|
||
Price history
-26.6% since first listed4 events — show timeline
- 2026-05-28 Listed $110,000 WVMLS
- 2022-06-01 Sold (MLS) $149,900 WVMLS
- 2022-05-18 Contingent — WVMLS
- 2022-05-16 Listed $149,900 WVMLS
Property tax history
+9.2%/yrLatest (2025): $1,946 · +7.7% YoY. Source: county tax records.
Cash-flow waterfall
monthlySold comps — $/sqft
last 12 mo · ≤1 miLoading sold comps…