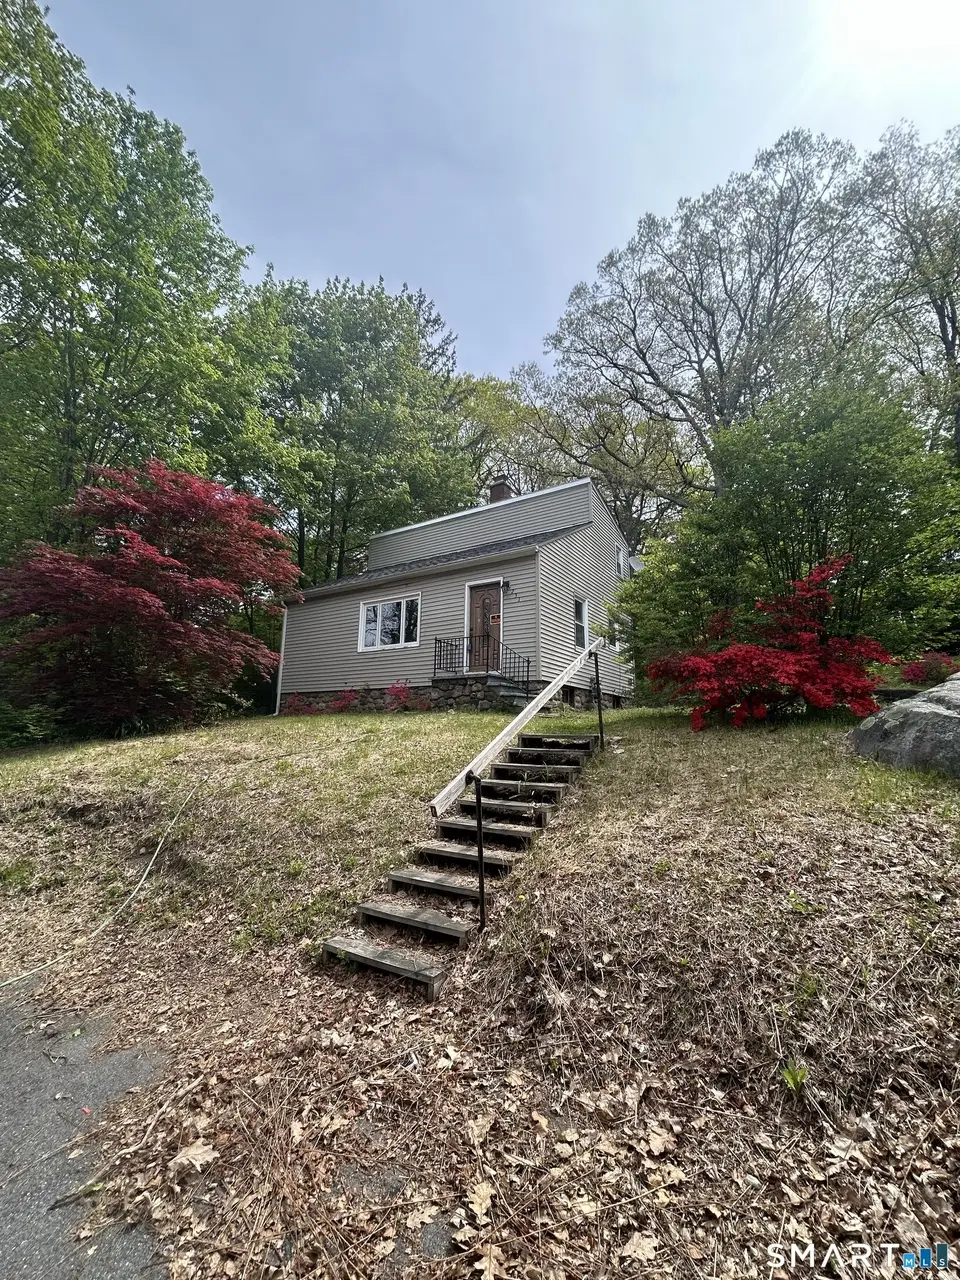
231 Patterson St · Torrington, CT
Flood risk 1/10 · Minimal
- FEMA flood zone
- X
- Chance of flooding over 30 yrs
- 0.0%
- Est. flood insurance / yr
- $473 – $860
Fire risk 1/10 · Minimal
- Est. fire insurance / yr
- $829 – $1,539
Heat risk 4/10 · Minor
- Hot days now (above 93°F)
- 7 days/yr
- Hot days in 30 yrs
- 17 days/yr
Wind risk 5/10 · Moderate
- Chance of severe wind over 30 yrs
- 26.0%
Air-quality risk 2/10 · Minimal
- Unhealthy air days now
- 1 days/yr
- Unhealthy air days in 30 yrs
- 1 days/yr
Risk factors via First Street. Map © Google.
Why this score? — see what drove the B+ grade
The composite is a weighted blend of 9 inputs, each scored 0–100. Each bar is that input's sub-score; the figure is the points it added to the 100-point composite (weight × sub-score).
- Cash flow +29.3/30.0
- ARV discount +15.0/15.0
- DSCR +10.0/10.0
- 1% rule +8.9/10.0
- Rent growth +4.0/5.0
- Livability +3.8/5.0
- Schools +2.7/10.0
- Condition / age +2.5/5.0
- Appreciation +0.0/10.0
$149,900
🖨 Deal sheet (PDF) 📄 Offer letter ✓ Due diligence
Listing remarks MLS
Absolutely Gorgeous home.. This Home features: New Roof, Update Electric, New Kitchen w/ Cabinets, Counter, Appliances, Flooring, New Bathroom, Refinished Hardwood Floors, New Carpet in all the Bedrooms, Brand new Deck on the second Floor. Very Private back yard. Come and See this Beauty!!
Key facts
- 0.27 acre lot
- 2 parking spots
- Built 1949
Property features AI
Exterior
- Parking: Driveway; Two parking spaces
- Utilities: Public water connected; Public sewer connected; Oil fuel tank located in basement
- Home design: Single-family home
- Construction: Frame construction; Stone foundation; Asphalt shingle roof; Vinyl siding; Built with a private driveway
- Exterior features: Lightly wooded, sloping lot; Private driveway
Interior
- Bedrooms: Three bedrooms
- Bathrooms: One full bathroom
- Heating & cooling: Central air conditioning; Hot air heating powered by oil; Oil hot water
- Interior features: Six total rooms; Full basement
Neighborhood map
What this means for you Summary
Snapshot
- This is a 4-bed/1.0-bath single-family listed at $150k.
Deal economics
- At list price, monthly cash flow is $528 ($6k/yr) — positive.
- The deal already cash-flows at list — no discount required.
- Meets the 1% rule at list price ($2k rent vs $150k).
- Cap rate 10.5% vs local median 3.9% in Torrington — top-decile yield for the area; either an underpriced asset or a hidden risk that comps aren't pricing in. Stress-test before assuming the spread holds.
Location & tenants
- Location reads 76/100 on livability (#53 in CT, #3,449 nationally) — a middle-class / working-renter tenant base. Strengths: crime A+, cost of living A+, housing A+; Watch: commute F.
- Torrington School District (town): math 22% / reading 39% proficiency, ranked #125 of 153 in CT (top 82%) — families likely to look elsewhere, expect single-tenant / working-renter base with shorter leases.
- Zoned schools: Torrington High School (math 22% / reading 47%, grade F, #121 of 194 statewide, top 64%, 1,010 students, 57% FRL) — zoned schools average 57% FRL vs 40% district-wide (17 pts higher); higher-poverty schools than district average — tighter screening recommended.
- Market conditions: Rents rising fast (+5.9%/yr); 190 active listings in the ZIP; 8 comparable units currently listed for rent nearby; rentals lingering (median 45d on market — plan ~5-8 weeks vacancy on turnover, expect pricing pressure); 88% of comp listings sitting > 30 days — soft ceiling on asking rent; 154 units permitted in Northwest Hills Planning Region in 2024 (6 in 5+ unit buildings).
- This rent runs 35% of the median local income ($71k/yr) — at the standard rent-burdened threshold; future hikes will face affordability resistance.
Forward outlook
- Local home prices are declining (-3.0%/yr); year-one equity from $1k of loan paydown is wiped out by about $4k of value loss. Plan a longer hold.
- At projected returns (-3.0% appreciation + 5.9% rent growth), your $42k cash investment doubles in ~7 years — after that, you're playing with house money.
Negotiation context
- Only 6 days on market — expect competitive offers; lowballing is unlikely to land.
- 2 sale attempts since 10y ago with the ask held roughly flat each time — persistent listings suggest the price (not the market) is what's stuck; bring a comps-based counter.
- Current owner paid $72k; list at $150k implies a 107% gain — meaningful room to come down on a strong offer.
Risks & watch-outs
- Watch-outs: built in 1949 — expect roof / HVAC / electrical / plumbing capex.
- Climate carrying-cost: moderate wind risk, 26% chance of damaging wind over 30y — expect insurance premiums to compound above CPI over the hold.
Questions for the listing agent
- Built in 1949 — when were the roof, HVAC, electrical panel, plumbing, and water heater last replaced?
- Is there a deadline driving the sale (1031 exchange, divorce, estate, relocation)? That informs how much negotiation room exists.
- Schools are D-rated, which usually means shorter tenancies and higher turnover. Who's the typical renter profile here, and what's been the actual vacancy rate?
- What's the average days-on-market for RENTAL listings here right now (not sales)? A rising rental-DOM trend means longer vacancies and softer asking-rent achievability than the comps imply.
- What's the recent tenant-quality profile in this submarket — average credit score on applications, eviction rate, late-payment / NSF rate, and stable-employment percentage? A property-management company in the area should have these aggregated.
- How much new for-sale + rental construction is in the pipeline within 1–3 miles? Heavy new supply typically softens prices + rents 12–24 months out; constrained supply supports both.
Investment metrics
- 1% rule
- 1.39% ✓
- Cap rate
- 10.52%
- Cash-on-cash
- 15.09%
- DSCR
- 1.67
- GRM
- 6.0
CMA / ARV
- ARV (median comp)
- $236,693
- List price
- $149,900
- Delta
- -36.67%
- Verdict
- UNDERPRICED
- Comps
- 20 within 1.0 mi
Show comp detail 7 sales within ~0.75 mi
| Address | Dist | Beds/Ba | Sqft | Sold | Price | $/sf | Match |
|---|---|---|---|---|---|---|---|
| 39 Alder St | 0.07mi | 3/1.0 (-1) | 952 (+5%) | 17mo | $260,000 | $273 | 70 |
| 1 Henrietta St | 0.39mi | 3/1.0 (-1) | 917 (+1%) | 18mo | $214,900 | $234 | 60 |
| 98 Torcon Dr | 0.63mi | 3/1.0 (-1) | 960 (+6%) | 0mo | $325,000 | $339 | 56 |
| 55 Barton St | 0.35mi | 3/2.0 (-1) | 1,012 (+11%) | 1mo | $305,500 | $302 | 55 |
| 50 Fowler Ave | 0.58mi | 3/1.0 (-1) | 936 (+3%) | 15mo | $290,000 | $310 | 51 |
| 150 Torcon Dr | 0.61mi | 3/1.0 (-1) | 912 (+0%) | 20mo | $230,000 | $252 | 50 |
| 106 Wilmot St | 0.38mi | 3/1.0 (-1) | 1,040 (+14%) | 18mo | $260,000 | $250 | 38 |
Match score weights: distance 35% · size 25% · config 20% · recency 20%. Top-matched comps best support the ARV.
Projected returns pro-forma
-3.0% appreciation · 5.89% rent growth · sell at horizon
- IRR
- 9.2%
- Equity multiple
- 1.37×
- Total profit
- $15,653
- Equity at exit
- $22,351
- IRR
- 20.8%
- Equity multiple
- 3.01×
- Total profit
- $84,441
- Equity at exit
- $12,961
Cash invested: $41,972 (down + closing). Projections, not guarantees.
Landlord ↔ Tenant lean methodology
- Overall (STATE)
- 27 Tenant-Leaning
- State Connecticut
- 27 Tenant-Leaning · D+7
- County
- — inherits STATE
- City
- — inherits STATE
ZIP-level market 06790
- Rents YoY
- 5.9%
- Active inventory
- 190
- Price-to-rent
- 6.0×
Monthly cashflow live
- Estimated rent
- $2,087 high interval (Pro) →
- Mortgage (P&I)
- −$786
- Tax from tax record
- −$272 /mo · $3,265/yr
- Insurance
- −$62
- HOA
- −$0
- Vacancy / Maint / Mgmt
- −$438
- Net cashflow
- $528
Break-even live
Sensitivity live
| Price | -10% $613 | -5% $570 | +0% $528 | +5% $485 | +10% $443 |
|---|---|---|---|---|---|
| Rent | -10% $363 | -5% $445 | +0% $528 | +5% $610 | +10% $693 |
| Rate | -1.0pp $603 | -0.5pp $566 | base $528 | +0.5pp $489 | +1.0pp $449 |
UW: 25.0% down · 7.5% · 30yr · 1.5% tax · 5.0% vac · 8.0% maint · 8.0% mgmt
Financing live
Cash to close
- Down payment
- $37,475
- Closing costs
- $4,497
- Reserves months
- —
- Total cash needed
- —
Loan-product check · same deal, 3 products live
Conventional
25% down · 7.5% · 30yr
- Down + closing
- —
- Monthly P&I
- —
- Monthly cashflow
- —
- DSCR
- —
- Eligible?
- —
Personal DTI + credit; lowest rate.
DSCR
20% down · 8.5% · 30yr
- Down + closing
- —
- Monthly P&I
- —
- Monthly cashflow
- —
- DSCR
- —
- Eligible?
- —
No personal income docs; deal must DSCR.
Hard money
10% down · 12.0% · 12mo
- Down + closing
- —
- Monthly P&I
- —
- Monthly cashflow
- —
- DSCR
- —
- Eligible?
- —
Short-term bridge; refi at stabilization.
Rent comps 8 comps
| Address | Beds | Baths | Sqft | Rent | $/sqft | DOM | Units | Dist |
|---|---|---|---|---|---|---|---|---|
| 243 E Elm St Unit 3 Torrington, CT | 3.0 | 1.0 | 1000 | $1,800 | $1.80 | 44d | 1 | 0.51mi |
| 53 Prospect St Unit 2 Torrington, CT | 3.0 | 1.5 | 1100 | $2,100 | $1.91 | 44d | 1 | 0.70mi |
| 93 E Elm St Unit U2 Torrington, CT | 3.0 | 1.0 | 1100 | $1,550 | $1.41 | 44d | 1 | 0.72mi |
| 5 Winthrop St Torrington, CT | 3.0 | 1.5 | 1072 | $2,350 | $2.19 | 44d | 1 | 0.77mi |
| 54 Forest St Unit 2 Torrington, CT | 3.0 | 1.0 | 1000 | $1,800 | $1.80 | 44d | 1 | 0.80mi |
| 340 Brightwood Ave Unit 2 Torrington, CT | 3.0 | 1.0 | 1080 | $1,900 | $1.76 | 44d | 1 | 0.81mi |
| 148 Edgewood Dr Torrington, CT | 3.0 | 1.0 | 1000 | $2,500 | $2.50 | 24d | 1 | 0.83mi |
| 58 Pulaski St Unit 3 Torrington, CT | 3.0 | 1.0 | 980 | $1,550 | $1.58 | 44d | 1 | 1.03mi |
Listing history 6 events
-
2026-05-17status Under Contract 214-char remark
-
2026-05-11$149,900 Active 214-char remark
-
2017-01-27soldstatus $72,500 290-char remark
Show marketing remark (290 chars)
Absolutely Gorgeous home.. This Home features: New Roof, Update Electric, New Kitchen w/ Cabinets, Counter, Appliances, Flooring, New Bathroom, Refinished Hardwood Floors, New Carpet in all the Bedrooms, Brand new Deck on the second Floor. Very Private back yard. Come and See this Beauty!!
-
2017-01-10historical 290-char remark
Show marketing remark (290 chars)
Absolutely Gorgeous home.. This Home features: New Roof, Update Electric, New Kitchen w/ Cabinets, Counter, Appliances, Flooring, New Bathroom, Refinished Hardwood Floors, New Carpet in all the Bedrooms, Brand new Deck on the second Floor. Very Private back yard. Come and See this Beauty!!
-
2016-07-27$74,900 290-char remark
Show marketing remark (290 chars)
Absolutely Gorgeous home.. This Home features: New Roof, Update Electric, New Kitchen w/ Cabinets, Counter, Appliances, Flooring, New Bathroom, Refinished Hardwood Floors, New Carpet in all the Bedrooms, Brand new Deck on the second Floor. Very Private back yard. Come and See this Beauty!!
-
1987-10-30soldstatus $78,900
ⓘ Source: listings_history table (triggers on properties + properties_extension) + one-shot
backfill from property_details.listing_events for pre-trigger history.
Tax reassessment forecast CT · Partial reset (capped growth)
- Current annual tax
- $3,265 · $272/mo
- Projected year-2 tax
- $3,265 · $272/mo
- Expected delta
- $0/yr ($0/mo · 0.0%)
ⓘ Screening estimate from a state-policy table — verify with the county assessor before closing.
Climate risk First Street
- Flood 1/10 Low FEMA zone X · 0% chance over 30 yrs
- Wildfire 1/10 Low
- Heat 4/10 Moderate 7 d/yr ≥93°F today · 17 d/yr by 30 yrs out
- Wind 5/10 Major 26% chance of damaging wind over 30 yrs
- Air quality 2/10 Low 1 unhealthy d/yr today · 1 by 30 yrs out
Nearby sold comps map
Loading sold comps map…
Walkable amenities ~0.75 mi
Loading nearby amenities…
Taxation est. · year 1
- Rental income
- $25,040
- − Mortgage interest
- −$8,397
- − Property taxes
- −$3,265
- − Insurance
- −$750
- − Repairs & maintenance
- −$2,003
- − Management
- −$2,003
- − Depreciation
- −$4,361
- Taxable income
- $4,261
- Est. tax owed @ 24.0%
- −$1,023
- After-tax cash flow
- $5,311/yr
For passive investors: Depreciation is non-cash, so a rental often shows a tax loss while cash-flowing — sheltering income. Rental losses are passive: they offset passive income freely, and up to $25,000/yr can offset ordinary (W-2) income if you actively participate and your MAGI is under $100k (phasing out to $0 by $150k); unused losses carry forward. On sale, claimed depreciation is recaptured at up to 25%, and gains may owe capital-gains tax (a 1031 exchange can defer both). Figures are a year-1 estimate at your 24.0% rate — not tax advice; consult a CPA.
Schools (NCES district)
- District
- Torrington School District
- NCES district ID
- 0904590
- Math proficiency
- 22% ▼ -8.00%
- Reading proficiency
- 39% ▼ -6.00%
- Median HH income
- $53,647
- Composite
- 26.9/100
- National rank
- #7087
- State rank
- #125 of 153 in CT
Livability — Torrington
- Score
- 76/100
- State rank
- #53
- US rank
- #3449
Category grades
Schools grade is shown separately in the Schools card above.
Census & demographics
- Census place
- Torrington, CT
- County
- Litchfield County · 81,203 people
- City population
- 35,566
- Metro
- Torrington, CT
- Population (ZIP)
- 35,566
- Household income
- $70,912
- Rent vs Own
- Severe rent burden
- 1401.0
Population outlook (Northwest Hills County) Hauer SSP2
- By 2040
- 118,998
Race, ethnicity, and origin ACS 2023
- Neighborhood character
- Predominantly White (73%)
- Race & ethnicity
- White 73% Hispanic / Latino 14% Two or more races 8% Black 6% Asian 3%
- Hispanic origin (detail)
- Puerto Rican 5% Dominican 2%
- Common ancestry
- Romanian 8% Lithuanian 5% Slovak 2%
- Foreign-born
- 12% · Canada, South Korea, Jamaica
- Languages at home
- 86% English-only · Spanish 8% Other Indo-European 2% Russian/Polish/Slavic 1%
Political lean MEDSL · Northwest Hills
- 2024 margin
- Toss-up / Even · D 48.6% · R 49.9% · Other 1.6%
- All cycles
- 2024: R+1.3
Not yet ingested
- Civics
- —
Market trends
- HPI YoY
- ▼ -122.78%
- Current HPI
- 208.4818
- Rent YoY
- ▲ 5.89%
- Metro
- Torrington, CT
- State GDP YoY
- ▲ 1.06%
- F500 in state
- 38
Industry mix (Fortune 500 HQ in CT)
| Industry | F500 HQs | Revenue |
|---|---|---|
| Industrial Machinery | 4 | $38B |
|
||
| Insurance | 3 | $71B |
|
||
| Financial Services | 2 | $25B |
|
||
| Transportation / Logistics | 2 | $18B |
|
||
| Healthcare | 1 | $247B |
|
||
| Telecommunications | 1 | $55B |
|
||
Price history
+90.0% since first listed6 events — show timeline
- 2026-05-17 Pending — Smart MLS
- 2026-05-11 Listed $149,900 Smart MLS
- 2017-01-27 Sold (MLS) $72,500 Smart MLS
- 2017-01-10 Listing Removed — Smart MLS
- 2016-07-27 Listed $74,900 Smart MLS
- 1987-10-30 Sold (Public Records) $78,900 Public Records
Property tax history
+0.1%/yrLatest (2023): $3,265 · +1.7% YoY. Source: county tax records.
Cash-flow waterfall
monthlySold comps — $/sqft
last 12 mo · ≤1 miLoading sold comps…