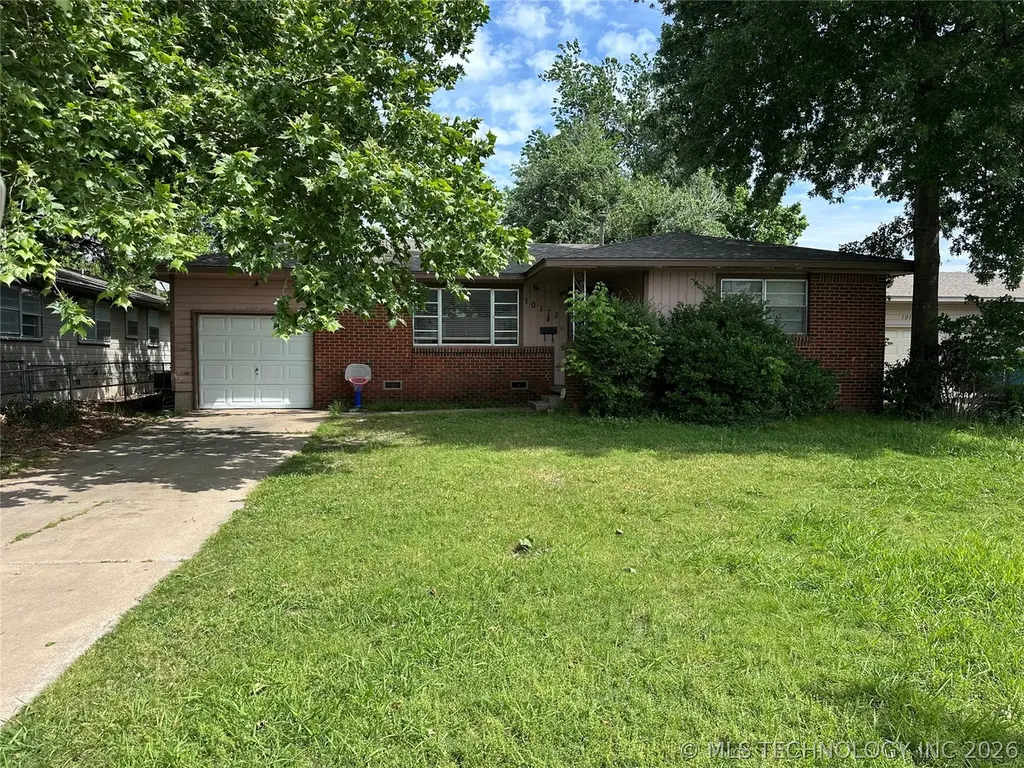
10173 E 4th Pl Pl · Tulsa, OK
Flood risk 1/10 · Minimal
- FEMA flood zone
- X (unshaded)
- Chance of flooding over 30 yrs
- 0.0%
- Est. flood insurance / yr
- $507 – $1,088
Fire risk 3/10 · Minor
- Est. fire insurance / yr
- $2,463 – $4,575
Heat risk 6/10 · Moderate
- Hot days now (above 111°F)
- 7 days/yr
- Hot days in 30 yrs
- 18 days/yr
Wind risk 2/10 · Minimal
- Chance of severe wind over 30 yrs
- 4.0%
Air-quality risk 3/10 · Minor
- Unhealthy air days now
- 2 days/yr
- Unhealthy air days in 30 yrs
- 3 days/yr
Risk factors via First Street. Map © Google.
Why this score? — see what drove the C grade
The composite is a weighted blend of 9 inputs, each scored 0–100. Each bar is that input's sub-score; the figure is the points it added to the 100-point composite (weight × sub-score).
- Cash flow +22.3/30.0
- ARV discount +10.8/15.0
- DSCR +7.1/10.0
- 1% rule +5.3/10.0
- Livability +3.8/5.0
- Rent growth +2.5/5.0
- Condition / age +2.5/5.0
- Schools +0.8/10.0
- Appreciation +0.0/10.0
$120,000
🖨 Deal sheet 📄 Offer letter ✓ Due diligence
Listing remarks MLS
GREAT STARTER HOME, OR INVESTMENT, 3 BR, 1 BTH, 1 CAR ATT BRICK/FRAME RANCH STYLE HOME, DECKED ATTIC STORAGE AREA, COVERED PATIO, CH LINK FENCE W/ DOG RUN, GARDEN AREA, CER TILE IN BATH. HDWD
Key facts
- 7,427 sq ft lot
- Garage
- Built 1959
Property features AI
Finance
- HOA & community: Sidewalks in the community
Exterior
- Parking: Attached garage with storage; 1 garage space
- Security: Smoke detectors; No safety shelter
- Utilities: Electricity available; Public water; Public sewer
- Home design: Single-story home; Faces south
- Construction: Brick and wood frame construction; Asphalt/fiberglass roof; Crawlspace foundation; Built per public records
- Exterior features: Covered patio and porch; Porch; Patio; Chain link fencing; Shed(s)
Interior
- Kitchen: Built-in oven; Cooktop; Oven; Range
- Bedrooms: Master bedroom on first floor; Additional bedrooms on first floor
- Flooring: Concrete floors; Laminate floors
- Bathrooms: 1 full bathroom
- Heating & cooling: Central air conditioning
- Interior features: Aluminum window frames; Laminate counters; Electric oven and range connections; Crawl space basement
- Laundry & utility: Electric dryer hookup; Gas dryer hookup; Gas water heater
Neighborhood map
What this means for you Summary
Snapshot
- This is a 3-bed/1.0-bath single-family listed at $120k.
Deal economics
- At list price, monthly cash flow is $198 ($2k/yr) — positive.
- The deal already cash-flows at list — no discount required.
- Meets the 1% rule at list price ($1k rent vs $120k).
- Recommended offer: $118k (1.5% below list) — sets the bar for market timing.
- Cap rate 8.3% vs local median 3.9% in Tulsa — top-decile yield for the area; either an underpriced asset or a hidden risk that comps aren't pricing in. Stress-test before assuming the spread holds.
Location & tenants
- Location reads 75/100 on livability (#13 in OK, #4,058 nationally) — a middle-class / working-renter tenant base. Strengths: amenities A+, commute A+, cost of living A+; Watch: schools F, crime F, employment D-.
- Tulsa (urban): math 7% / reading 12% proficiency, ranked #250 of 270 in OK (top 93%) — low school quality limits family demand, transient renter base, plan for 1-2y turnover; 76% free/reduced lunch — lower-income household profile, screen leases tightly.
- Market conditions: 38 active listings in the ZIP; 11 comparable units currently listed for rent nearby; rentals at typical pace (median 16d on market — plan ~3-4 weeks tenant-placement turnaround); 2,818 units permitted in Tulsa County in 2024 (518 in 5+ unit buildings).
Forward outlook
- Local home prices are declining (-3.0%/yr); year-one equity from $830 of loan paydown is wiped out by about $4k of value loss. Plan a longer hold.
- Tulsa County population projected at +30% by 2050 — long-run rental-demand tailwind backs the buy-and-hold thesis.
Negotiation context
- It's been on market 18 days — a 2% lower offer ($118k) is reasonable based on typical stale-listing flexibility.
- 2 sale attempts since 28y ago with the ask held roughly flat each time — persistent listings suggest the price (not the market) is what's stuck; bring a comps-based counter.
- Current owner paid $50k; list at $120k implies a 138% gain — meaningful room to come down on a strong offer.
Risks & watch-outs
- Watch-outs: built in 1959 — expect roof / HVAC / electrical / plumbing capex.
- Climate carrying-cost: extreme-heat days projected 7→18/yr by 2055 (HVAC capex compounding) — expect insurance premiums to compound above CPI over the hold.
Questions for the listing agent
- Built in 1959 — when were the roof, HVAC, electrical panel, plumbing, and water heater last replaced?
- Is there a deadline driving the sale (1031 exchange, divorce, estate, relocation)? That informs how much negotiation room exists.
- Schools are F-rated, which usually means shorter tenancies and higher turnover. Who's the typical renter profile here, and what's been the actual vacancy rate?
- Crime grade is F in this area — have there been break-ins, vandalism, or insurance claims at this property in the last 3 years? What carrier currently insures it and at what premium?
- What's the average days-on-market for RENTAL listings here right now (not sales)? A rising rental-DOM trend means longer vacancies and softer asking-rent achievability than the comps imply.
- What's the recent tenant-quality profile in this submarket — average credit score on applications, eviction rate, late-payment / NSF rate, and stable-employment percentage? A property-management company in the area should have these aggregated.
- How much new for-sale + rental construction is in the pipeline within 1–3 miles? Heavy new supply typically softens prices + rents 12–24 months out; constrained supply supports both.
Investment metrics
- 1% rule
- 1.03% ✓
- Cap rate
- 8.27%
- Cash-on-cash
- 7.08%
- DSCR
- 1.31
- GRM
- 8.1
CMA / ARV
- ARV (on-the-fly)
- $129,472
- Comps found
- 12
Show comp detail 12 sales within ~0.75 mi
| Address | Dist | Beds/Ba | Sqft | Sold | Price | $/sf | Match |
|---|---|---|---|---|---|---|---|
| 520 S 104th EastAvenue | 0.12mi | 3/1.0 | 971 (+2%) | 5mo | $122,000 | $126 | 87 |
| 10126 E 4th Pl | 0.11mi | 3/1.0 | 976 (+2%) | 8mo | $86,000 | $88 | 84 |
| 265 S 104th East EastAvenue | 0.07mi | 3/1.5 | 988 (+4%) | 13mo | $152,000 | $154 | 77 |
| 622 S 105th EastPlace | 0.28mi | 3/1.0 | 1,014 (+6%) | 4mo | $132,000 | $130 | 73 |
| 115 S 107th East Ave | 0.38mi | 3/1.0 | 1,005 (+6%) | 2mo | $105,000 | $104 | 72 |
| 9779 E 4th St | 0.16mi | 3/1.0 | 1,053 (+11%) | 8mo | $146,400 | $139 | 68 |
| 9740 E 3rd St | 0.25mi | 3/1.5 | 1,066 (+12%) | 4mo | $135,000 | $127 | 62 |
| 9129 E 3rd Pl | 0.63mi | 3/1.0 | 1,004 (+6%) | 4mo | $175,000 | $174 | 58 |
| 522 S 108th EastAvenue E | 0.37mi | 3/1.0 | 1,074 (+13%) | 5mo | $146,500 | $136 | 57 |
| 9749 E 3rd St S | 0.24mi | 3/1.0 | 1,056 (+11%) | 19mo | $164,500 | $156 | 54 |
| 320 S 97th Pl E | 0.31mi | 3/1.0 | 1,064 (+12%) | 15mo | $165,000 | $155 | 53 |
| 8947 E 3rd Pl | 0.73mi | 3/1.0 | 1,027 (+8%) | 20mo | $103,000 | $100 | 36 |
Match score weights: distance 35% · size 25% · config 20% · recency 20%. Top-matched comps best support the ARV.
Projected returns pro-forma
-3.0% appreciation · 3.0% rent growth · sell at horizon
- IRR
- -5.5%
- Equity multiple
- 0.80×
- Total profit
- $-6,836
- Equity at exit
- $17,892
- IRR
- 4.2%
- Equity multiple
- 1.30×
- Total profit
- $10,242
- Equity at exit
- $10,375
Cash invested: $33,600 (down + closing). Projections, not guarantees.
Landlord ↔ Tenant lean methodology
- Overall (STATE)
- 83 Strongly Landlord-Friendly
- State Oklahoma
- 83 Strongly Landlord-Friendly · R+20
- County
- — inherits STATE
- City
- — inherits STATE
ZIP-level market 74128
- Home prices YoY
- -21.6%
- Active inventory
- 38
- Price-to-rent
- 8.1×
Monthly cashflow live
- Estimated rent
- $1,232 high interval (Pro) →
- Mortgage (P&I)
- −$629
- Tax from tax record
- −$96 /mo · $1,148/yr
- Insurance
- −$50
- HOA
- −$0
- Vacancy / Maint / Mgmt
- −$259
- Net cashflow
- $198
Break-even live
UW: 25.0% down · 7.5% · 30yr · 1.5% tax · 5.0% vac · 8.0% maint · 8.0% mgmt
Financing live
Cash to close
- Down payment
- $30,000
- Closing costs
- $3,600
- Reserves months
- —
- Total cash needed
- —
Loan-product check · same deal, 3 products live
Conventional
25% down · 7.5% · 30yr
- Down + closing
- —
- Monthly P&I
- —
- Monthly cashflow
- —
- DSCR
- —
- Eligible?
- —
Personal DTI + credit; lowest rate.
DSCR
20% down · 8.5% · 30yr
- Down + closing
- —
- Monthly P&I
- —
- Monthly cashflow
- —
- DSCR
- —
- Eligible?
- —
No personal income docs; deal must DSCR.
Hard money
10% down · 12.0% · 12mo
- Down + closing
- —
- Monthly P&I
- —
- Monthly cashflow
- —
- DSCR
- —
- Eligible?
- —
Short-term bridge; refi at stabilization.
Rent comps 11 comps
| Address | Beds | Baths | Sqft | Rent | $/sqft | DOM | Units | Dist |
|---|---|---|---|---|---|---|---|---|
| 717 S 101st East Ave Tulsa, OK | 1.0–2.0 | 1.0 | 786 | $1,049 | $1.33 | 2d | 11 | 0.29mi |
| 444 S Mingo Rd Tulsa, OK | 3.0 | 1.0 | 800 | $1,200 | $1.50 | 16d | 5 | 0.39mi |
| 1018 S 107th East Ave Tulsa, OK | 1.0–2.0 | 1.0 | 807 | $925 | $1.15 | 23d | 6 | 0.49mi |
| 9743 E 12th St Tulsa, OK | 1.0–2.0 | 1.0–1.5 | 875 | $975 | $1.11 | 16d | 3 | 0.60mi |
| 11107 E Brady St Unit 132 Tulsa, OK | 2.0 | 1.0 | 964 | $995 | $1.03 | 23d | 1 | 0.85mi |
| 11107 E Brady St Unit 458 Tulsa, OK | 2.0 | 1.0 | 964 | $1,155 | $1.20 | 11d | 1 | 0.85mi |
| 11107 E Brady St Unit 211 Tulsa, OK | 2.0 | 1.0 | 964 | $1,155 | $1.20 | 23d | 1 | 0.85mi |
| 11107 E Brady St Unit 338 Tulsa, OK | 2.0 | 1.0 | 964 | $1,095 | $1.14 | 3d | 1 | 0.85mi |
| 1433 S 107th East Ave Tulsa, OK | 1.0–3.0 | 1.0–1.5 | 840 | $1,199 | $1.43 | 19d | 3 | 0.91mi |
| 1645 S 101st East Ave Tulsa, OK | 1.0–3.0 | 1.0–2.0 | 1013 | $1,899 | $1.87 | 2d | 35 | 1.07mi |
| 1448 S 108th East Pl Tulsa, OK | 2.0 | 1.0 | 982 | $1,350 | $1.37 | 16d | 1 | 1.09mi |
Listing history 5 events
-
2026-05-06$120,000 Active
-
1999-02-03soldstatus $50,500
-
1999-01-29soldstatus $50,500 191-char remark
Show marketing remark (191 chars)
GREAT STARTER HOME, OR INVESTMENT, 3 BR, 1 BTH, 1 CAR ATT BRICK/FRAME RANCH STYLE HOME, DECKED ATTIC STORAGE AREA, COVERED PATIO, CH LINK FENCE W/ DOG RUN, GARDEN AREA, CER TILE IN BATH. HDWD
-
1998-12-07historical 191-char remark
Show marketing remark (191 chars)
GREAT STARTER HOME, OR INVESTMENT, 3 BR, 1 BTH, 1 CAR ATT BRICK/FRAME RANCH STYLE HOME, DECKED ATTIC STORAGE AREA, COVERED PATIO, CH LINK FENCE W/ DOG RUN, GARDEN AREA, CER TILE IN BATH. HDWD
-
1998-11-10$59,900 191-char remark
Show marketing remark (191 chars)
GREAT STARTER HOME, OR INVESTMENT, 3 BR, 1 BTH, 1 CAR ATT BRICK/FRAME RANCH STYLE HOME, DECKED ATTIC STORAGE AREA, COVERED PATIO, CH LINK FENCE W/ DOG RUN, GARDEN AREA, CER TILE IN BATH. HDWD
ⓘ Source: listings_history table (triggers on properties + properties_extension) + one-shot
backfill from property_details.listing_events for pre-trigger history.
Tax reassessment forecast OK · Resets to sale price
- Current annual tax
- $1,148 · $96/mo
- Projected year-2 tax
- $1,148 · $96/mo
- Expected delta
- $0/yr ($0/mo · 0.0%)
ⓘ Screening estimate from a state-policy table — verify with the county assessor before closing.
Climate risk First Street
- Flood 1/10 Low FEMA zone X (unshaded) · 0% chance over 30 yrs
- Wildfire 3/10 Moderate
- Heat 6/10 Major 7 d/yr ≥111°F today · 18 d/yr by 30 yrs out
- Wind 2/10 Low 4% chance of damaging wind over 30 yrs
- Air quality 3/10 Moderate 2 unhealthy d/yr today · 3 by 30 yrs out
Nearby sold comps map
Loading sold comps map…
Walkable amenities ~0.75 mi
Loading nearby amenities…
Taxation est. · year 1
- Rental income
- $14,782
- − Mortgage interest
- −$6,722
- − Property taxes
- −$1,148
- − Insurance
- −$600
- − Repairs & maintenance
- −$1,183
- − Management
- −$1,183
- − Depreciation
- −$3,491
- Taxable income
- $456
- Est. tax owed @ 24.0%
- −$110
- After-tax cash flow
- $2,269/yr
For passive investors: Depreciation is non-cash, so a rental often shows a tax loss while cash-flowing — sheltering income. Rental losses are passive: they offset passive income freely, and up to $25,000/yr can offset ordinary (W-2) income if you actively participate and your MAGI is under $100k (phasing out to $0 by $150k); unused losses carry forward. On sale, claimed depreciation is recaptured at up to 25%, and gains may owe capital-gains tax (a 1031 exchange can defer both). Figures are a year-1 estimate at your 24.0% rate — not tax advice; consult a CPA.
Schools (NCES district)
- District
- Tulsa
- NCES district ID
- 4030240
- Math proficiency
- 7% ▼ -9.00%
- Reading proficiency
- 12% ▼ -7.00%
- Median HH income
- $37,895
- Composite
- 8.04/100
- National rank
- #9919
- State rank
- #250 of 270 in OK
Livability — Tulsa
- Score
- 75/100
- State rank
- #13
- US rank
- #4058
Category grades
Schools grade is shown separately in the Schools card above.
Census & demographics
- Census place
- Tulsa, OK
- County
- Tulsa County · 640,811 people
- City population
- 389,418
- Metro
- Tulsa, OK
- Population (ZIP)
- 13,751
- Household income
- $52,195
- Rent vs Own
- Severe rent burden
- 382.0
Population outlook (Tulsa County) Hauer SSP2
- Today (2025)
- 723,846 people
- By 2030
- 766,033 · +5.8%
- By 2040
- 851,386 · +17.6%
- By 2050
- 938,389 · +29.6%
- By 2075
- 1,166,011 · +61.1%
- By 2100
- 1,350,277 · +86.5%
Race, ethnicity, and origin ACS 2023
- Neighborhood character
- Diverse neighborhood (Simpson 0.69)
- Race & ethnicity
- Hispanic / Latino 39% White 38% Two or more races 23% Black 10% Asian 4% Native American 4%
- Hispanic origin (detail)
- Mexican 32%
- Common ancestry
- Italian 1% Slovak 1% Romanian 1%
- Foreign-born
- 19% · Canada
- Languages at home
- 59% English-only · Spanish 36% Other Asian/Pacific 2% Other Indo-European 1%
Political lean MEDSL · Tulsa
- 2024 margin
- R (+15.2) · D 41.3% · R 56.5% · Other 2.2%
- 2008→2024 swing
- +9.2pp toward D · 2008: -24.5pp · 2024: -15.2pp
- All cycles
- 2024: R+15.2 2020: R+15.6 2016: R+22.9 2012: R+27.4 2008: R+24.5
Not yet ingested
- Civics
- —
Market trends
- HPI YoY
- ▼ -66.16%
- Current HPI
- 240.6763
- Rent YoY
- —
- Metro
- Tulsa, OK
- State GDP YoY
- ▲ 1.55%
- F500 in state
- 6
Industry mix (Fortune 500 HQ in OK)
| Industry | F500 HQs | Revenue |
|---|---|---|
| Energy | 3 | $48B |
|
||
Price history
+100.3% since first listed5 events — show timeline
- 2026-05-06 Listed $120,000 MLS Technology, Inc.
- 1999-02-03 Sold (Public Records) $50,500 Public Records
- 1999-01-29 Sold (MLS) $50,500 MLS Technology, Inc.
- 1998-12-07 Listing Removed — MLS Technology, Inc.
- 1998-11-10 Listed $59,900 MLS Technology, Inc.
Property tax history
+2.3%/yrLatest (2025): $1,148 · +8.7% YoY. Source: county tax records.
Cash-flow waterfall
monthlySold comps — $/sqft
last 12 mo · ≤1 miLoading sold comps…