 🏷️ Likely Rental
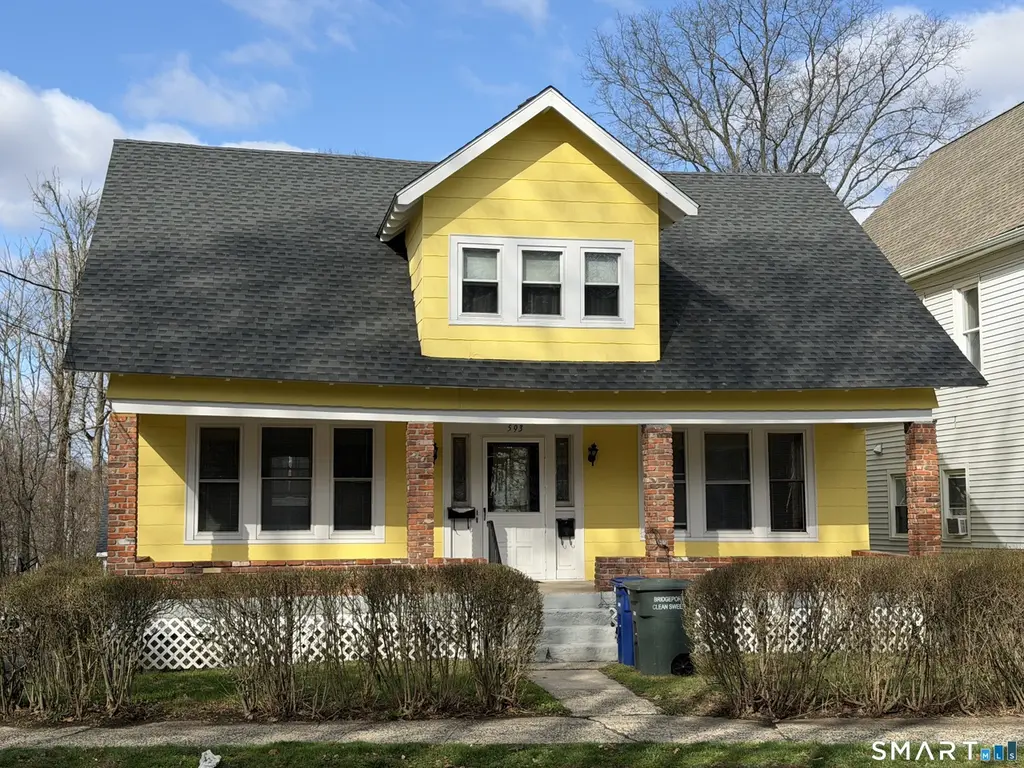
593 Wayne St · Bridgeport, CT
Flood risk 1/10 · Minimal
- FEMA flood zone
- X (unshaded)
- Chance of flooding over 30 yrs
- 0.0%
- Est. flood insurance / yr
- $473 – $860
Fire risk 1/10 · Minimal
- Est. fire insurance / yr
- $829 – $1,539
Heat risk 6/10 · Moderate
- Hot days now (above 97°F)
- 7 days/yr
- Hot days in 30 yrs
- 15 days/yr
Wind risk 6/10 · Moderate
- Chance of severe wind over 30 yrs
- 41.0%
Air-quality risk 4/10 · Minor
- Unhealthy air days now
- 5 days/yr
- Unhealthy air days in 30 yrs
- 7 days/yr
Risk factors via First Street. Map © Google.
Why this score? — see what drove the C+ grade
The composite is a weighted blend of 9 inputs, each scored 0–100. Each bar is that input's sub-score; the figure is the points it added to the 100-point composite (weight × sub-score).
- Cash flow +22.1/30.0
- ARV discount +15.0/15.0
- DSCR +7.1/10.0
- 1% rule +5.9/10.0
- Livability +4.0/5.0
- Rent growth +3.3/5.0
- Condition / age +2.5/5.0
- Schools +1.2/10.0
- Appreciation +0.0/10.0
$399,900
🖨 Deal sheet 📄 Offer letter ✓ Due diligence
Multi-family units
County records classify this as Multi-Family (2-4 Unit). Listing-text estimate: 2 units. confirmed
Listing remarks
Multi-Family Opportunity in Bridgeport! 2-family property offering a total of 4 bedrooms and 2 full bathrooms. This property features a newer asphalt roof (approximately 3 years old). The second-floor unit is currently tenant-occupied at $700/month, offering immediate rental income potential. The first-floor unit provides flexibility for owner-occupancy or additional rental income. Conveniently located near local amenities, shopping, dining, and major transportation routes. Whether you're looking to invest or occupy, this property presents a solid opportunity with income-generating potential. Shared driveway.
Key facts
- 0.34 acre lot
- 2 garage spots
- Built 1914
Neighborhood map
What this means for you Summary
Snapshot
- This is a 2 × 2-bed/1.0-bath units multifamily listed at $400k.
Deal economics
- At list price, monthly cash flow is $646 ($8k/yr) — positive. Per door: $323/mo.
- The deal already cash-flows at list — no discount required.
- Meets the 1% rule at list price ($4k rent vs $400k).
- Cap rate 8.2% vs local median 5.0% in Bridgeport — top-decile yield for the area; either an underpriced asset or a hidden risk that comps aren't pricing in. Stress-test before assuming the spread holds.
Location & tenants
- Location reads 81/100 on livability (#15 in CT, #1,374 nationally) — a professional / high-income tenant draw. Strengths: amenities A+, commute A+, health & safety A+; Watch: crime C-, employment D+, schools D-.
- Bridgeport School District (urban): math 9% / reading 19% proficiency, ranked #151 of 153 in CT (top 99%) — low school quality limits family demand, transient renter base, plan for 1-2y turnover; 97% free/reduced lunch — lower-income household profile, screen leases tightly.
- Market conditions: Rents rising (+3.1%/yr); 152 active listings in the ZIP; 40 comparable units currently listed for rent nearby; rentals lingering (median 44d on market — plan ~5-8 weeks vacancy on turnover, expect pricing pressure); 50% of comp listings sitting > 30 days — soft ceiling on asking rent; 852 units permitted in Greater Bridgeport Planning Region in 2024 (698 in 5+ unit buildings).
- At $4,345/mo this rent would consume 71% of the median local household income ($73k/yr) (locally 2163% of renters already pay >50% of income on rent) — very limited rent-growth headroom before tenants either downsize or default.
Forward outlook
- Local home prices are declining (-3.0%/yr); year-one equity from $3k of loan paydown is wiped out by about $12k of value loss. Plan a longer hold.
Negotiation context
- Only 6 days on market — expect competitive offers; lowballing is unlikely to land.
Risks & watch-outs
- Watch-outs: built in 1914 — expect roof / HVAC / electrical / plumbing capex.
- Climate carrying-cost: major wind risk, 41% chance of damaging wind over 30y; extreme-heat days projected 7→15/yr by 2055 (HVAC capex compounding) — expect insurance premiums to compound above CPI over the hold.
Questions for the listing agent
- Can we see the unit-by-unit rent roll, current vacancy, and any below-market leases? What's the average tenancy length?
- What capital expenditures (roof, boiler, parking lot, exteriors) have been made in the last 5 years, and what's planned in the next 2?
- Built in 1914 — when were the roof, HVAC, electrical panel, plumbing, and water heater last replaced?
- Is there a deadline driving the sale (1031 exchange, divorce, estate, relocation)? That informs how much negotiation room exists.
- Schools are D-rated, which usually means shorter tenancies and higher turnover. Who's the typical renter profile here, and what's been the actual vacancy rate?
- What's the average days-on-market for RENTAL listings here right now (not sales)? A rising rental-DOM trend means longer vacancies and softer asking-rent achievability than the comps imply.
- What's the recent tenant-quality profile in this submarket — average credit score on applications, eviction rate, late-payment / NSF rate, and stable-employment percentage? A property-management company in the area should have these aggregated.
- How much new apartment / multifamily construction is in the pipeline within 1–3 miles? Heavy new supply (>2% of stock underway) typically softens rents 12–24 months out; light construction supports rent growth.
Investment metrics
- 1% rule
- 1.09% ✓
- Cap rate
- 8.23%
- Cash-on-cash
- 6.92%
- DSCR
- 1.31
- GRM
- 7.7
CMA / ARV
- ARV (on-the-fly)
- $507,360
- Comps found
- 2
Show comp detail 2 sales within ~0.75 mi
| Address | Dist | Beds/Ba | Sqft | Sold | Price | $/sf | Match |
|---|---|---|---|---|---|---|---|
| 157 Madison Ter | 0.68mi | 4/2.0 | 1,854 (+2%) | 10mo | $520,000 | $280 | 56 |
| 214 Ruth St | 0.42mi | 4/2.0 | 1,968 (+9%) | 22mo | $495,000 | $252 | 48 |
Match score weights: distance 35% · size 25% · config 20% · recency 20%. Top-matched comps best support the ARV.
Projected returns pro-forma
-3.0% appreciation · 3.12% rent growth · sell at horizon
- IRR
- -5.5%
- Equity multiple
- 0.79×
- Total profit
- $-23,080
- Equity at exit
- $59,626
- IRR
- 4.3%
- Equity multiple
- 1.32×
- Total profit
- $35,331
- Equity at exit
- $34,576
Cash invested: $111,972 (down + closing). Projections, not guarantees.
Landlord ↔ Tenant lean methodology
- Overall (STATE)
- 27 Tenant-Leaning
- State Connecticut
- 27 Tenant-Leaning · D+7
- County
- — inherits STATE
- City
- — inherits STATE
ZIP-level market 06606
- Rents YoY
- 3.1%
- Active inventory
- 152
- Price-to-rent
- 15.3×
Monthly cashflow live
- Estimated rent
- $4,345 high interval (Pro) →
- Mortgage (P&I)
- −$2,097
- Tax from tax record
- −$523 /mo · $6,279/yr
- Insurance
- −$167
- HOA
- −$0
- Vacancy / Maint / Mgmt
- −$912
- Net cashflow
- $646
Break-even live
2-unit breakdown (identical units grouped — click to expand)
| Units | Beds | Baths | Est. rent |
|---|---|---|---|
| 2× units | 2 | 1 | $4,346 |
| #1 | 2 | 1 | $2,173 |
| #2 | 2 | 1 | $2,173 |
| Total (2 units) | $4,345 | ||
UW: 25.0% down · 7.5% · 30yr · 1.5% tax · 5.0% vac · 8.0% maint · 8.0% mgmt
Financing live
Cash to close
- Down payment
- $99,975
- Closing costs
- $11,997
- Reserves months
- —
- Total cash needed
- —
Loan-product check · same deal, 3 products live
Conventional
25% down · 7.5% · 30yr
- Down + closing
- —
- Monthly P&I
- —
- Monthly cashflow
- —
- DSCR
- —
- Eligible?
- —
Personal DTI + credit; lowest rate.
DSCR
20% down · 8.5% · 30yr
- Down + closing
- —
- Monthly P&I
- —
- Monthly cashflow
- —
- DSCR
- —
- Eligible?
- —
No personal income docs; deal must DSCR.
Hard money
10% down · 12.0% · 12mo
- Down + closing
- —
- Monthly P&I
- —
- Monthly cashflow
- —
- DSCR
- —
- Eligible?
- —
Short-term bridge; refi at stabilization.
Rent comps 40 comps
| Address | Beds | Baths | Sqft | Rent | $/sqft | DOM | Units | Dist |
|---|---|---|---|---|---|---|---|---|
| 415 Savoy St Bridgeport, CT | 3.0 | 3.0 | 1850 | $3,500 | $1.89 | 43d | 1 | 0.19mi |
| 68-70 Westfield Ave Bridgeport, CT | 4.0 | 2.0 | 1470 | $3,200 | $2.18 | 14d | 1 | 0.20mi |
| 457 Summit St Bridgeport, CT | 3.0 | 1.5 | 1511 | $4,000 | $2.65 | 43d | 1 | 0.33mi |
| 123 Harmony St Bridgeport, CT | 3.0 | 1.0 | 2000 | $2,500 | $1.25 | 43d | 1 | 0.38mi |
| 57 Robin St Unit 57 Bridgeport, CT | 3.0 | 1.0 | 1900 | $2,400 | $1.26 | 23d | 1 | 0.46mi |
| 318 Valley Ave Bridgeport, CT | 4.0 | 2.0 | 1718 | $3,250 | $1.89 | 23d | 1 | 0.55mi |
| 340 Pleasantview Ave Unit 2nd/3rd floors Bridgeport, CT | 4.0 | 2.0 | 1728 | $3,000 | $1.74 | 43d | 1 | 0.57mi |
| 127 Englewood Ave Bridgeport, CT | 3.0 | 2.0 | 1530 | $3,800 | $2.48 | 43d | 1 | 0.58mi |
| 120 Englewood Ave Bridgeport, CT | 4.0 | 2.0 | 1675 | $3,650 | $2.18 | 3d | 1 | 0.61mi |
| 927 Birmingham St Bridgeport, CT | 4.0 | 2.0 | 1362 | $3,800 | $2.79 | 2d | 1 | 0.63mi |
| 14 Infield St Bridgeport, CT | 3.0 | 2.5 | 1344 | $3,200 | $2.38 | 43d | 1 | 0.64mi |
| 180 Pleasantview Ave Bridgeport, CT | 3.0 | 2.0 | 1373 | $3,700 | $2.69 | 43d | 1 | 0.66mi |
| 125 High Ridge Dr Bridgeport, CT | 4.0 | 1.5 | 2160 | $3,400 | $1.57 | 2d | 1 | 0.69mi |
| 574 Chopsey Hill Rd Unit A Bridgeport, CT | 3.0 | 2.0 | 2304 | $2,800 | $1.22 | 14d | 1 | 0.72mi |
| 666 Capitol Ave Unit 2 Bridgeport, CT | 3.0 | 1.0 | 1247 | $2,400 | $1.92 | 43d | 1 | 0.74mi |
| 15 Overland Ave Bridgeport, CT | 3.0 | 2.5 | 1713 | $4,700 | $2.74 | 43d | 1 | 0.76mi |
| 235 High Ridge Dr Bridgeport, CT | 3.0 | 2.5 | 1333 | $3,000 | $2.25 | 43d | 1 | 0.78mi |
| 95 Marcel St Bridgeport, CT | 5.0 | 2.0 | 1404 | $4,000 | $2.85 | 43d | 1 | 0.82mi |
| 2395 Main St Unit Second Floor Bridgeport, CT | 3.0 | 1.0 | 1262 | $2,400 | $1.90 | 43d | 1 | 0.85mi |
| 2395 Main St Unit First Floor Bridgeport, CT | 3.0 | 1.0 | 1262 | $2,300 | $1.82 | 11d | 1 | 0.85mi |
| 51 Indian Ave Unit 1546115P Bridgeport, CT | 3.0 | 1.0 | 1388 | $3,871 | $2.79 | 11d | 1 | 0.87mi |
| 69 Platt Pl Bridgeport, CT | 3.0 | 3.5 | 2376 | $4,400 | $1.85 | 2d | 1 | 0.88mi |
| 145 Rooster River Blvd Bridgeport, CT | 5.0 | 2.0 | 1452 | $3,800 | $2.62 | 2d | 1 | 0.89mi |
| 111 Vanguard St Bridgeport, CT | 5.0 | 3.5 | 1868 | $4,800 | $2.57 | 3d | 1 | 0.91mi |
| 110 Grenelle St Bridgeport, CT | 3.0 | 1.0 | 1351 | $4,000 | $2.96 | 3d | 1 | 0.92mi |
| 95 Parrott Ave Bridgeport, CT | 4.0 | 1.0 | 1782 | $3,450 | $1.94 | 23d | 1 | 0.96mi |
| 1079 Brooklawn Ave Fairfield, CT | 3.0 | 1.5 | 1296 | $3,550 | $2.74 | 3d | 1 | 1.01mi |
| 192 Frenchtown Rd Bridgeport, CT | 3.0 | 3.5 | 1744 | $4,200 | $2.41 | 43d | 1 | 1.03mi |
| 2445 Park Ave #10 Bridgeport, CT | 3.0 | 2.5 | 2043 | $3,650 | $1.79 | 10d | 1 | 1.03mi |
| 130 Deramo Pl Bridgeport, CT | 3.0 | 1.5 | 1252 | $3,700 | $2.96 | 2d | 1 | 1.05mi |
| 52-54 Ives Ct Bridgeport, CT | 4.0 | 1.0 | 2092 | $2,750 | $1.31 | 43d | 1 | 1.15mi |
| 139 Little Deer Rd Bridgeport, CT | 4.0 | 2.0 | 1420 | $3,600 | $2.54 | 43d | 1 | 1.20mi |
| 70 Hawthorne St Bridgeport, CT | 3.0 | 1.5 | 2376 | $3,500 | $1.47 | 43d | 1 | 1.24mi |
| 1254 Reservoir Ave Bridgeport, CT | 3.0 | 1.0 | 2576 | $2,500 | $0.97 | 43d | 1 | 1.28mi |
| 306 Madison Ave Bridgeport, CT | 3.0 | 1.0 | 1300 | $2,500 | $1.92 | 43d | 1 | 1.34mi |
| 111 Arcadia Ave Bridgeport, CT | 4.0 | 1.5 | 2010 | $4,000 | $1.99 | 2d | 1 | 1.36mi |
| 95 Balsam Ave Unit 2 Bridgeport, CT | 4.0 | 1.0 | 2432 | $2,700 | $1.11 | 43d | 1 | 1.46mi |
| 96 Balsam Ave Unit 2 Bridgeport, CT | 3.0 | 1.0 | 1792 | $2,400 | $1.34 | 43d | 1 | 1.48mi |
| 25 Quinsey Dr Bridgeport, CT | 5.0 | 2.0 | 2081 | $4,375 | $2.10 | 2d | 1 | 1.48mi |
| 1223 Stratfield Rd #1223 Fairfield, CT | 3.0 | 2.0 | 1670 | $3,850 | $2.31 | 14d | 1 | 1.48mi |
Listing history 3 events
-
2026-04-14status Under Contract
-
2026-04-08$399,900 Active
-
2026-04-07historical $399,900
ⓘ Source: listings_history table (triggers on properties + properties_extension) + one-shot
backfill from property_details.listing_events for pre-trigger history.
Tax reassessment forecast CT · Partial reset (capped growth)
- Current annual tax
- $6,279 · $523/mo
- Projected year-2 tax
- $7,418 · $618/mo
- Expected delta
- +$1,139/yr (+$95/mo · 18.1%)
ⓘ Screening estimate from a state-policy table — verify with the county assessor before closing.
Climate risk First Street
- Flood 1/10 Low FEMA zone X (unshaded) · 0% chance over 30 yrs
- Wildfire 1/10 Low
- Heat 6/10 Major 7 d/yr ≥97°F today · 15 d/yr by 30 yrs out
- Wind 6/10 Major 41% chance of damaging wind over 30 yrs
- Air quality 4/10 Moderate 5 unhealthy d/yr today · 7 by 30 yrs out
Nearby sold comps map
Loading sold comps map…
Walkable amenities ~0.75 mi
Loading nearby amenities…
Taxation est. · year 1
- Rental income
- $52,140
- − Mortgage interest
- −$22,401
- − Property taxes
- −$6,279
- − Insurance
- −$2,000
- − Repairs & maintenance
- −$4,171
- − Management
- −$4,171
- − Depreciation
- −$11,633
- Taxable income
- $1,485
- Est. tax owed @ 24.0%
- −$356
- After-tax cash flow
- $7,390/yr
For passive investors: Depreciation is non-cash, so a rental often shows a tax loss while cash-flowing — sheltering income. Rental losses are passive: they offset passive income freely, and up to $25,000/yr can offset ordinary (W-2) income if you actively participate and your MAGI is under $100k (phasing out to $0 by $150k); unused losses carry forward. On sale, claimed depreciation is recaptured at up to 25%, and gains may owe capital-gains tax (a 1031 exchange can defer both). Figures are a year-1 estimate at your 24.0% rate — not tax advice; consult a CPA.
Schools (NCES district)
- District
- Bridgeport School District
- NCES district ID
- 0900450
- Math proficiency
- 9% ▼ -7.00%
- Reading proficiency
- 19% ▼ -10.00%
- Median HH income
- $41,507
- Composite
- 12.09/100
- National rank
- #9656
- State rank
- #151 of 153 in CT
Livability — Bridgeport
- Score
- 81/100
- State rank
- #15
- US rank
- #1374
Category grades
Schools grade is shown separately in the Schools card above.
Census & demographics
- Census place
- Bridgeport, CT
- County
- Fairfield County · 765,532 people
- City population
- 149,153
- Metro
- Bridgeport-Stamford-Norwalk, CT
- Population (ZIP)
- 49,308
- Household income
- $73,372
- Rent vs Own
- Severe rent burden
- 2163.0
Population outlook (Greater Bridgeport County) Hauer SSP2
- By 2040
- 365,581
Race, ethnicity, and origin ACS 2023
- Neighborhood character
- Highly diverse neighborhood (Simpson 0.73)
- Race & ethnicity
- Hispanic / Latino 37% White 31% Black 19% Two or more races 11% Asian 7%
- Hispanic origin (detail)
- Mexican 5% Puerto Rican 12% Dominican 4%
- Common ancestry
- Estonian 5% Russian 4% Romanian 3%
- Foreign-born
- 37% · Canada, Jamaica, Vietnam
- Languages at home
- 50% English-only · Spanish 27% Other Indo-European 15% French/Haitian/Cajun 2%
Political lean MEDSL · Greater Bridgeport
- 2024 margin
- Strong D (+23.3) · D 60.9% · R 37.6% · Other 1.5%
- All cycles
- 2024: D+23.3
Not yet ingested
- Civics
- —
Market trends
- HPI YoY
- ▼ -270.11%
- Current HPI
- 345.647
- Rent YoY
- ▲ 3.12%
- Metro
- Bridgeport-Stamford-Norwalk, CT
- State GDP YoY
- ▲ 1.06%
- F500 in state
- 38
Industry mix (Fortune 500 HQ in CT)
| Industry | F500 HQs | Revenue |
|---|---|---|
| Industrial Machinery | 4 | $38B |
|
||
| Insurance | 3 | $71B |
|
||
| Financial Services | 2 | $25B |
|
||
| Transportation / Logistics | 2 | $18B |
|
||
| Healthcare | 1 | $247B |
|
||
| Telecommunications | 1 | $55B |
|
||
Price history
+0.0% since first listed3 events — show timeline
- 2026-04-14 Pending — Smart MLS
- 2026-04-08 Listed $399,900 Smart MLS
- 2026-04-07 Coming Soon $399,900 Smart MLS
Property tax history
-0.8%/yrLatest (2023): $6,279 · +0.0% YoY. Source: county tax records.
Cash-flow waterfall
monthlySold comps — $/sqft
last 12 mo · ≤1 miLoading sold comps…