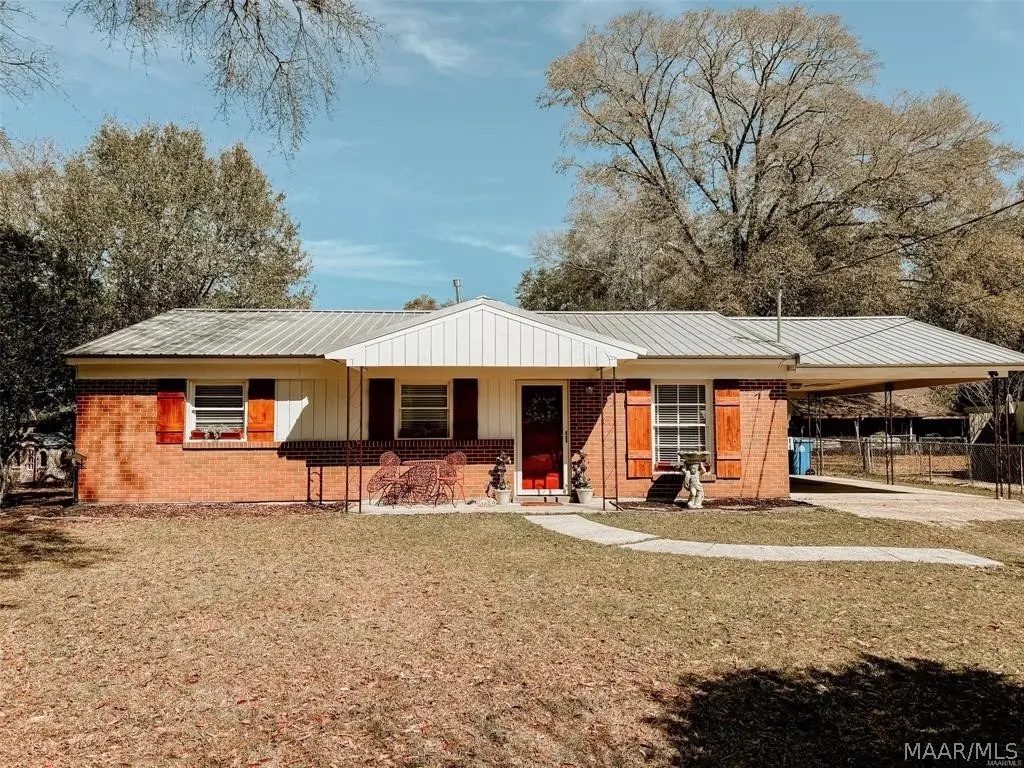
109 Linda Ln · Prattville, AL
Flood risk 5/10 · Moderate
- FEMA flood zone
- X (shaded)
- Chance of flooding over 30 yrs
- 0.24%
- Est. flood insurance / yr
- $507 – $1,088
Fire risk 4/10 · Minor
- Est. fire insurance / yr
- $916 – $1,700
Heat risk 7/10 · Major
- Hot days now (above 107°F)
- 7 days/yr
- Hot days in 30 yrs
- 20 days/yr
Wind risk 8/10 · Major
- Chance of severe wind over 30 yrs
- 80.0%
Air-quality risk 3/10 · Minor
- Unhealthy air days now
- 3 days/yr
- Unhealthy air days in 30 yrs
- 3 days/yr
Risk factors via First Street. Map © Google.
Why this score? — see what drove the B grade
The composite is a weighted blend of 9 inputs, each scored 0–100. Each bar is that input's sub-score; the figure is the points it added to the 100-point composite (weight × sub-score).
- Cash flow +30.0/30.0
- 1% rule +10.0/10.0
- DSCR +10.0/10.0
- ARV discount +7.5/15.0
- Rent growth +3.9/5.0
- Livability +3.8/5.0
- Schools +3.2/10.0
- Condition / age +2.5/5.0
- Appreciation +0.0/10.0
$155,000
🖨 Deal sheet 📄 Offer letter ✓ Due diligence
Listing remarks MLS
This house is conveniently located minutes from shopping, restaurants, doctors offices, and entertainment. It's perfect for someone wanting to downsize and enjoy the simple things in life. It has a fenced in backyard with a covered patio for morning coffee lovers or afternoon grillers. The house is so very quaint and has utilized all the space very well. The clawfoot tub in the front bathroom is great for relaxing after a long day at work. It also has a stand up shower in the 2nd bathroom for those that prefer hot showers. New stained shutters. painted window boxes, and front of home has fresh paint.
Key facts
- Covered patio
- 0.24 acre lot
- Parking
Tags
Property features AI
Finance
- Financial info: Annual taxes listed
Exterior
- Parking: Attached carport; 1 carport space
- Utilities: Public water; Public sewer; Electricity available; Natural gas available; Cable available; High-speed internet available
- Home design: Single-story; Slab foundation
- Construction: Brick and wood siding construction; Built (year per public records)
- Exterior features: Covered patio; Covered porch/patio; Fully fenced yard; City lot
Interior
- Flooring: Carpet; Plank; Vinyl
- Bathrooms: 2 full bathrooms
- Heating & cooling: Central electric heating; Central electric cooling (Central Air)
- Interior features: Carpet, plank, and vinyl flooring
- Laundry & utility: Gas water heater
Neighborhood map
What this means for you Summary
Snapshot
- This is a 3-bed/1.0-bath single-family listed at $155k.
Deal economics
- At list price, monthly cash flow is $909 ($11k/yr) — positive.
- The deal already cash-flows at list — no discount required.
- Meets the 1% rule at list price ($2k rent vs $155k).
- Recommended offer: $153k (1.5% below list) — sets the bar for market timing.
- Cap rate 13.3% vs local median 4.2% in Prattville — top-decile yield for the area; either an underpriced asset or a hidden risk that comps aren't pricing in. Stress-test before assuming the spread holds.
Location & tenants
- Location reads 76/100 on livability (#11 in AL, #3,273 nationally) — a middle-class / working-renter tenant base. Strengths: cost of living A+, housing A+, employment B+; Watch: amenities D, commute F.
- Autauga County (rural): math 23% / reading 50% proficiency, ranked #34 of 129 in AL (top 26%) — families likely to look elsewhere, expect single-tenant / working-renter base with shorter leases.
- Market conditions: Rents rising fast (+5.8%/yr); 131 active listings in the ZIP; 2 comparable units currently listed for rent nearby; 221 units permitted in Autauga County in 2024 (0 in 5+ unit buildings).
- This rent runs 43% of the median local income ($66k/yr) — at the standard rent-burdened threshold; future hikes will face affordability resistance.
Forward outlook
- Local home prices are declining (-3.0%/yr); year-one equity from $1k of loan paydown is wiped out by about $5k of value loss. Plan a longer hold.
- Autauga County population projected to shrink 5% by 2050 — rents likely to lag national; underwrite the cash flow, not the appreciation.
- At projected returns (-3.0% appreciation + 5.8% rent growth), your $43k cash investment doubles in ~5 years — after that, you're playing with house money.
Negotiation context
- It's been on market 17 days — a 2% lower offer ($153k) is reasonable based on typical stale-listing flexibility.
- 6 sale attempts since 27y ago with the ask held roughly flat each time — persistent listings suggest the price (not the market) is what's stuck; bring a comps-based counter.
Risks & watch-outs
- Climate carrying-cost: moderate flood risk; severe wind risk, 80% chance of damaging wind over 30y; extreme-heat days projected 7→20/yr by 2055 (HVAC capex compounding) — expect insurance premiums to compound above CPI over the hold.
Questions for the listing agent
- Built in 1962 — when were the roof, HVAC, electrical panel, plumbing, and water heater last replaced?
- Is there a deadline driving the sale (1031 exchange, divorce, estate, relocation)? That informs how much negotiation room exists.
- Schools are B-rated — typically a magnet for longer-tenancy family renters. What's the average tenant stay here, and is there a school-zone premium baked into asking?
- What's the average days-on-market for RENTAL listings here right now (not sales)? A rising rental-DOM trend means longer vacancies and softer asking-rent achievability than the comps imply.
- What's the recent tenant-quality profile in this submarket — average credit score on applications, eviction rate, late-payment / NSF rate, and stable-employment percentage? A property-management company in the area should have these aggregated.
- How much new for-sale + rental construction is in the pipeline within 1–3 miles? Heavy new supply typically softens prices + rents 12–24 months out; constrained supply supports both.
Investment metrics
- 1% rule
- 1.52% ✓
- Cap rate
- 13.33%
- Cash-on-cash
- 25.14%
- DSCR
- 2.12
- GRM
- 5.5
CMA / ARV
No comps found within radius.
Projected returns pro-forma
-3.0% appreciation · 5.78% rent growth · sell at horizon
- IRR
- 21.5%
- Equity multiple
- 1.91×
- Total profit
- $39,514
- Equity at exit
- $23,111
- IRR
- 31.3%
- Equity multiple
- 4.18×
- Total profit
- $138,160
- Equity at exit
- $13,402
Cash invested: $43,400 (down + closing). Projections, not guarantees.
Landlord ↔ Tenant lean methodology
- Overall (STATE)
- 90 Strongly Landlord-Friendly
- State Alabama
- 90 Strongly Landlord-Friendly · R+15
- County
- — inherits STATE
- City
- — inherits STATE
ZIP-level market 36067
- Home prices YoY
- -12.4%
- Rents YoY
- 5.8%
- Active inventory
- 131
- Price-to-rent
- 5.5×
Monthly cashflow live
- Estimated rent
- $2,349 medium interval (Pro) →
- Mortgage (P&I)
- −$813
- Tax from tax record
- −$69 /mo · $829/yr
- Insurance
- −$65
- HOA
- −$0
- Vacancy / Maint / Mgmt
- −$493
- Net cashflow
- $909
Break-even live
UW: 25.0% down · 7.5% · 30yr · 1.5% tax · 5.0% vac · 8.0% maint · 8.0% mgmt
Financing live
Cash to close
- Down payment
- $38,750
- Closing costs
- $4,650
- Reserves months
- —
- Total cash needed
- —
Loan-product check · same deal, 3 products live
Conventional
25% down · 7.5% · 30yr
- Down + closing
- —
- Monthly P&I
- —
- Monthly cashflow
- —
- DSCR
- —
- Eligible?
- —
Personal DTI + credit; lowest rate.
DSCR
20% down · 8.5% · 30yr
- Down + closing
- —
- Monthly P&I
- —
- Monthly cashflow
- —
- DSCR
- —
- Eligible?
- —
No personal income docs; deal must DSCR.
Hard money
10% down · 12.0% · 12mo
- Down + closing
- —
- Monthly P&I
- —
- Monthly cashflow
- —
- DSCR
- —
- Eligible?
- —
Short-term bridge; refi at stabilization.
Rent comps 2 comps
| Address | Beds | Baths | Sqft | Rent | $/sqft | DOM | Units | Dist |
|---|---|---|---|---|---|---|---|---|
| 125 Kingswood Dr Prattville, AL | 3.0 | 2.0 | 1280 | $1,700 | $1.33 | 44d | 1 | 0.63mi |
| 110 Bridge St Prattville, AL | 1.0–3.0 | 1.0–2.5 | 1186 | $3,908 | $3.29 | 14d | 15 | 1.35mi |
Listing history 13 events
-
2026-06-18days on market $155,000 Active 17 DOM
-
2026-06-17days on market $155,000 Active 16 DOM
-
2026-06-16days on market $155,000 Active 15 DOM
-
2026-06-15days on market $155,000 Active 14 DOM
-
2026-06-14days on market $155,000 Active 12 DOM
-
2026-06-13days on market $155,000 Active 11 DOM
-
2026-06-10days on market $155,000 Active 9 DOM
-
2026-06-09days on market $155,000 Active 8 DOM
-
2026-06-08days on market $155,000 Active 7 DOM
-
2026-06-07days on market $155,000 Active 6 DOM
-
2026-06-03days on market $155,000 Active 2 DOM
-
2026-06-01remarks 638-char remark
-
2026-06-01$155,000 Active 1 DOM
ⓘ Source: listings_history table (triggers on properties + properties_extension) + one-shot
backfill from property_details.listing_events for pre-trigger history.
Tax reassessment forecast AL · Resets to sale price
- Current annual tax
- $829 · $69/mo
- Projected year-2 tax
- $829 · $69/mo
- Expected delta
- $0/yr ($0/mo · 0.0%)
ⓘ Screening estimate from a state-policy table — verify with the county assessor before closing.
Climate risk First Street
- Flood 5/10 Major FEMA zone X (shaded) · 24% chance over 30 yrs
- Wildfire 4/10 Moderate
- Heat 7/10 Severe 7 d/yr ≥107°F today · 20 d/yr by 30 yrs out
- Wind 8/10 Severe 80% chance of damaging wind over 30 yrs
- Air quality 3/10 Moderate 3 unhealthy d/yr today · 3 by 30 yrs out
Nearby sold comps map
Loading sold comps map…
Walkable amenities ~0.75 mi
Loading nearby amenities…
Taxation est. · year 1
- Rental income
- $28,190
- − Mortgage interest
- −$8,682
- − Property taxes
- −$829
- − Insurance
- −$775
- − Repairs & maintenance
- −$2,255
- − Management
- −$2,255
- − Depreciation
- −$4,509
- Taxable income
- $8,884
- Est. tax owed @ 24.0%
- −$2,132
- After-tax cash flow
- $8,780/yr
For passive investors: Depreciation is non-cash, so a rental often shows a tax loss while cash-flowing — sheltering income. Rental losses are passive: they offset passive income freely, and up to $25,000/yr can offset ordinary (W-2) income if you actively participate and your MAGI is under $100k (phasing out to $0 by $150k); unused losses carry forward. On sale, claimed depreciation is recaptured at up to 25%, and gains may owe capital-gains tax (a 1031 exchange can defer both). Figures are a year-1 estimate at your 24.0% rate — not tax advice; consult a CPA.
Schools (NCES district)
- District
- Autauga County
- NCES district ID
- 0100240
- Math proficiency
- 23% ▼ -31.00%
- Reading proficiency
- 50% ▼ -5.00%
- Median HH income
- $52,974
- Composite
- 31.77/100
- National rank
- #5892
- State rank
- #34 of 129 in AL
Livability — Prattville
- Score
- 76/100
- State rank
- #11
- US rank
- #3273
Category grades
Schools grade is shown separately in the Schools card above.
Census & demographics
- Census place
- Prattville, AL
- County
- Autauga County · 50,925 people
- City population
- 50,925
- Metro
- Montgomery, AL
- Population (ZIP)
- 28,293
- Household income
- $65,593
- Rent vs Own
- Severe rent burden
- 389.0
Population outlook (Autauga County) Hauer SSP2
- Today (2025)
- 55,958 people
- By 2030
- 55,810 · -0.3%
- By 2040
- 54,892 · -1.9%
- By 2050
- 53,062 · -5.2%
- By 2075
- 49,425 · -11.7%
- By 2100
- 45,110 · -19.4%
Race, ethnicity, and origin ACS 2023
- Neighborhood character
- Predominantly White (72%)
- Race & ethnicity
- White 72% Black 20% Two or more races 5% Hispanic / Latino 4%
- Common ancestry
- Slovak 3% Lithuanian 2% Italian 2%
- Foreign-born
- 1% · Canada
- Languages at home
- 98% English-only · Spanish 2%
Political lean MEDSL · Autauga
- 2024 margin
- Solid R (+46.3) · D 26.4% · R 72.7%
- 2008→2024 swing
- +1.6pp toward D · 2008: -47.8pp · 2024: -46.3pp
- All cycles
- 2024: R+46.3 2020: R+44.4 2016: R+49.5 2012: R+46.0 2008: R+47.8
Not yet ingested
- Civics
- —
Market trends
- HPI YoY
- ▼ -29.98%
- Current HPI
- 211.1676
- Rent YoY
- ▲ 5.78%
- Metro
- Montgomery, AL
- State GDP YoY
- ▲ 2.94%
- F500 in state
- 4
Industry mix (Fortune 500 HQ in AL)
| Industry | F500 HQs | Revenue |
|---|---|---|
| Financial Services | 1 | $8B |
|
||
| Healthcare | 1 | $5B |
|
||
Price history
+165.0% since first listed15 events — show timeline
- 2026-06-01 Listed $155,000 MAAR
- 2024-04-12 Rental Removed $1,250 MAAR
- 2024-04-08 Listed for Rent $1,250 MAAR
- 2024-03-29 Pending — MAAR
- 2024-03-29 Sold (Public Records) $139,000 Public Records
- 2024-03-29 Sold (MLS) $139,000 MAAR
- 2024-03-08 Contingent — MAAR
- 2024-03-07 Listed $142,000 MAAR
- 2022-11-21 Sold (MLS) $128,400 MAAR
- 2022-10-20 Listed $127,900 MAAR
- 2016-06-29 Sold (MLS) $34,500 MAAR
- 2016-05-26 Listed $31,750 MAAR
- 2000-01-14 Sold (Public Records) $58,500 Public Records
- 2000-01-14 Sold (MLS) $58,500 MAAR
- 1999-10-26 Listed $58,500 MAAR
Property tax history
+14.9%/yrLatest (2025): $829 · +1.8% YoY. Source: county tax records.
Cash-flow waterfall
monthlySold comps — $/sqft
last 12 mo · ≤1 miLoading sold comps…