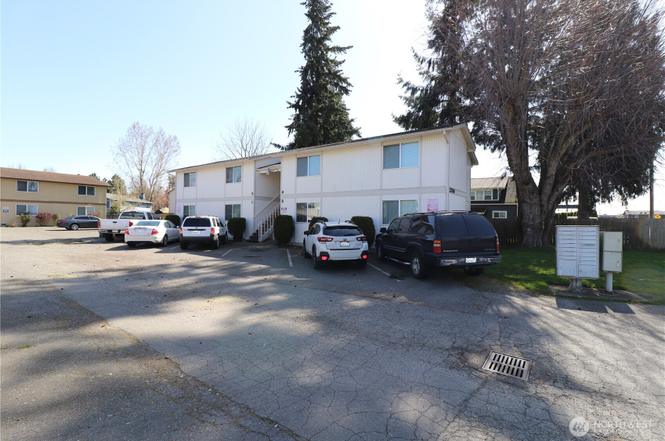
 Fourplex
2250 I St NE · Auburn, WA
Flood risk 5/10 · Moderate
- FEMA flood zone
- X (unshaded)
- Chance of flooding over 30 yrs
- 0.27%
- Est. flood insurance / yr
- $507 – $1,088
Fire risk 1/10 · Minimal
- Est. fire insurance / yr
- $604 – $1,122
Heat risk 3/10 · Minor
- Hot days now (above 87°F)
- 7 days/yr
- Hot days in 30 yrs
- 15 days/yr
Wind risk 1/10 · Minimal
- Chance of severe wind over 30 yrs
- —
Air-quality risk 7/10 · Major
- Unhealthy air days now
- 10 days/yr
- Unhealthy air days in 30 yrs
- 11 days/yr
Risk factors via First Street. Map © Google.
Why this score? — see what drove the D+ grade
The composite is a weighted blend of 9 inputs, each scored 0–100. Each bar is that input's sub-score; the figure is the points it added to the 100-point composite (weight × sub-score).
- Cash flow +12.9/30.0
- ARV discount +12.0/15.0
- Schools +4.7/10.0
- Livability +4.0/5.0
- DSCR +3.9/10.0
- 1% rule +3.0/10.0
- Rent growth +2.9/5.0
- Condition / age +2.5/5.0
- Appreciation +0.0/10.0
$900,000
🖨 Deal sheet (PDF) 📄 Offer letter ✓ Due diligence
Multi-family units
County records classify this as Multi-Family (2-4 Unit). Listing-text estimate: 4 units. confirmed
Listing remarks
This fully rented fourplex offers an incredible opportunity for investors seeking steady cash flow in the heart of Auburn. Each of the four units features 2 bedrooms, 1 bathroom, and 750 sqft, appealing to a wide range of tenants. The property includes assigned parking for convenience and a community coin-operated laundry room for added income potential. Situated in a prime location near shopping, dining, and events, this investment is perfectly positioned for growth. Don't miss out on this turnkey rental property!
Key facts
- Assigned parking
- Prime location
- 8,800 sq ft lot
Tags
Property features AI
Finance
- Other: Calculated building area: 3,000 square feet; Units in building: 4; No units below grade; Unit sizes approximately 750 square feet each; Current actual rents: Unit 1 $1,250; Unit 2 $1,425; Unit 3 $1,525; Unit 4 $1,295
- Financial info: Gross scheduled income: $72,180; Total monthly income: $6,015; Net operating income: $53,846; Total expenses: $18,334; Insurance expense: $2,318; Gross rent multiplier: 12.47; Listing terms: Cash or Conventional
Exterior
- Parking: Eight uncovered parking spaces
- Utilities: Public water; Sewer connected; Puget Sound Energy provides power
- Home design: Residential income property (multi-family); Quadruplex; 2 stories
- Construction: Wood construction; Composition roof; Poured concrete foundation; Built with electric energy source
- Exterior features: Wood exterior; Located on a cul-de-sac; Paved lot with sidewalk
Interior
- Kitchen: Range/oven in each unit; Refrigerator in each unit; Dishwasher in each unit
- Bedrooms: Four 2-bedroom units (each unit has 2 bedrooms)
- Flooring: Laminate flooring; Carpet flooring
- Bathrooms: Four 1-bath units (each unit has 1 bathroom)
- Heating & cooling: Wall unit heating; No central air conditioning
- Interior features: Laminate and carpet flooring
- Laundry & utility: Coin-operated laundry available; Individual units do not include washer/dryer hookups
Neighborhood map
What this means for you Summary
Snapshot
- This is a 4 × 2-bed/1.0-bath units multifamily listed at $900k.
Deal economics
- At list price, monthly cash flow is $-67 ($-799/yr) — negative. Per door: $-17/mo.
- To cash-flow at today's rent, offer at most $888k (1.3% below list).
- To meet the 1% rule (rent ≥ 1% of price), the offer needs to be $724k (19.5% below list).
- Recommended offer: $724k (19.5% below list) — sets the bar for 1% rule.
- Cap rate 6.2% vs local median 2.7% in Auburn — top-decile yield for the area; either an underpriced asset or a hidden risk that comps aren't pricing in. Stress-test before assuming the spread holds.
Location & tenants
- Location reads 81/100 on livability (#75 in WA, #1,371 nationally) — a professional / high-income tenant draw. Strengths: amenities A+, commute A+, employment A+; Watch: crime F, cost of living F.
- Auburn School District (urban): math 47% / reading 56% proficiency, ranked #125 of 291 in WA (top 43%) — acceptable for families but not a draw, mixed tenant base, ~2y average lease.
- Zoned schools: Dick Scobee Elementary School (825 students, 84% FRL); Cascade Middle School (899 students, 70% FRL); Auburn Mountainview High School (1,581 students, 63% FRL) — zoned schools average 72% FRL vs 44% district-wide (28 pts higher); higher-poverty schools than district average — tighter screening recommended.
- Market conditions: Rents rising (+1.5%/yr); 176 active listings in the ZIP; solid renter incomes; 10,555 units permitted in King County in 2024 (7,119 in 5+ unit buildings).
- At $7,243/mo this rent would consume 110% of the median local household income ($79k/yr) (locally 2202% of renters already pay >50% of income on rent) — very limited rent-growth headroom before tenants either downsize or default.
Forward outlook
- Local home prices are declining (-3.0%/yr); year-one equity from $6k of loan paydown is wiped out by about $27k of value loss. Plan a longer hold.
- King County population projected at +44% by 2050 — long-run rental-demand tailwind backs the buy-and-hold thesis.
Negotiation context
- It's been on market 110 days — a 9% lower offer ($819k) is reasonable based on typical stale-listing flexibility.
- 3 sale attempts since 24y ago with the ask held roughly flat each time — persistent listings suggest the price (not the market) is what's stuck; bring a comps-based counter.
- Current owner paid $575k; list at $900k implies a 57% gain — meaningful room to come down on a strong offer.
Risks & watch-outs
- Climate carrying-cost: moderate flood risk — expect insurance premiums to compound above CPI over the hold.
Questions for the listing agent
- What do current leases actually rent for vs. the listed asking? Can we see a recent rent roll and the last 12 months of T-12 income?
- It's been on market 110 days. Have you received any prior offers? Is the seller open to a 20% concession, seller financing, or rate buy-down credit?
- Can we see the unit-by-unit rent roll, current vacancy, and any below-market leases? What's the average tenancy length?
- What capital expenditures (roof, boiler, parking lot, exteriors) have been made in the last 5 years, and what's planned in the next 2?
- Built in 1978 — when were the roof, HVAC, electrical panel, plumbing, and water heater last replaced?
- Why hasn't it sold? Are there any deal-killer items the seller is aware of (foundation, flood, title, zoning, code violations)?
- Is there a deadline driving the sale (1031 exchange, divorce, estate, relocation)? That informs how much negotiation room exists.
- Crime grade is F in this area — have there been break-ins, vandalism, or insurance claims at this property in the last 3 years? What carrier currently insures it and at what premium?
- The area grade is low — what's the realistic commute time and amenity access for the typical tenant pool here? Any planned neighborhood developments (good or bad) we should know about?
- What's the average days-on-market for RENTAL listings here right now (not sales)? A rising rental-DOM trend means longer vacancies and softer asking-rent achievability than the comps imply.
- What's the recent tenant-quality profile in this submarket — average credit score on applications, eviction rate, late-payment / NSF rate, and stable-employment percentage? A property-management company in the area should have these aggregated.
- How much new apartment / multifamily construction is in the pipeline within 1–3 miles? Heavy new supply (>2% of stock underway) typically softens rents 12–24 months out; light construction supports rent growth.
Investment metrics
- 1% rule
- 0.80% ✗
- Cap rate
- 6.20%
- Cash-on-cash
- -0.32%
- DSCR
- 0.99
- GRM
- 10.4
CMA / ARV
- ARV (on-the-fly)
- $999,000
- Comps found
- 1
Show comp detail 1 sale within ~0.75 mi
| Address | Dist | Beds/Ba | Sqft | Sold | Price | $/sf | Match |
|---|---|---|---|---|---|---|---|
| 2302 I St NE | 0.01mi | 8/4.0 | 3,124 (+4%) | 15mo | $1,040,000 | $333 | 80 |
Match score weights: distance 35% · size 25% · config 20% · recency 20%. Top-matched comps best support the ARV.
Projected returns pro-forma
-3.0% appreciation · 1.51% rent growth · sell at horizon
- IRR
- -18.4%
- Equity multiple
- 0.36×
- Total profit
- $-160,935
- Equity at exit
- $134,193
- IRR
- -13.8%
- Equity multiple
- 0.25×
- Total profit
- $-188,843
- Equity at exit
- $77,816
Cash invested: $252,000 (down + closing). Projections, not guarantees.
Landlord ↔ Tenant lean methodology
- Overall (STATE)
- 28 Tenant-Leaning
- State Washington
- 28 Tenant-Leaning · D+8
- County
- — inherits STATE
- City
- — inherits STATE
ZIP-level market 98002
- Rents YoY
- 1.5%
- Active inventory
- 176
- Price-to-rent
- 41.4×
Monthly cashflow live
- Estimated rent
- $7,243 high interval (Pro) →
- Mortgage (P&I)
- −$4,720
- Tax from tax record
- −$694 /mo · $8,326/yr
- Insurance
- −$375
- HOA
- −$0
- Vacancy / Maint / Mgmt
- −$1,521
- Net cashflow
- $-67
Break-even live
Sensitivity live
| Price | -10% $443 | -5% $188 | +0% $-67 | +5% $-321 | +10% $-576 |
|---|---|---|---|---|---|
| Rent | -10% $-639 | -5% $-353 | +0% $-67 | +5% $220 | +10% $506 |
| Rate | -1.0pp $387 | -0.5pp $162 | base $-67 | +0.5pp $-300 | +1.0pp $-537 |
4-unit breakdown (identical units grouped — click to expand)
| Units | Beds | Baths | Est. rent |
|---|---|---|---|
| 4× units | 2 | 1 | $7,244 |
| #1 | 2 | 1 | $1,811 |
| #2 | 2 | 1 | $1,811 |
| #3 | 2 | 1 | $1,811 |
| #4 | 2 | 1 | $1,811 |
| Total (4 units) | $7,243 | ||
UW: 25.0% down · 7.5% · 30yr · 1.5% tax · 5.0% vac · 8.0% maint · 8.0% mgmt
Financing live
Cash to close
- Down payment
- $225,000
- Closing costs
- $27,000
- Reserves months
- —
- Total cash needed
- —
Loan-product check · same deal, 3 products live
Conventional
25% down · 7.5% · 30yr
- Down + closing
- —
- Monthly P&I
- —
- Monthly cashflow
- —
- DSCR
- —
- Eligible?
- —
Personal DTI + credit; lowest rate.
DSCR
20% down · 8.5% · 30yr
- Down + closing
- —
- Monthly P&I
- —
- Monthly cashflow
- —
- DSCR
- —
- Eligible?
- —
No personal income docs; deal must DSCR.
Hard money
10% down · 12.0% · 12mo
- Down + closing
- —
- Monthly P&I
- —
- Monthly cashflow
- —
- DSCR
- —
- Eligible?
- —
Short-term bridge; refi at stabilization.
Listing history 26 events
-
2026-06-21days on market $900,000 Active 110 DOM
-
2026-06-18days on market $900,000 Active 107 DOM
-
2026-06-17days on market $900,000 Active 106 DOM
-
2026-06-16days on market $900,000 Active 105 DOM
-
2026-06-15days on market $900,000 Active 104 DOM
-
2026-06-13days on market $900,000 Active 102 DOM
-
2026-06-13days on market $900,000 Active 101 DOM
-
2026-06-09days on market $900,000 Active 98 DOM
-
2026-06-08days on market $900,000 Active 97 DOM
-
2026-06-07days on market $900,000 Active 96 DOM
-
2026-06-04days on market $900,000 Active 93 DOM
-
2026-06-03days on market $900,000 Active 92 DOM
-
2026-06-02days on market $900,000 Active 91 DOM
-
2026-06-01days on market $900,000 Active 90 DOM
-
2026-05-31days on market $900,000 Active 89 DOM
-
2026-03-03$900,000 Active
-
2018-12-20soldstatus $575,000 Sold
-
2018-12-20soldstatus $575,000
-
2018-12-06status Pending
-
2018-11-27status Pending Inspection
-
2018-11-22$550,000 Active
-
2002-11-14soldstatus $250,000
-
2002-11-12soldstatus $250,000
-
2002-07-14$279,000
-
1995-07-13soldstatus $160,000
-
1980-05-02soldstatus $130,000
ⓘ Source: listings_history table (triggers on properties + properties_extension) + one-shot
backfill from property_details.listing_events for pre-trigger history.
Tax reassessment forecast WA · Resets to sale price
- Current annual tax
- $8,326 · $694/mo
- Projected year-2 tax
- $8,820 · $735/mo
- Expected delta
- +$494/yr (+$41/mo · 5.9%)
ⓘ Screening estimate from a state-policy table — verify with the county assessor before closing.
Climate risk First Street
- Flood 5/10 Major FEMA zone X (unshaded) · 27% chance over 30 yrs
- Wildfire 1/10 Low
- Heat 3/10 Moderate 7 d/yr ≥87°F today · 15 d/yr by 30 yrs out
- Wind 1/10 Low
- Air quality 7/10 Severe 10 unhealthy d/yr today · 11 by 30 yrs out
Nearby sold comps map
Loading sold comps map…
Walkable amenities ~0.75 mi
Loading nearby amenities…
Taxation est. · year 1
- Rental income
- $86,916
- − Mortgage interest
- −$50,414
- − Property taxes
- −$8,326
- − Insurance
- −$4,500
- − Repairs & maintenance
- −$6,953
- − Management
- −$6,953
- − Depreciation
- −$26,182
- Taxable loss
- −$16,413
- Est. tax savings @ 24.0%
- +$3,939
- After-tax cash flow
- $3,140/yr
For passive investors: Depreciation is non-cash, so a rental often shows a tax loss while cash-flowing — sheltering income. Rental losses are passive: they offset passive income freely, and up to $25,000/yr can offset ordinary (W-2) income if you actively participate and your MAGI is under $100k (phasing out to $0 by $150k); unused losses carry forward. On sale, claimed depreciation is recaptured at up to 25%, and gains may owe capital-gains tax (a 1031 exchange can defer both). Figures are a year-1 estimate at your 24.0% rate — not tax advice; consult a CPA.
Schools (NCES district)
- District
- Auburn School District
- NCES district ID
- 5300300
- Math proficiency
- 47% ▼ -3.00%
- Reading proficiency
- 56% ▼ -1.00%
- Median HH income
- $58,048
- Composite
- 46.73/100
- National rank
- #5240
- State rank
- #125 of 291 in WA
Livability — Auburn
- Score
- 81/100
- State rank
- #75
- US rank
- #1371
Category grades
Schools grade is shown separately in the Schools card above.
Census & demographics
- Census place
- Auburn, WA
- County
- King County · 2,251,916 people
- City population
- 74,969
- Metro
- Seattle-Tacoma-Bellevue, WA
- Population (ZIP)
- 37,509
- Household income
- $78,684
- Rent vs Own
- Severe rent burden
- 2202.0
Population outlook (King County) Hauer SSP2
- Today (2025)
- 2,576,485 people
- By 2030
- 2,803,316 · +8.8%
- By 2040
- 3,255,921 · +26.4%
- By 2050
- 3,706,444 · +43.9%
- By 2075
- 4,746,063 · +84.2%
- By 2100
- 5,407,730 · +109.9%
Race, ethnicity, and origin ACS 2023
- Neighborhood character
- Highly diverse neighborhood (Simpson 0.72)
- Race & ethnicity
- White 46% Hispanic / Latino 24% Two or more races 13% Black 12% Asian 6% Pacific Islander 4% Native American 2%
- Hispanic origin (detail)
- Mexican 20%
- Common ancestry
- Portuguese 4% Subsaharan African 4% Lithuanian 3%
- Foreign-born
- 24% · Canada, Vietnam
- Languages at home
- 63% English-only · Spanish 19% Russian/Polish/Slavic 6% Other Asian/Pacific 3%
Political lean MEDSL · King
- 2024 margin
- Solid D (+51.7) · D 74.2% · R 22.5% · Other 3.4%
- 2008→2024 swing
- +9.6pp toward D · 2008: 42.1pp · 2024: 51.7pp
- All cycles
- 2024: D+51.7 2020: D+52.7 2016: D+50.4 2012: D+39.9 2008: D+42.1
Not yet ingested
- Civics
- —
Market trends
- HPI YoY
- ▼ -677.96%
- Current HPI
- 298.0849
- Rent YoY
- ▲ 1.51%
- Metro
- Seattle-Tacoma-Bellevue, WA
- State GDP YoY
- ▲ 4.65%
- F500 in state
- 22
Industry mix (Fortune 500 HQ in WA)
| Industry | F500 HQs | Revenue |
|---|---|---|
| Retail | 2 | $269B |
|
||
| Technology / Retail | 1 | $638B |
|
||
| Technology | 1 | $245B |
|
||
| Telecommunications | 1 | $38B |
|
||
| Food / Beverage | 1 | $36B |
|
||
| Automotive / Trucks | 1 | $34B |
|
||
Price history
+592.3% since first listed11 events — show timeline
- 2026-03-03 Listed $900,000 NWMLS as Distributed by MLS Grid
- 2018-12-20 Sold (Public Records) $575,000 Public Records
- 2018-12-20 Sold (MLS) $575,000 NWMLS as Distributed by MLS Grid
- 2018-12-06 Pending — NWMLS as Distributed by MLS Grid
- 2018-11-27 Pending — NWMLS as Distributed by MLS Grid
- 2018-11-22 Listed $550,000 NWMLS as Distributed by MLS Grid
- 2002-11-14 Sold (MLS) $250,000 NWMLS as Distributed by MLS Grid
- 2002-11-12 Sold (Public Records) $250,000 Public Records
- 2002-07-14 Listed $279,000 NWMLS as Distributed by MLS Grid
- 1995-07-13 Sold (Public Records) $160,000 Public Records
- 1980-05-02 Sold (Public Records) $130,000 Public Records
Property tax history
+3.5%/yrLatest (2025): $8,326 · -6.2% YoY. Source: county tax records.
Cash-flow waterfall
monthlySold comps — $/sqft
last 12 mo · ≤1 miLoading sold comps…