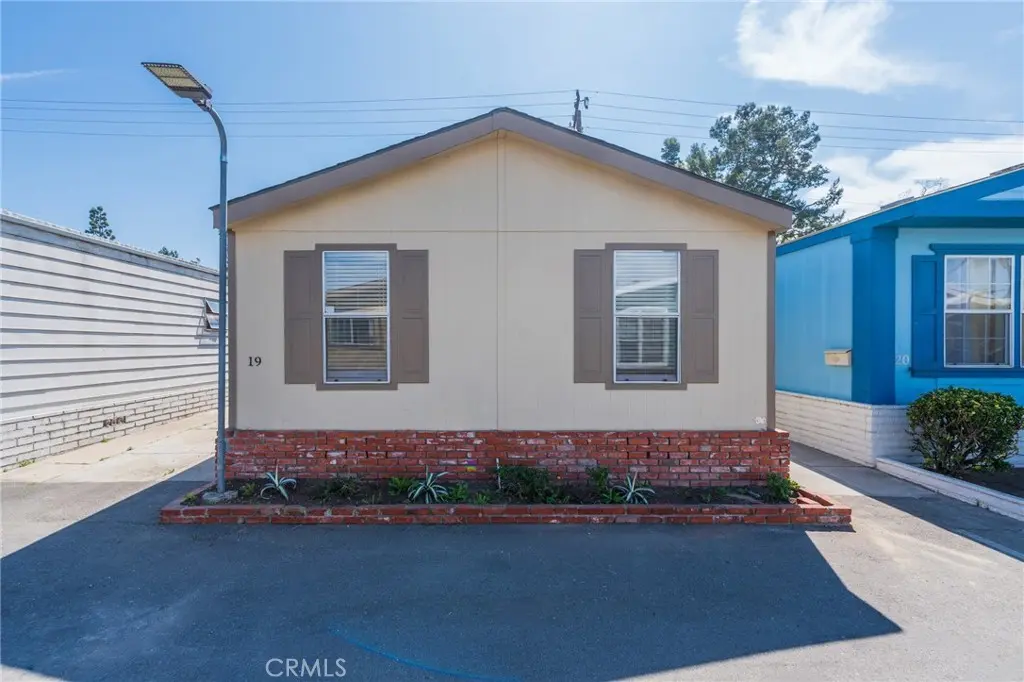
12062 W Edinger Spc 19 · Fountain Valley, CA
Flood risk 4/10 · Minor
- FEMA flood zone
- X
- Chance of flooding over 30 yrs
- 0.22%
- Est. flood insurance / yr
- $507 – $1,088
Fire risk 1/10 · Minimal
- Est. fire insurance / yr
- $659 – $1,223
Heat risk 5/10 · Moderate
- Hot days now (above 87°F)
- 7 days/yr
- Hot days in 30 yrs
- 23 days/yr
Wind risk 1/10 · Minimal
- Chance of severe wind over 30 yrs
- —
Air-quality risk 4/10 · Minor
- Unhealthy air days now
- 5 days/yr
- Unhealthy air days in 30 yrs
- 5 days/yr
Risk factors via First Street. Map © Google.
Why this score? — see what drove the B+ grade
The composite is a weighted blend of 9 inputs, each scored 0–100. Each bar is that input's sub-score; the figure is the points it added to the 100-point composite (weight × sub-score).
- Cash flow +30.0/30.0
- ARV discount +13.9/15.0
- 1% rule +10.0/10.0
- DSCR +10.0/10.0
- Schools +4.5/10.0
- Livability +3.2/5.0
- Rent growth +3.0/5.0
- Condition / age +2.5/5.0
- Appreciation +0.0/10.0
$120,000
🖨 Deal sheet 📄 Offer letter ✓ Due diligence
Listing remarks MLS
Welcome to this bright home in Le Fontaine Estates of Santa Ana. This residence features a spacious living area, a functional kitchen with an indoor laundry area, and a comfortable layout ready for your personal touch. The home offers good natural light and a generously sized primary bedroom with ample closet space. Conveniently located near shopping, dining, schools, parks, and with easy access to the 405 and 22 freeways. The monthly land lease is $ 2,115.
Key facts
- Functional kitchen
- Indoor laundry area
- Spacious living area
Tags
Neighborhood map
What this means for you Summary
Snapshot
- This is a 3-bed/2.0-bath manufactured listed at $120k.
Deal economics
- At list price, monthly cash flow is $2k ($19k/yr) — positive.
- The deal already cash-flows at list — no discount required.
- Meets the 1% rule at list price ($3k rent vs $120k).
- Recommended offer: $113k (6.0% below list) — sets the bar for market timing.
- Cap rate 22.0% vs local median 2.0% in Fountain Valley — top-decile yield for the area; either an underpriced asset or a hidden risk that comps aren't pricing in. Stress-test before assuming the spread holds.
Location & tenants
- Location reads 64/100 on livability (#403 in CA) — a middle-class / working-renter tenant base. Strengths: employment A+, schools A, crime B; Watch: commute F, cost of living F, health & safety F.
- Garden Grove Unified (suburban): math 38% / reading 65% proficiency, ranked #132 of 517 in CA (top 26%) — acceptable for families but not a draw, mixed tenant base, ~2y average lease; 60% free/reduced lunch — lower-income household profile, screen leases tightly.
- Market conditions: Rents rising (+2.2%/yr); 80 active listings in the ZIP; 19 comparable units currently listed for rent nearby; rentals leasing fast (median 13d on market — plan ~1-2 weeks tenant-placement turnaround); solid renter incomes; 6,974 units permitted in Orange County in 2024 (3,839 in 5+ unit buildings).
- This rent runs 37% of the median local income ($100k/yr) — at the standard rent-burdened threshold; future hikes will face affordability resistance.
Forward outlook
- Local home prices are declining (-3.0%/yr); year-one equity from $830 of loan paydown is wiped out by about $4k of value loss. Plan a longer hold.
- Orange County population projected at +14% by 2050 — modest demand growth; plan on rents tracking national, not racing it.
- At projected returns (-3.0% appreciation + 2.2% rent growth), your $34k cash investment doubles in ~3 years — after that, you're playing with house money.
Negotiation context
- It's been on market 62 days — a 6% lower offer ($113k) is reasonable based on typical stale-listing flexibility.
- 2 sale attempts; this cycle's ask has dropped $10k (8%) from the opening price — seller is motivated, your offer sets the floor, not the list.
Risks & watch-outs
- Climate carrying-cost: extreme-heat days projected 7→23/yr by 2055 (HVAC capex compounding) — expect insurance premiums to compound above CPI over the hold.
Questions for the listing agent
- It's been on market 62 days. Have you received any prior offers? Is the seller open to a 6% concession, seller financing, or rate buy-down credit?
- Why hasn't it sold? Are there any deal-killer items the seller is aware of (foundation, flood, title, zoning, code violations)?
- Is there a deadline driving the sale (1031 exchange, divorce, estate, relocation)? That informs how much negotiation room exists.
- Schools are A-rated — typically a magnet for longer-tenancy family renters. What's the average tenant stay here, and is there a school-zone premium baked into asking?
- What's the average days-on-market for RENTAL listings here right now (not sales)? A rising rental-DOM trend means longer vacancies and softer asking-rent achievability than the comps imply.
- What's the recent tenant-quality profile in this submarket — average credit score on applications, eviction rate, late-payment / NSF rate, and stable-employment percentage? A property-management company in the area should have these aggregated.
- How much new for-sale + rental construction is in the pipeline within 1–3 miles? Heavy new supply typically softens prices + rents 12–24 months out; constrained supply supports both.
Investment metrics
- 1% rule
- 2.54% ✓
- Cap rate
- 22.03%
- Cash-on-cash
- 56.21%
- DSCR
- 3.50
- GRM
- 3.3
CMA / ARV
- ARV (median comp)
- $140,000
- List price
- $120,000
- Delta
- -14.29%
- Verdict
- UNDERPRICED
- Comps
- 3 within 1.0 mi
Show comp detail 1 sale within ~0.75 mi
| Address | Dist | Beds/Ba | Sqft | Sold | Price | $/sf | Match |
|---|---|---|---|---|---|---|---|
| 12062 W Edinger Ave #59 | 0.00mi | 3/2.0 | 960 (0%) | 11mo | $190,000 | $198 | 91 |
Match score weights: distance 35% · size 25% · config 20% · recency 20%. Top-matched comps best support the ARV.
Projected returns pro-forma
-3.0% appreciation · 2.16% rent growth · sell at horizon
- IRR
- 53.6%
- Equity multiple
- 3.33×
- Total profit
- $78,298
- Equity at exit
- $17,892
- IRR
- 58.5%
- Equity multiple
- 6.57×
- Total profit
- $187,163
- Equity at exit
- $10,375
Cash invested: $33,600 (down + closing). Projections, not guarantees.
Landlord ↔ Tenant lean methodology
- Overall (STATE)
- 18 Strongly Tenant-Friendly
- State California
- 18 Strongly Tenant-Friendly · D+13
- County
- — inherits STATE
- City
- — inherits STATE
ZIP-level market 92704
- Rents YoY
- 2.2%
- Active inventory
- 80
- Price-to-rent
- 3.3×
Monthly cashflow live
- Estimated rent
- $3,042 high interval (Pro) →
- Mortgage (P&I)
- −$629
- Tax est. 1.5%
- −$150 /mo · $1,800/yr
- Insurance
- −$50
- HOA
- −$0
- Vacancy / Maint / Mgmt
- −$639
- Net cashflow
- $1,574
Break-even live
UW: 25.0% down · 7.5% · 30yr · 1.5% tax · 5.0% vac · 8.0% maint · 8.0% mgmt
Financing live
Cash to close
- Down payment
- $30,000
- Closing costs
- $3,600
- Reserves months
- —
- Total cash needed
- —
Loan-product check · same deal, 3 products live
Conventional
25% down · 7.5% · 30yr
- Down + closing
- —
- Monthly P&I
- —
- Monthly cashflow
- —
- DSCR
- —
- Eligible?
- —
Personal DTI + credit; lowest rate.
DSCR
20% down · 8.5% · 30yr
- Down + closing
- —
- Monthly P&I
- —
- Monthly cashflow
- —
- DSCR
- —
- Eligible?
- —
No personal income docs; deal must DSCR.
Hard money
10% down · 12.0% · 12mo
- Down + closing
- —
- Monthly P&I
- —
- Monthly cashflow
- —
- DSCR
- —
- Eligible?
- —
Short-term bridge; refi at stabilization.
Rent comps 19 comps
| Address | Beds | Baths | Sqft | Rent | $/sqft | DOM | Units | Dist |
|---|---|---|---|---|---|---|---|---|
| 16350 S Harbor Blvd Santa Ana, CA | 1.0–2.0 | 1.0 | 800 | $2,870 | $3.59 | 43d | 1 | 0.10mi |
| 2513 W Occidental St Santa Ana, CA | 2.0 | 2.0 | 980 | $3,495 | $3.57 | 7d | 1 | 0.88mi |
| 11630 Warner Ave #412 Fountain Valley, CA | 2.0 | 2.0 | 1040 | $2,850 | $2.74 | 24d | 1 | 0.90mi |
| 2417 W Stanford St Santa Ana, CA | 2.0 | 1.0 | 700 | $3,200 | $4.57 | 24d | 1 | 0.93mi |
| 11620 Warner Ave Fountain Valley, CA | 1.0–2.0 | 1.0–2.0 | 891 | $2,700 | $3.03 | 43d | 1 | 0.94mi |
| 11620 Warner Ave #524 Fountain Valley, CA | 2.0 | 2.0 | 970 | $2,700 | $2.78 | 10d | 1 | 0.94mi |
| 17200 Newhope St Fountain Valley, CA | 2.0 | 1.0–2.0 | 900 | $2,850 | $3.17 | 5d | 3 | 1.01mi |
| 17200 Newhope St Fountain Valley, CA | 2.0 | 1.0–2.0 | 900 | $2,850 | $3.17 | 7d | 4 | 1.01mi |
| 517 S Newhope St Santa Ana, CA | 2.0 | 1.0 | 840 | $2,125 | $2.53 | 44d | 1 | 1.07mi |
| 16245 Mount Baden Powell St Fountain Valley, CA | 2.0 | 2.0 | 900 | $2,650 | $2.94 | 43d | 1 | 1.09mi |
| 11300 Warner Ave Fountain Valley, CA | 1.0–2.0 | 1.0–2.0 | 821 | $3,250 | $3.96 | 7d | 3 | 1.10mi |
| 308 S Laurel St Unit C Santa Ana, CA | 2.0 | 1.0 | 950 | $2,650 | $2.79 | 43d | 1 | 1.12mi |
| 2613 S Fairview St Santa Ana, CA | 1.0–2.0 | 1.0 | 762 | $2,778 | $3.64 | 7d | 3 | 1.16mi |
| 4800 W McFadden Ave Santa Ana, CA | 2.0 | 1.0 | 820 | $2,450 | $2.99 | 18d | 1 | 1.16mi |
| 2701 S Fairview St Santa Ana, CA | 1.0–2.0 | 1.0–2.0 | 885 | $3,045 | $3.44 | 24d | 4 | 1.27mi |
| 4200 W 1st St Santa Ana, CA | 1.0–2.0 | 1.0–2.0 | 714 | $2,997 | $4.19 | 1d | 4 | 1.32mi |
| 3200 W 5th St Santa Ana, CA | 1.0–2.0 | 1.0–2.0 | 769 | $2,795 | $3.63 | 2d | 9 | 1.43mi |
| 3900 W 5th St Santa Ana, CA | 1.0–2.0 | 1.0–2.0 | 780 | $2,175 | $2.79 | 13d | 1 | 1.45mi |
| 17300 Euclid St Fountain Valley, CA | 2.0 | 1.5 | 1002 | $2,752 | $2.75 | 1d | 6 | 1.47mi |
Listing history 17 events
-
2026-06-18days on market $120,000 Active 62 DOM
-
2026-06-17days on market $120,000 Active 61 DOM
-
2026-06-16days on market $120,000 Active 60 DOM
-
2026-06-15days on market $120,000 Active 59 DOM
-
2026-06-13days on market $120,000 Active 57 DOM
-
2026-06-13pricedays on market $120,000 Active 56 DOM
-
2026-06-09days on market $130,000 Active 53 DOM
-
2026-06-08days on market $130,000 Active 52 DOM
-
2026-06-07days on market $130,000 Active 51 DOM
-
2026-06-04days on market $130,000 Active 48 DOM
-
2026-06-03days on market $130,000 Active 47 DOM
-
2026-06-02days on market $130,000 Active 46 DOM
-
2026-06-01days on market $130,000 Active 45 DOM
-
2026-05-31days on market $130,000 Active 44 DOM
-
2026-04-17historical
Show marketing remark (461 chars)
Welcome to this bright home in Le Fontaine Estates of Santa Ana. This residence features a spacious living area, a functional kitchen with an indoor laundry area, and a comfortable layout ready for your personal touch. The home offers good natural light and a generously sized primary bedroom with ample closet space. Conveniently located near shopping, dining, schools, parks, and with easy access to the 405 and 22 freeways. The monthly land lease is $ 2,115.
-
2026-04-17$130,000 Active 461-char remark
Show marketing remark (461 chars)
Welcome to this bright home in Le Fontaine Estates of Santa Ana. This residence features a spacious living area, a functional kitchen with an indoor laundry area, and a comfortable layout ready for your personal touch. The home offers good natural light and a generously sized primary bedroom with ample closet space. Conveniently located near shopping, dining, schools, parks, and with easy access to the 405 and 22 freeways. The monthly land lease is $ 2,115.
-
2026-03-25$130,000 Active
ⓘ Source: listings_history table (triggers on properties + properties_extension) + one-shot
backfill from property_details.listing_events for pre-trigger history.
Climate risk First Street
- Flood 4/10 Moderate FEMA zone X · 22% chance over 30 yrs
- Wildfire 1/10 Low
- Heat 5/10 Major 7 d/yr ≥87°F today · 23 d/yr by 30 yrs out
- Wind 1/10 Low
- Air quality 4/10 Moderate 5 unhealthy d/yr today · 5 by 30 yrs out
Nearby sold comps map
Loading sold comps map…
Walkable amenities ~0.75 mi
Loading nearby amenities…
Taxation est. · year 1
- Rental income
- $36,505
- − Mortgage interest
- −$6,722
- − Property taxes
- −$1,800
- − Insurance
- −$600
- − Repairs & maintenance
- −$2,920
- − Management
- −$2,920
- − Depreciation
- −$3,491
- Taxable income
- $18,052
- Est. tax owed @ 24.0%
- −$4,332
- After-tax cash flow
- $14,555/yr
For passive investors: Depreciation is non-cash, so a rental often shows a tax loss while cash-flowing — sheltering income. Rental losses are passive: they offset passive income freely, and up to $25,000/yr can offset ordinary (W-2) income if you actively participate and your MAGI is under $100k (phasing out to $0 by $150k); unused losses carry forward. On sale, claimed depreciation is recaptured at up to 25%, and gains may owe capital-gains tax (a 1031 exchange can defer both). Figures are a year-1 estimate at your 24.0% rate — not tax advice; consult a CPA.
Schools (NCES district)
- District
- Garden Grove Unified
- NCES district ID
- 0614880
- Math proficiency
- 38% ▼ -14.00%
- Reading proficiency
- 65% ▲ 4.00%
- Median HH income
- $60,089
- Composite
- 44.89/100
- National rank
- #2715
- State rank
- #132 of 517 in CA
Livability — Fountain Valley
- Score
- 64/100
- State rank
- #403
- US rank
- #13744
Category grades
Schools grade is shown separately in the Schools card above.
Census & demographics
- County
- Orange County · 3,096,323 people
- City population
- 56,258
- Metro
- Los Angeles-Long Beach-Anaheim, CA
- Population (ZIP)
- 82,120
- Household income
- $99,777
- Rent vs Own
- Severe rent burden
- 2188.0
Population outlook (Orange County) Hauer SSP2
- Today (2025)
- 3,477,456 people
- By 2030
- 3,613,117 · +3.9%
- By 2040
- 3,835,945 · +10.3%
- By 2050
- 3,968,736 · +14.1%
- By 2075
- 4,097,053 · +17.8%
- By 2100
- 3,903,633 · +12.3%
Race, ethnicity, and origin ACS 2023
- Neighborhood character
- Predominantly Hispanic (71%)
- Race & ethnicity
- Hispanic / Latino 71% Asian 18% Two or more races 17% White 9% Native American 2%
- Hispanic origin (detail)
- Mexican 65%
- Common ancestry
- Italian 1%
- Foreign-born
- 44% · Canada, Vietnam, China
- Languages at home
- 22% English-only · Spanish 61% Vietnamese 13% Other Asian/Pacific 2%
Political lean MEDSL · Orange
- 2024 margin
- Toss-up / Even · D 49.7% · R 47.1% · Other 3.2%
- 2008→2024 swing
- +5.2pp toward D · 2008: -2.6pp · 2024: 2.6pp
- All cycles
- 2024: D+2.6 2020: D+9.0 2016: D+7.7 2012: R+8.3 2008: R+2.6
Not yet ingested
- Civics
- —
Market trends
- HPI YoY
- ▼ -991.35%
- Current HPI
- 449.8874
- Rent YoY
- ▲ 2.16%
- Metro
- Los Angeles-Long Beach-Anaheim, CA
- State GDP YoY
- ▲ 3.21%
- F500 in state
- 116
Industry mix (Fortune 500 HQ in CA)
| Industry | F500 HQs | Revenue |
|---|---|---|
| Technology | 27 | $1,492B |
|
||
| Financial Services | 3 | $174B |
|
||
| Retail | 3 | $44B |
|
||
| Insurance | 3 | $26B |
|
||
| Media / Entertainment | 2 | $115B |
|
||
| Pharmaceuticals / Biotech | 2 | $62B |
|
||
Price history
+0.0% since first listed3 events — show timeline
- 2026-04-17 Listed $130,000 CRMLS
- 2026-04-17 Listing Removed — CRMLS
- 2026-03-25 Listed $130,000 CRMLS
Property tax history
-4.2%/yrLatest (2025): $224 · -0.1% YoY. Source: county tax records.
Cash-flow waterfall
monthlySold comps — $/sqft
last 12 mo · ≤1 miLoading sold comps…