 🏗️ New Construction
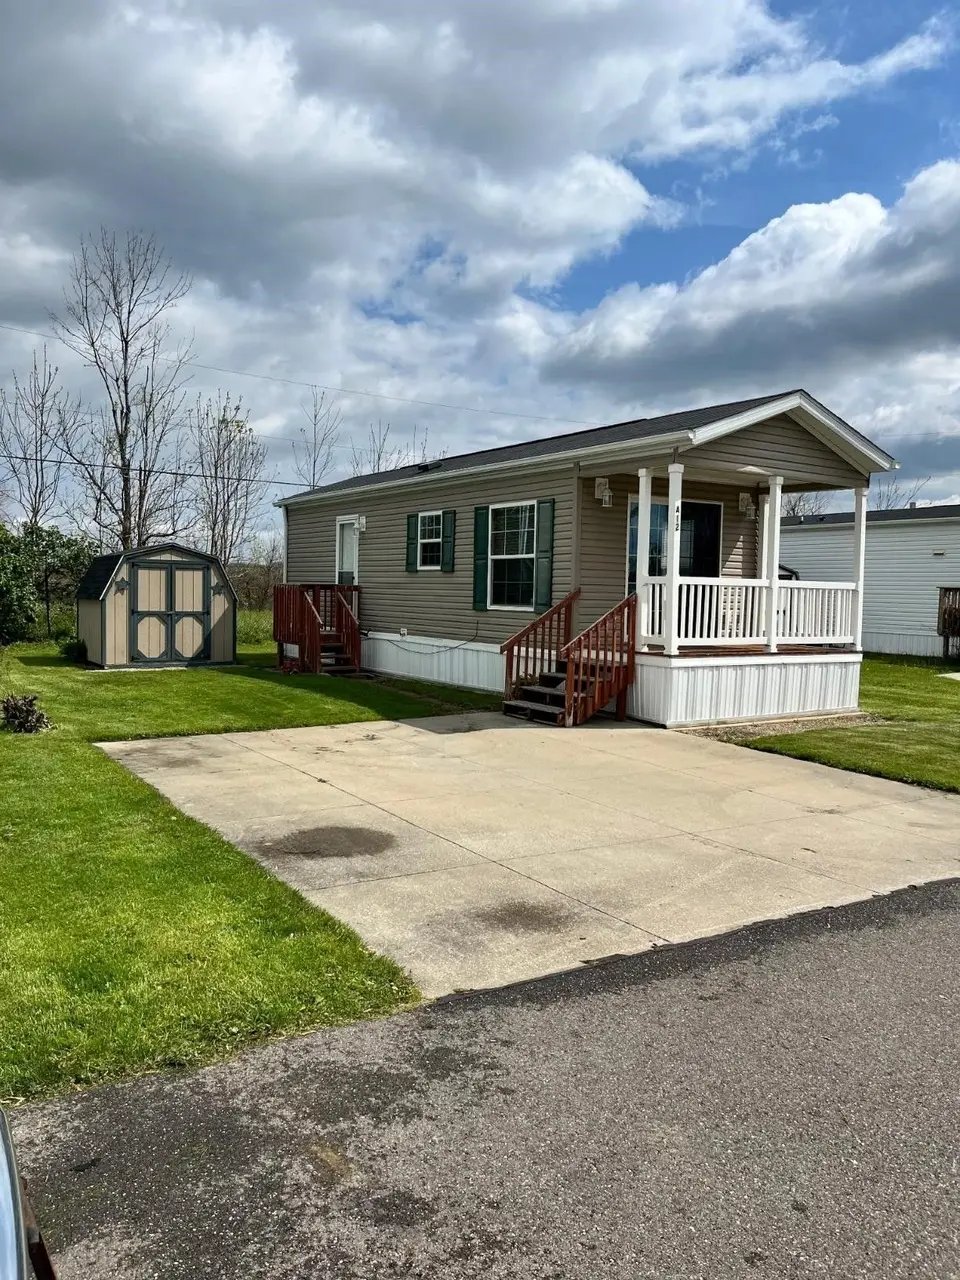
Skyline EVA12 Evergreen Village Plan · Mantua, OH
Flood risk 1/10 · Minimal
- FEMA flood zone
- X (unshaded)
- Chance of flooding over 30 yrs
- 0.0%
- Est. flood insurance / yr
- $473 – $860
Fire risk 1/10 · Minimal
- Est. fire insurance / yr
- $713 – $1,323
Heat risk 2/10 · Minimal
- Hot days now (above 95°F)
- 7 days/yr
- Hot days in 30 yrs
- 17 days/yr
Wind risk 1/10 · Minimal
- Chance of severe wind over 30 yrs
- —
Air-quality risk 3/10 · Minor
- Unhealthy air days now
- 2 days/yr
- Unhealthy air days in 30 yrs
- 5 days/yr
Risk factors via First Street. Map © Google.
Why this score? — see what drove the B grade
The composite is a weighted blend of 9 inputs, each scored 0–100. Each bar is that input's sub-score; the figure is the points it added to the 100-point composite (weight × sub-score).
- Cash flow +30.0/30.0
- 1% rule +10.0/10.0
- DSCR +10.0/10.0
- ARV discount +7.5/15.0
- Schools +5.0/10.0
- Condition / age +3.8/5.0
- Livability +3.6/5.0
- Rent growth +2.5/5.0
- Appreciation +0.0/10.0
$37,500
🖨 Deal sheet (PDF) 📄 Offer letter ✓ Due diligence
Listing remarks
Immerse yourself in our quaint community, Evergreen Village located in Mantua, Ohio. Evergreen Village is Mantua's premier all-ages housing community. This community offers residents more than a home - it offers a lifestyle. Our community features planned events for our residents such as after-school tutoring, summer lunch program, Holiday themed parties and an annual resident appreciation BBQ. At our yearly resident appreciation BBQ, we provide our residents with food, refreshments, and UMH Properties, Inc. apparel. In addition to our community atmosphere we also provide high quality affordable homes. Our homes feature homes with open-concept floor plans, including attractive interiors wit
Key facts
- Kitchen pantries
- Primary suites
- Two car driveway
Tags
Property features AI
Finance
- Financial info: Listed as a plan (new construction inventory type); List price $37,500
Exterior
- Utilities: Natural gas; Central air conditioning
- Home design: Planned unit: Skyline EVA12 Evergreen Village
- Construction: 480 living area
- Exterior features: Shake roof
Interior
- Bedrooms: 1 bedroom
- Heating & cooling: Natural gas heating; Central air conditioning
- Interior features: 1 total bathroom
Neighborhood map
What this means for you Summary
Snapshot
- This is a 1-bed/1.0-bath manufactured listed at $38k. Condition is rated good.
Deal economics
- At list price, monthly cash flow is $366 ($4k/yr) — positive.
- The deal already cash-flows at list — no discount required.
- Meets the 1% rule at list price ($792 rent vs $38k).
- Recommended offer: $37k (1.5% below list) — sets the bar for market timing.
Location & tenants
- Location reads 71/100 on livability (#398 in OH) — a middle-class / working-renter tenant base. Strengths: cost of living A+, housing A+, schools A; Watch: employment D+, amenities F, commute F.
- Crestwood Local (rural): math 51% / reading 64% proficiency, ranked #313 of 656 in OH (top 48%) — acceptable for families but not a draw, mixed tenant base, ~2y average lease.
- Market conditions: 22 active listings in the ZIP; 196 units permitted in Portage County in 2024 (10 in 5+ unit buildings).
- This rent is only 13% of the median local income ($74k/yr) — well below the 30% rent-burden line; pricing power to push rent on renewal without tenant pushback.
Forward outlook
- Local home prices are declining (-3.0%/yr); year-one equity from $259 of loan paydown is wiped out by about $1k of value loss. Plan a longer hold.
- At projected returns (-3.0% appreciation + 3.0% rent growth), your $10k cash investment doubles in ~3 years — after that, you're playing with house money.
Negotiation context
- It's been on market 30 days — a 2% lower offer ($37k) is reasonable based on typical stale-listing flexibility.
Questions for the listing agent
- Is there a deadline driving the sale (1031 exchange, divorce, estate, relocation)? That informs how much negotiation room exists.
- Schools are A-rated — typically a magnet for longer-tenancy family renters. What's the average tenant stay here, and is there a school-zone premium baked into asking?
- What's the average days-on-market for RENTAL listings here right now (not sales)? A rising rental-DOM trend means longer vacancies and softer asking-rent achievability than the comps imply.
- What's the recent tenant-quality profile in this submarket — average credit score on applications, eviction rate, late-payment / NSF rate, and stable-employment percentage? A property-management company in the area should have these aggregated.
- How much new for-sale + rental construction is in the pipeline within 1–3 miles? Heavy new supply typically softens prices + rents 12–24 months out; constrained supply supports both.
Investment metrics
- 1% rule
- 2.11% ✓
- Cap rate
- 18.02%
- Cash-on-cash
- 41.87%
- DSCR
- 2.86
- GRM
- 3.9
CMA / ARV
No comps found within radius.
Projected returns pro-forma
-3.0% appreciation · 3.0% rent growth · sell at horizon
- IRR
- 38.5%
- Equity multiple
- 2.64×
- Total profit
- $17,268
- Equity at exit
- $5,591
- IRR
- 45.0%
- Equity multiple
- 5.30×
- Total profit
- $45,131
- Equity at exit
- $3,242
Cash invested: $10,500 (down + closing). Projections, not guarantees.
Landlord ↔ Tenant lean methodology
- Overall (STATE)
- 73 Landlord-Friendly
- State Ohio
- 73 Landlord-Friendly · R+6
- County
- — inherits STATE
- City
- — inherits STATE
ZIP-level market 44255
- Active inventory
- 22
- Price-to-rent
- 3.9×
Monthly cashflow live
- Estimated rent
- $792 medium interval (Pro) →
- Mortgage (P&I)
- −$197
- Tax est. 1.5%
- −$47 /mo · $562/yr
- Insurance
- −$16
- HOA
- −$0
- Vacancy / Maint / Mgmt
- −$166
- Net cashflow
- $366
Break-even live
Sensitivity live
| Price | -10% $392 | -5% $379 | +0% $366 | +5% $353 | +10% $340 |
|---|---|---|---|---|---|
| Rent | -10% $304 | -5% $335 | +0% $366 | +5% $398 | +10% $429 |
| Rate | -1.0pp $385 | -0.5pp $376 | base $366 | +0.5pp $357 | +1.0pp $347 |
UW: 25.0% down · 7.5% · 30yr · 1.5% tax · 5.0% vac · 8.0% maint · 8.0% mgmt
Financing live
Cash to close
- Down payment
- $9,375
- Closing costs
- $1,125
- Reserves months
- —
- Total cash needed
- —
Loan-product check · same deal, 3 products live
Conventional
25% down · 7.5% · 30yr
- Down + closing
- —
- Monthly P&I
- —
- Monthly cashflow
- —
- DSCR
- —
- Eligible?
- —
Personal DTI + credit; lowest rate.
DSCR
20% down · 8.5% · 30yr
- Down + closing
- —
- Monthly P&I
- —
- Monthly cashflow
- —
- DSCR
- —
- Eligible?
- —
No personal income docs; deal must DSCR.
Hard money
10% down · 12.0% · 12mo
- Down + closing
- —
- Monthly P&I
- —
- Monthly cashflow
- —
- DSCR
- —
- Eligible?
- —
Short-term bridge; refi at stabilization.
Listing history 15 events
-
2026-06-18days on market $37,500 Active 30 DOM
-
2026-06-17days on market $37,500 Active 29 DOM
-
2026-06-16days on market $37,500 Active 28 DOM
-
2026-06-15days on market $37,500 Active 27 DOM
-
2026-06-14days on market $37,500 Active 25 DOM
-
2026-06-13days on market $37,500 Active 24 DOM
-
2026-06-10days on market $37,500 Active 22 DOM
-
2026-06-09days on market $37,500 Active 21 DOM
-
2026-06-08days on market $37,500 Active 20 DOM
-
2026-06-07days on market $37,500 Active 19 DOM
-
2026-06-03days on market $37,500 Active 15 DOM
-
2026-06-02days on market $37,500 Active 14 DOM
-
2026-06-01days on market $37,500 Active 13 DOM
-
2026-05-31days on market $37,500 Active 12 DOM
-
2026-05-31days on market $37,500 Active 11 DOM
ⓘ Source: listings_history table (triggers on properties + properties_extension) + one-shot
backfill from property_details.listing_events for pre-trigger history.
Climate risk First Street
- Flood 1/10 Low FEMA zone X (unshaded) · 0% chance over 30 yrs
- Wildfire 1/10 Low
- Heat 2/10 Low 7 d/yr ≥95°F today · 17 d/yr by 30 yrs out
- Wind 1/10 Low
- Air quality 3/10 Moderate 2 unhealthy d/yr today · 5 by 30 yrs out
Nearby sold comps map
Loading sold comps map…
Walkable amenities ~0.75 mi
Loading nearby amenities…
Taxation est. · year 1
- Rental income
- $9,501
- − Mortgage interest
- −$2,101
- − Property taxes
- −$562
- − Insurance
- −$188
- − Repairs & maintenance
- −$760
- − Management
- −$760
- − Depreciation
- −$1,091
- Taxable income
- $4,040
- Est. tax owed @ 24.0%
- −$970
- After-tax cash flow
- $3,427/yr
For passive investors: Depreciation is non-cash, so a rental often shows a tax loss while cash-flowing — sheltering income. Rental losses are passive: they offset passive income freely, and up to $25,000/yr can offset ordinary (W-2) income if you actively participate and your MAGI is under $100k (phasing out to $0 by $150k); unused losses carry forward. On sale, claimed depreciation is recaptured at up to 25%, and gains may owe capital-gains tax (a 1031 exchange can defer both). Figures are a year-1 estimate at your 24.0% rate — not tax advice; consult a CPA.
Condition & rehab AI · 8 photos
This manufactured home is in good condition with a good condition score of 75. It has a cosmetic rehab level and requires minor maintenance. The highest-ROI updates would be painting the exterior and adding smart home features.
Value-add opportunities
- Both Paint exterior — Enhances curb appeal and value
- Both Replace carpet in laundry room — Improves aesthetics and functionality
- Both Add smart home features — Enhances convenience and marketability
Renovation cost estimate screening
Value-add ROI direction
- Both Paint exterior — Enhances curb appeal and value ↑
- Both Replace carpet in laundry room — Improves aesthetics and functionality ↑
- Both Add smart home features — Enhances convenience and marketability ↑
ⓘ Cost ranges are severity-bucket heuristics (US national rule-of-thumb). Get contractor quotes + a written scope before underwriting a rehab budget.
Schools (NCES district)
- District
- Crestwood Local
- NCES district ID
- 3904918
- Math proficiency
- 51% ▼ -16.00%
- Reading proficiency
- 64% ▼ -5.00%
- Median HH income
- $58,483
- Composite
- 49.77/100
- National rank
- #1961
- State rank
- #313 of 656 in OH
Livability — Mantua
- Score
- 71/100
- State rank
- #398
- US rank
- #6581
Category grades
Schools grade is shown separately in the Schools card above.
Census & demographics
- County
- Portage · 165,699 people
- City population
- 7,043
- Metro
- Akron, OH
- Population (ZIP)
- 7,043
- Household income
- $74,221
- Rent vs Own
- Severe rent burden
- 7.1
Population outlook (Portage County) Hauer SSP2
- Today (2025)
- 166,109 people
- By 2030
- 167,752 · +1.0%
- By 2040
- 168,640 · +1.5%
- By 2050
- 167,469 · +0.8%
- By 2075
- 170,131 · +2.4%
- By 2100
- 167,958 · +1.1%
Race, ethnicity, and origin ACS 2023
- Neighborhood character
- Predominantly White (90%)
- Race & ethnicity
- White 90% Two or more races 8% Hispanic / Latino 2%
- Common ancestry
- Romanian 6% Italian 3% Scotch-Irish 3%
- Foreign-born
- 3% · Canada, Jamaica
- Languages at home
- 97% English-only · Spanish 2%
Political lean MEDSL · Portage
- 2024 margin
- R (+15.5) · D 41.8% · R 57.3%
- 2008→2024 swing
- -24.5pp toward R · 2008: 9.0pp · 2024: -15.5pp
- All cycles
- 2024: R+15.5 2020: R+12.5 2016: R+10.2 2012: D+4.9 2008: D+9.0
Not yet ingested
- Civics
- —
Market trends
- HPI YoY
- ▼ -125.56%
- Current HPI
- 202.2292
- Rent YoY
- —
- Metro
- —
- State GDP YoY
- ▲ 1.98%
- F500 in state
- 48
Industry mix (Fortune 500 HQ in OH)
| Industry | F500 HQs | Revenue |
|---|---|---|
| Insurance | 3 | $145B |
|
||
| Industrial Machinery | 3 | $49B |
|
||
| Financial Services | 3 | $24B |
|
||
| Consumer Goods | 2 | $93B |
|
||
| Aerospace / Defense | 2 | $47B |
|
||
| Utilities | 2 | $33B |
|
||
Cash-flow waterfall
monthlySold comps — $/sqft
last 12 mo · ≤1 miLoading sold comps…