 6-Plex
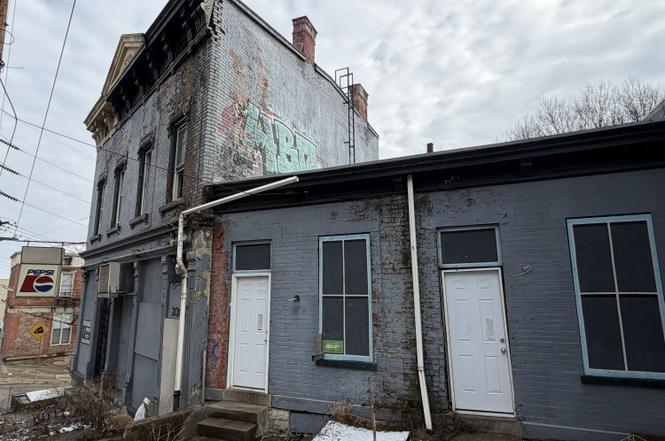
2360 Wilder Ave · Cincinnati, OH
Flood risk 1/10 · Minimal
- FEMA flood zone
- X (unshaded)
- Chance of flooding over 30 yrs
- 0.0%
- Est. flood insurance / yr
- $507 – $1,088
Fire risk 1/10 · Minimal
- Est. fire insurance / yr
- $713 – $1,323
Heat risk 5/10 · Moderate
- Hot days now (above 103°F)
- 7 days/yr
- Hot days in 30 yrs
- 20 days/yr
Wind risk 2/10 · Minimal
- Chance of severe wind over 30 yrs
- 1.0%
Air-quality risk 3/10 · Minor
- Unhealthy air days now
- 3 days/yr
- Unhealthy air days in 30 yrs
- 5 days/yr
Risk factors via First Street. Map © Google.
Why this score? — see what drove the B- grade
The composite is a weighted blend of 9 inputs, each scored 0–100. Each bar is that input's sub-score; the figure is the points it added to the 100-point composite (weight × sub-score).
- Cash flow +30.0/30.0
- 1% rule +10.0/10.0
- DSCR +10.0/10.0
- ARV discount +7.5/15.0
- Livability +4.0/5.0
- Rent growth +2.5/5.0
- Schools +2.5/10.0
- Condition / age +2.5/5.0
- Appreciation +0.0/10.0
$350,000
🖨 Deal sheet 📄 Offer letter ✓ Due diligence
Multi-family units
County records classify this as Multi-Family (5+ Unit). Listing-text estimate: 6 units. confirmed
5+ unit building — per-unit beds/baths from public records are typically unavailable; the breakdown below (if shown) is an estimate from the listing text.
Listing remarks
Investor special in the heart of Cincinnati! 2360 Wilder Ave is a rare value-add mixed-use opportunity being sold as-is. The property consists of 6 individual residential units with private entrances plus a separate larger building featuring two second-floor residential units and a ground-floor retail space. The buildings have already been taken down to the studs and are currently framed, with electric and HVAC in placeallowing you to step in and complete the project to your specifications. Major exterior improvement already completed: the roof on the six individual units has been replaced. This is a prime opportunity for an experienced investor or developer to finish out a high-income-prod
Key facts
- Private entrances
- Minutes to downtown
- 2,178 sq ft lot
Tags
Property features AI
Finance
- Other: Multiple tax parcel IDs associated with the property; Located in the Price Hill neighborhood
- Financial info: Semi-annual taxes reported
Exterior
- Parking: On-street parking
- Utilities: Public water; Public sewer; Natural gas
- Home design: Two levels; Multiple buildings on site (7 total)
- Construction: Stone foundation
- Exterior features: Membrane roof; Brick construction; Other-style windows; Lot approximately 0.05 acres (2,178 sq ft)
Interior
- Bedrooms: Nine total units with eight 1-bedroom units
- Interior features: Partial basement; Inoperable fireplace
Neighborhood map
What this means for you Summary
Snapshot
- This is a 6 × 8-bed/?-bath units multifamily listed at $350k.
Deal economics
- At list price, monthly cash flow is $8k ($93k/yr) — positive. Per door: $1k/mo.
- The deal already cash-flows at list — no discount required.
- Meets the 1% rule at list price ($13k rent vs $350k).
- Recommended offer: $318k (9.0% below list) — sets the bar for market timing.
- Cap rate 33.0% vs local median 3.9% in Cincinnati — top-decile yield for the area; either an underpriced asset or a hidden risk that comps aren't pricing in. Stress-test before assuming the spread holds.
Location & tenants
- Location reads 80/100 on livability (#130 in OH, #1,856 nationally) — a professional / high-income tenant draw. Strengths: amenities A+, commute A+, cost of living A+; Watch: employment D, crime F.
- Cincinnati Public Schools (urban): math 25% / reading 36% proficiency, ranked #581 of 656 in OH (top 89%) — families likely to look elsewhere, expect single-tenant / working-renter base with shorter leases; 70% free/reduced lunch — lower-income household profile, screen leases tightly.
- Market conditions: 33 active listings in the ZIP; lower-income renter base — watch delinquency; 801 units permitted in Hamilton County in 2024 (190 in 5+ unit buildings).
- At $12,920/mo this rent would consume 496% of the median local household income ($31k/yr) (locally 487% of renters already pay >50% of income on rent) — very limited rent-growth headroom before tenants either downsize or default.
Forward outlook
- Local home prices are declining (-3.0%/yr); year-one equity from $2k of loan paydown is wiped out by about $10k of value loss. Plan a longer hold.
- At projected returns (-3.0% appreciation + 3.0% rent growth), your $98k cash investment doubles in ~2 years — after that, you're playing with house money.
Negotiation context
- It's been on market 112 days — a 9% lower offer ($318k) is reasonable based on typical stale-listing flexibility.
- Current owner paid $11k; list at $350k implies a 3082% gain — meaningful room to come down on a strong offer.
Risks & watch-outs
- Watch-outs: built in 1869 — expect roof / HVAC / electrical / plumbing capex.
- Climate carrying-cost: extreme-heat days projected 7→20/yr by 2055 (HVAC capex compounding) — expect insurance premiums to compound above CPI over the hold.
Questions for the listing agent
- It's been on market 112 days. Have you received any prior offers? Is the seller open to a 9% concession, seller financing, or rate buy-down credit?
- Can we see the unit-by-unit rent roll, current vacancy, and any below-market leases? What's the average tenancy length?
- What capital expenditures (roof, boiler, parking lot, exteriors) have been made in the last 5 years, and what's planned in the next 2?
- Built in 1869 — when were the roof, HVAC, electrical panel, plumbing, and water heater last replaced?
- Why hasn't it sold? Are there any deal-killer items the seller is aware of (foundation, flood, title, zoning, code violations)?
- Is there a deadline driving the sale (1031 exchange, divorce, estate, relocation)? That informs how much negotiation room exists.
- Schools are B-rated — typically a magnet for longer-tenancy family renters. What's the average tenant stay here, and is there a school-zone premium baked into asking?
- Crime grade is F in this area — have there been break-ins, vandalism, or insurance claims at this property in the last 3 years? What carrier currently insures it and at what premium?
- What's the average days-on-market for RENTAL listings here right now (not sales)? A rising rental-DOM trend means longer vacancies and softer asking-rent achievability than the comps imply.
- What's the recent tenant-quality profile in this submarket — average credit score on applications, eviction rate, late-payment / NSF rate, and stable-employment percentage? A property-management company in the area should have these aggregated.
- How much new apartment / multifamily construction is in the pipeline within 1–3 miles? Heavy new supply (>2% of stock underway) typically softens rents 12–24 months out; light construction supports rent growth.
Investment metrics
- 1% rule
- 3.69% ✓
- Cap rate
- 32.99%
- Cash-on-cash
- 95.36%
- DSCR
- 5.24
- GRM
- 2.3
CMA / ARV
No comps found within radius.
Projected returns pro-forma
-3.0% appreciation · 3.0% rent growth · sell at horizon
- IRR
- 96.3%
- Equity multiple
- 5.48×
- Total profit
- $439,504
- Equity at exit
- $52,186
- IRR
- 99.0%
- Equity multiple
- 11.43×
- Total profit
- $1,022,214
- Equity at exit
- $30,262
Cash invested: $98,000 (down + closing). Projections, not guarantees.
Landlord ↔ Tenant lean methodology
- Overall (STATE)
- 73 Landlord-Friendly
- State Ohio
- 73 Landlord-Friendly · R+6
- County
- — inherits STATE
- City
- — inherits STATE
ZIP-level market 45204
- Home prices YoY
- -21.2%
- Active inventory
- 33
- Price-to-rent
- 13.5×
Monthly cashflow live
- Estimated rent
- $12,920 medium interval (Pro) →
- Mortgage (P&I)
- −$1,835
- Tax est. 1.5%
- −$438 /mo · $5,250/yr
- Insurance
- −$146
- HOA
- −$0
- Vacancy / Maint / Mgmt
- −$2,713
- Net cashflow
- $7,788
Break-even live
6-unit breakdown (identical units grouped — click to expand)
| Units | Beds | Baths | Est. rent |
|---|---|---|---|
| 6× units | 8 | — | $12,918 |
| #1 | 8 | — | $2,153 |
| #2 | 8 | — | $2,153 |
| #3 | 8 | — | $2,153 |
| #4 | 8 | — | $2,153 |
| #5 | 8 | — | $2,153 |
| #6 | 8 | — | $2,153 |
| Total (6 units) | $12,920 | ||
UW: 25.0% down · 7.5% · 30yr · 1.5% tax · 5.0% vac · 8.0% maint · 8.0% mgmt
Financing live
Cash to close
- Down payment
- $87,500
- Closing costs
- $10,500
- Reserves months
- —
- Total cash needed
- —
Loan-product check · same deal, 3 products live
Conventional
25% down · 7.5% · 30yr
- Down + closing
- —
- Monthly P&I
- —
- Monthly cashflow
- —
- DSCR
- —
- Eligible?
- —
Personal DTI + credit; lowest rate.
DSCR
20% down · 8.5% · 30yr
- Down + closing
- —
- Monthly P&I
- —
- Monthly cashflow
- —
- DSCR
- —
- Eligible?
- —
No personal income docs; deal must DSCR.
Hard money
10% down · 12.0% · 12mo
- Down + closing
- —
- Monthly P&I
- —
- Monthly cashflow
- —
- DSCR
- —
- Eligible?
- —
Short-term bridge; refi at stabilization.
Listing history 19 events
-
2026-06-18price $350,000 Active 112 DOM
-
2026-06-18days on market $450,000 Active 112 DOM
-
2026-06-17days on market $450,000 Active 111 DOM
-
2026-06-16days on market $450,000 Active 110 DOM
-
2026-06-15days on market $450,000 Active 109 DOM
-
2026-06-13days on market $450,000 Active 107 DOM
-
2026-06-13days on market $450,000 Active 106 DOM
-
2026-06-09days on market $450,000 Active 103 DOM
-
2026-06-08days on market $450,000 Active 102 DOM
-
2026-06-07days on market $450,000 Active 101 DOM
-
2026-06-03days on market $450,000 Active 97 DOM
-
2026-06-02days on market $450,000 Active 96 DOM
-
2026-06-01days on market $450,000 Active 95 DOM
-
2026-05-31days on market $450,000 Active 94 DOM
-
2026-02-26$450,000 Active
-
2011-01-11soldstatus $11,000
-
2007-01-25soldstatus $238,000
-
2000-04-04soldstatus $58,900
-
1988-06-10soldstatus $55,000
ⓘ Source: listings_history table (triggers on properties + properties_extension) + one-shot
backfill from property_details.listing_events for pre-trigger history.
Climate risk First Street
- Flood 1/10 Low FEMA zone X (unshaded) · 0% chance over 30 yrs
- Wildfire 1/10 Low
- Heat 5/10 Major 7 d/yr ≥103°F today · 20 d/yr by 30 yrs out
- Wind 2/10 Low 100% chance of damaging wind over 30 yrs
- Air quality 3/10 Moderate 3 unhealthy d/yr today · 5 by 30 yrs out
Nearby sold comps map
Loading sold comps map…
Walkable amenities ~0.75 mi
Loading nearby amenities…
Taxation est. · year 1
- Rental income
- $155,040
- − Mortgage interest
- −$19,605
- − Property taxes
- −$5,250
- − Insurance
- −$1,750
- − Repairs & maintenance
- −$12,403
- − Management
- −$12,403
- − Depreciation
- −$10,182
- Taxable income
- $93,446
- Est. tax owed @ 24.0%
- −$22,427
- After-tax cash flow
- $71,029/yr
For passive investors: Depreciation is non-cash, so a rental often shows a tax loss while cash-flowing — sheltering income. Rental losses are passive: they offset passive income freely, and up to $25,000/yr can offset ordinary (W-2) income if you actively participate and your MAGI is under $100k (phasing out to $0 by $150k); unused losses carry forward. On sale, claimed depreciation is recaptured at up to 25%, and gains may owe capital-gains tax (a 1031 exchange can defer both). Figures are a year-1 estimate at your 24.0% rate — not tax advice; consult a CPA.
Schools (NCES district)
- District
- Cincinnati Public Schools
- NCES district ID
- 3904375
- Math proficiency
- 25% ▼ -19.00%
- Reading proficiency
- 36% ▼ -14.00%
- Median HH income
- $35,743
- Composite
- 25.21/100
- National rank
- #7508
- State rank
- #581 of 656 in OH
Livability — Cincinnati
- Score
- 80/100
- State rank
- #130
- US rank
- #1856
Category grades
Schools grade is shown separately in the Schools card above.
Census & demographics
- Census place
- Cincinnati, OH
- County
- Hamilton County · 701,295 people
- City population
- 505,555
- Metro
- Cincinnati, OH-KY-IN
- Population (ZIP)
- 8,412
- Household income
- $31,236
- Rent vs Own
- Severe rent burden
- 487.0
Population outlook (Hamilton County) Hauer SSP2
- Today (2025)
- 826,054 people
- By 2030
- 830,947 · +0.6%
- By 2040
- 832,319 · +0.8%
- By 2050
- 822,428 · -0.4%
- By 2075
- 788,688 · -4.5%
- By 2100
- 710,674 · -14.0%
Race, ethnicity, and origin ACS 2023
- Neighborhood character
- Diverse neighborhood (Simpson 0.64)
- Race & ethnicity
- White 44% Black 41% Two or more races 13% Hispanic / Latino 2%
- Common ancestry
- Slovak 1% Lithuanian 1% Italian 1%
- Foreign-born
- 3% · Canada
- Languages at home
- 94% English-only · Spanish 3% Other Indo-European 2% Other Asian/Pacific 1%
Political lean MEDSL · Hamilton
- 2024 margin
- D (+14.9) · D 57.0% · R 42.1%
- 2008→2024 swing
- +7.9pp toward D · 2008: 7.0pp · 2024: 14.9pp
- All cycles
- 2024: D+14.9 2020: D+15.9 2016: D+9.5 2012: D+4.9 2008: D+7.0
Not yet ingested
- Civics
- —
Market trends
- HPI YoY
- ▼ -43.12%
- Current HPI
- 160.5953
- Rent YoY
- —
- Metro
- Cincinnati, OH-KY-IN
- State GDP YoY
- ▲ 1.98%
- F500 in state
- 48
Industry mix (Fortune 500 HQ in OH)
| Industry | F500 HQs | Revenue |
|---|---|---|
| Insurance | 3 | $145B |
|
||
| Industrial Machinery | 3 | $49B |
|
||
| Financial Services | 3 | $24B |
|
||
| Consumer Goods | 2 | $93B |
|
||
| Aerospace / Defense | 2 | $47B |
|
||
| Utilities | 2 | $33B |
|
||
Price history
+718.2% since first listed5 events — show timeline
- 2026-02-26 Listed $450,000 Cincy MLS
- 2011-01-11 Sold (Public Records) $11,000 Public Records
- 2007-01-25 Sold (Public Records) $238,000 Public Records
- 2000-04-04 Sold (Public Records) $58,900 Public Records
- 1988-06-10 Sold (Public Records) $55,000 Public Records
Property tax history
+5.4%/yrLatest (2025): $314 · -81.3% YoY. Source: county tax records.
Cash-flow waterfall
monthlySold comps — $/sqft
last 12 mo · ≤1 miLoading sold comps…