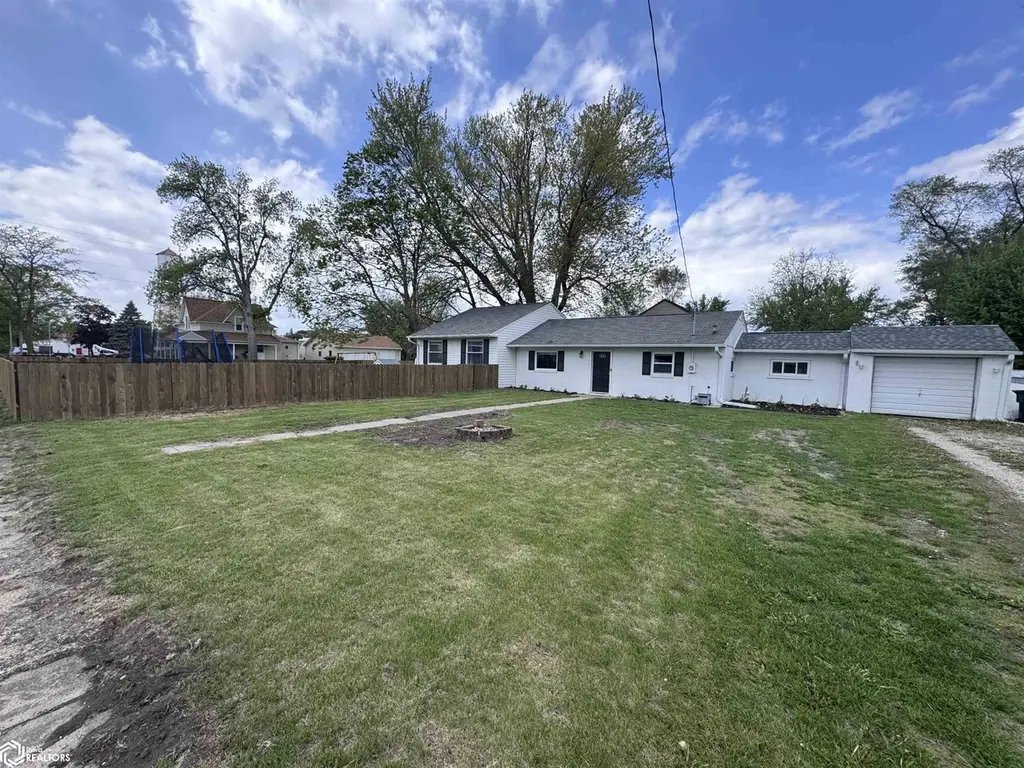
304 Broadway St · New Virginia, IA
Flood risk 1/10 · Minimal
- FEMA flood zone
- X (unshaded)
- Chance of flooding over 30 yrs
- 0.0%
- Est. flood insurance / yr
- $507 – $1,088
Fire risk 5/10 · Moderate
- Est. fire insurance / yr
- $902 – $1,676
Heat risk 3/10 · Minor
- Hot days now (above 105°F)
- 7 days/yr
- Hot days in 30 yrs
- 15 days/yr
Wind risk 2/10 · Minimal
- Chance of severe wind over 30 yrs
- —
Air-quality risk 1/10 · Minimal
- Unhealthy air days now
- 0 days/yr
- Unhealthy air days in 30 yrs
- 0 days/yr
Risk factors via First Street. Map © Google.
Why this score? — see what drove the F grade
The composite is a weighted blend of 9 inputs, each scored 0–100. Each bar is that input's sub-score; the figure is the points it added to the 100-point composite (weight × sub-score).
- Appreciation +10.0/10.0
- Cash flow +7.1/30.0
- Schools +5.5/10.0
- Livability +3.2/5.0
- Rent growth +2.5/5.0
- Condition / age +2.5/5.0
- DSCR +1.3/10.0
- 1% rule +1.1/10.0
- ARV discount +0.0/15.0
$220,000
🖨 Deal sheet (PDF) 📄 Offer letter ✓ Due diligence
Listing remarks MLS
Spacious 3 bed, 1 1/2 bath. New HVAC, flooring and paint. Updated bathrooms, nice corner lot.
Key facts
- Peaceful rural vibe
- 0.28 acre lot
- Garage
Tags
Property features AI
Exterior
- Parking: Attached garage with 1 garage space
- Utilities: Public water; Public sewer
- Home design: Single-family residence; Residential property
- Construction: Metal siding
- Exterior features: Lot approximately 0.28 acres (132 x 93); Gravel parking
Interior
- Bathrooms: 1 full bathroom; 1 half bathroom
- Interior features: Central air conditioning; Forced air heating
Neighborhood map
What this means for you Summary
Snapshot
- This is a 3-bed/1.5-bath single-family listed at $220k.
Deal economics
- At list price, monthly cash flow is $-311 ($-4k/yr) — negative.
- To cash-flow at today's rent, offer at most $165k (25.0% below list).
- To meet the 1% rule (rent ≥ 1% of price), the offer needs to be $135k (38.9% below list).
- Recommended offer: $135k (38.9% below list) — sets the bar for 1% rule.
Location & tenants
- Location reads 64/100 on livability (#630 in IA) — a middle-class / working-renter tenant base. Strengths: cost of living A+, housing A+; Watch: amenities F, commute F, health & safety F.
- Interstate 35 Community School District (rural): math 60% / reading 66% proficiency, ranked #197 of 289 in IA (top 68%) — acceptable for families but not a draw, mixed tenant base, ~2y average lease.
- Zoned schools: Interstate 35 Elementary School (math 62% / reading 47%, grade C, #462 of 616 statewide, top 79%, 334 students, 25% FRL); Interstate 35 Middle School (math 58% / reading 72%, grade A-, #154 of 246 statewide, top 63%, 234 students, 28% FRL); Interstate 35 High School (math 62% / reading 67%, grade B-, #211 of 336 statewide, top 70%, 274 students, 20% FRL) — zoned schools at 24% FRL track the district average.
- Market conditions: 22 active listings in the ZIP; 439 units permitted in Warren County in 2024 (0 in 5+ unit buildings).
Forward outlook
- In year one you build about $24k of equity ($2k loan paydown + $22k appreciation (10.0% local appreciation)).
- Warren County population projected at +22% by 2050 — long-run rental-demand tailwind backs the buy-and-hold thesis.
- By year 2, paydown + projected appreciation supports a ~$38k cash-out refi (75% LTV) — recoverable capital for the next deal without selling this one.
Negotiation context
- It's been on market 22 days — a 2% lower offer ($217k) is reasonable based on typical stale-listing flexibility.
- 9 sale attempts since 21y ago; this cycle's ask is 10% above the opening price — seller raised mid-cycle; expect resistance to lowballs.
- Current owner paid $155k; 42% above their basis — modest negotiation headroom, anchor on the comps not their cost.
Risks & watch-outs
- Watch-outs: built in 1951 — expect roof / HVAC / electrical / plumbing capex.
- Climate carrying-cost: moderate wildfire risk — expect insurance premiums to compound above CPI over the hold.
Questions for the listing agent
- What do current leases actually rent for vs. the listed asking? Can we see a recent rent roll and the last 12 months of T-12 income?
- Built in 1951 — when were the roof, HVAC, electrical panel, plumbing, and water heater last replaced?
- Is there a deadline driving the sale (1031 exchange, divorce, estate, relocation)? That informs how much negotiation room exists.
- Schools are D-rated, which usually means shorter tenancies and higher turnover. Who's the typical renter profile here, and what's been the actual vacancy rate?
- The area grade is low — what's the realistic commute time and amenity access for the typical tenant pool here? Any planned neighborhood developments (good or bad) we should know about?
- What's the average days-on-market for RENTAL listings here right now (not sales)? A rising rental-DOM trend means longer vacancies and softer asking-rent achievability than the comps imply.
- What's the recent tenant-quality profile in this submarket — average credit score on applications, eviction rate, late-payment / NSF rate, and stable-employment percentage? A property-management company in the area should have these aggregated.
- How much new for-sale + rental construction is in the pipeline within 1–3 miles? Heavy new supply typically softens prices + rents 12–24 months out; constrained supply supports both.
Investment metrics
- 1% rule
- 0.61% ✗
- Cap rate
- 4.60%
- Cash-on-cash
- -6.06%
- DSCR
- 0.73
- GRM
- 13.6
CMA / ARV
- ARV (median comp)
- $187,336
- List price
- $220,000
- Delta
- 17.44%
- Verdict
- OVERPRICED
- Comps
- 20 within 1.0 mi
Show comp detail 7 sales within ~0.75 mi
| Address | Dist | Beds/Ba | Sqft | Sold | Price | $/sf | Match |
|---|---|---|---|---|---|---|---|
| 604 West St | 0.17mi | 3/1.0 | 1,412 (+5%) | 9mo | $167,000 | $118 | 75 |
| 425 N Westview | 0.47mi | 2/2.0 (-1) | 1,360 (+1%) | 1mo | $289,000 | $213 | 69 |
| 813 West St | 0.36mi | 3/2.0 | 1,299 (-4%) | 14mo | $190,000 | $146 | 64 |
| 111 Main St | 0.19mi | 4/1.0 (+1) | 1,215 (-10%) | 6mo | $105,000 | $86 | 63 |
| 605 & 607 Grand St | 0.18mi | 3/1.0 | 1,176 (-13%) | 10mo | $195,000 | $166 | 60 |
| 602 Maple St | 0.37mi | 3/2.0 | 1,404 (+4%) | 22mo | $175,000 | $125 | 56 |
| 801 East St | 0.25mi | 3/1.0 | 1,152 (-14%) | 18mo | $160,000 | $139 | 47 |
Match score weights: distance 35% · size 25% · config 20% · recency 20%. Top-matched comps best support the ARV.
Projected returns pro-forma
10.0% appreciation · 3.0% rent growth · sell at horizon
- IRR
- 20.0%
- Equity multiple
- 2.62×
- Total profit
- $99,932
- Equity at exit
- $198,193
- IRR
- 18.3%
- Equity multiple
- 6.03×
- Total profit
- $309,727
- Equity at exit
- $427,412
Cash invested: $61,600 (down + closing). Projections, not guarantees.
Landlord ↔ Tenant lean methodology
- Overall (STATE)
- 83 Strongly Landlord-Friendly
- State Iowa
- 83 Strongly Landlord-Friendly · R+6
- County
- — inherits STATE
- City
- — inherits STATE
ZIP-level market 50210
- Home prices YoY
- 4.7%
- Active inventory
- 22
- Price-to-rent
- 13.6×
Monthly cashflow live
- Estimated rent
- $1,345 medium interval (Pro) →
- Mortgage (P&I)
- −$1,154
- Tax from tax record
- −$128 /mo · $1,540/yr
- Insurance
- −$92
- HOA
- −$0
- Lot rent
- −$0
- Vacancy / Maint / Mgmt
- −$282
- Net cashflow
- $-311
Break-even live
Sensitivity live
| Price | -10% $-187 | -5% $-249 | +0% $-311 | +5% $-373 | +10% $-436 |
|---|---|---|---|---|---|
| Rent | -10% $-417 | -5% $-364 | +0% $-311 | +5% $-258 | +10% $-205 |
| Rate | -1.0pp $-200 | -0.5pp $-255 | base $-311 | +0.5pp $-368 | +1.0pp $-426 |
UW: 25.0% down · 7.5% · 30yr · 1.5% tax · 5.0% vac · 8.0% maint · 8.0% mgmt
Financing live
Cash to close
- Down payment
- $55,000
- Closing costs
- $6,600
- Reserves months
- —
- Total cash needed
- —
Loan-product check · same deal, 3 products live
Conventional
25% down · 7.5% · 30yr
- Down + closing
- —
- Monthly P&I
- —
- Monthly cashflow
- —
- DSCR
- —
- Eligible?
- —
Personal DTI + credit; lowest rate.
DSCR
20% down · 8.5% · 30yr
- Down + closing
- —
- Monthly P&I
- —
- Monthly cashflow
- —
- DSCR
- —
- Eligible?
- —
No personal income docs; deal must DSCR.
Hard money
10% down · 12.0% · 12mo
- Down + closing
- —
- Monthly P&I
- —
- Monthly cashflow
- —
- DSCR
- —
- Eligible?
- —
Short-term bridge; refi at stabilization.
Listing history 22 events
-
2026-06-23days on market $220,000 Active 22 DOM
-
2026-06-22price $220,000 Active 21 DOM
-
2026-06-21statusdays on market $199,900 Active 21 DOM
-
2026-05-01$199,900 Active 406-char remark
-
2021-12-20soldstatus $155,000
-
2021-12-17soldstatus $154,900 Closed
Show marketing remark (93 chars)
Spacious 3 bed, 1 1/2 bath. New HVAC, flooring and paint. Updated bathrooms, nice corner lot.
-
2021-10-19status Pending
Show marketing remark (93 chars)
Spacious 3 bed, 1 1/2 bath. New HVAC, flooring and paint. Updated bathrooms, nice corner lot.
-
2021-09-27$154,900 Active
Show marketing remark (93 chars)
Spacious 3 bed, 1 1/2 bath. New HVAC, flooring and paint. Updated bathrooms, nice corner lot.
-
2021-05-10soldstatus $117,500
-
2017-07-05soldstatus $70,000
-
2017-06-30soldstatus $69,900
-
2017-04-17$69,900
-
2017-03-31historical
-
2016-09-19$82,000
-
2016-09-19$82,000
-
2016-04-28soldstatus $29,000
-
2016-04-28soldstatus $29,000
-
2016-02-24$29,900
-
2016-02-24$29,900
-
2006-09-11soldstatus $59,900
-
2006-02-16soldstatus $64,500
-
2005-07-29$59,900
ⓘ Source: listings_history table (triggers on properties + properties_extension) + one-shot
backfill from property_details.listing_events for pre-trigger history.
Tax reassessment forecast IA · Partial reset (capped growth)
- Current annual tax
- $1,540 · $128/mo
- Projected year-2 tax
- $2,497 · $208/mo
- Expected delta
- +$957/yr (+$80/mo · 62.1%)
ⓘ Screening estimate from a state-policy table — verify with the county assessor before closing.
Climate risk First Street
- Flood 1/10 Low FEMA zone X (unshaded) · 0% chance over 30 yrs
- Wildfire 5/10 Major
- Heat 3/10 Moderate 7 d/yr ≥105°F today · 15 d/yr by 30 yrs out
- Wind 2/10 Low
- Air quality 1/10 Low 0 unhealthy d/yr today · 0 by 30 yrs out
Nearby sold comps map
Loading sold comps map…
Walkable amenities ~0.75 mi
Loading nearby amenities…
Taxation est. · year 1
- Rental income
- $16,140
- − Mortgage interest
- −$12,323
- − Property taxes
- −$1,540
- − Insurance
- −$1,100
- − Repairs & maintenance
- −$1,291
- − Management
- −$1,291
- − Depreciation
- −$6,400
- Taxable loss
- −$7,806
- Est. tax savings @ 24.0%
- +$1,873
- After-tax cash flow
- $-1,860/yr
For passive investors: Depreciation is non-cash, so a rental often shows a tax loss while cash-flowing — sheltering income. Rental losses are passive: they offset passive income freely, and up to $25,000/yr can offset ordinary (W-2) income if you actively participate and your MAGI is under $100k (phasing out to $0 by $150k); unused losses carry forward. On sale, claimed depreciation is recaptured at up to 25%, and gains may owe capital-gains tax (a 1031 exchange can defer both). Figures are a year-1 estimate at your 24.0% rate — not tax advice; consult a CPA.
Schools (NCES district)
- District
- Interstate 35 Community School District
- NCES district ID
- 1914670
- Math proficiency
- 60% ▼ -8.00%
- Reading proficiency
- 66% ▼ -1.00%
- Median HH income
- $64,996
- Composite
- 54.98/100
- National rank
- #1300
- State rank
- #197 of 289 in IA
Livability — New Virginia
- Score
- 64/100
- State rank
- #630
- US rank
- #14644
Category grades
Schools grade is shown separately in the Schools card above.
Census & demographics
- Census place
- New Virginia, IA
- Population (ZIP)
- 1,503
Population outlook (Warren County) Hauer SSP2
- Today (2025)
- 54,222 people
- By 2030
- 56,863 · +4.9%
- By 2040
- 61,691 · +13.8%
- By 2050
- 65,939 · +21.6%
- By 2075
- 75,626 · +39.5%
- By 2100
- 80,425 · +48.3%
Race, ethnicity, and origin ACS 2023
- Neighborhood character
- Predominantly White (90%)
- Race & ethnicity
- White 90% Hispanic / Latino 8% Two or more races 5%
- Hispanic origin (detail)
- Mexican 6%
- Common ancestry
- Italian 8% Portuguese 4% Scottish 2%
- Foreign-born
- 1% · Canada, Jamaica
- Languages at home
- 98% English-only · Spanish 2%
Political lean MEDSL · Warren
- 2024 margin
- Strong R (+20.7) · D 38.9% · R 59.7% · Other 1.4%
- 2008→2024 swing
- -21.4pp toward R · 2008: 0.6pp · 2024: -20.7pp
- All cycles
- 2024: R+20.7 2020: R+16.8 2016: R+16.4 2012: R+2.0 2008: D+0.6
Not yet ingested
- Civics
- —
Market trends
- HPI YoY
- ▲ 12.40%
- Current HPI
- 274.1726
- Rent YoY
- —
- Metro
- —
- State GDP YoY
- ▲ 2.48%
- F500 in state
- 4
Industry mix (Fortune 500 HQ in IA)
| Industry | F500 HQs | Revenue |
|---|---|---|
| Financial Services | 1 | $16B |
|
||
| Retail / Convenience | 1 | $15B |
|
||
Price history
+233.7% since first listed21 events — show timeline
- 2026-06-10 Relisted — IAR
- 2026-05-21 Pending — IAR
- 2026-05-01 Listed $199,900 IAR
- 2021-12-20 Sold (Public Records) $155,000 Public Records
- 2021-12-17 Sold (MLS) $154,900 DMMLS
- 2021-10-19 Pending — DMMLS
- 2021-09-27 Listed $154,900 DMMLS
- 2021-05-10 Sold (Public Records) $117,500 Public Records
- 2017-07-05 Sold (Public Records) $70,000 Public Records
- 2017-06-30 Sold (MLS) $69,900 DMMLS
- 2017-04-17 Listed $69,900 DMMLS
- 2017-03-31 Listing Removed — NORTHSTARMLS as Distributed by MLS Grid
- 2016-09-19 Listed $82,000 NORTHSTARMLS as Distributed by MLS Grid
- 2016-09-19 Listed $82,000 IAR
- 2016-04-28 Sold (MLS) $29,000 IAR
- 2016-04-28 Sold (MLS) $29,000 NORTHSTARMLS as Distributed by MLS Grid
- 2016-02-24 Listed $29,900 IAR
- 2016-02-24 Listed $29,900 NORTHSTARMLS as Distributed by MLS Grid
- 2006-09-11 Sold (Public Records) $59,900 Public Records
- 2006-02-16 Sold (Public Records) $64,500 Public Records
- 2005-07-29 Listed $59,900 DMMLS
Property tax history
+3.8%/yrLatest (2025): $1,540 · -2.2% YoY. Source: county tax records.
Cash-flow waterfall
monthlySold comps — $/sqft
last 12 mo · ≤1 miLoading sold comps…