740 Sweetgum Trl · Redding, CA
Flood risk 1/10 · Minimal
- FEMA flood zone
- X (unshaded)
- Chance of flooding over 30 yrs
- 0.0%
- Est. flood insurance / yr
- $507 – $1,088
Fire risk 7/10 · Major
- Est. fire insurance / yr
- $659 – $1,223
Heat risk 8/10 · Major
- Hot days now (above 106°F)
- 7 days/yr
- Hot days in 30 yrs
- 18 days/yr
Wind risk 1/10 · Minimal
- Chance of severe wind over 30 yrs
- —
Air-quality risk 10/10 · Severe
- Unhealthy air days now
- 37 days/yr
- Unhealthy air days in 30 yrs
- 40 days/yr
Risk factors via First Street. Map © Google.
Why this score? — see what drove the D+ grade
The composite is a weighted blend of 9 inputs, each scored 0–100. Each bar is that input's sub-score; the figure is the points it added to the 100-point composite (weight × sub-score).
- Cash flow +16.4/30.0
- ARV discount +7.5/15.0
- DSCR +5.1/10.0
- Condition / age +4.8/5.0
- 1% rule +4.5/10.0
- Rent growth +4.0/5.0
- Livability +3.8/5.0
- Schools +2.5/10.0
- Appreciation +0.0/10.0
$158,900
🖨 Deal sheet 📄 Offer letter ✓ Due diligence
Listing remarks MLS
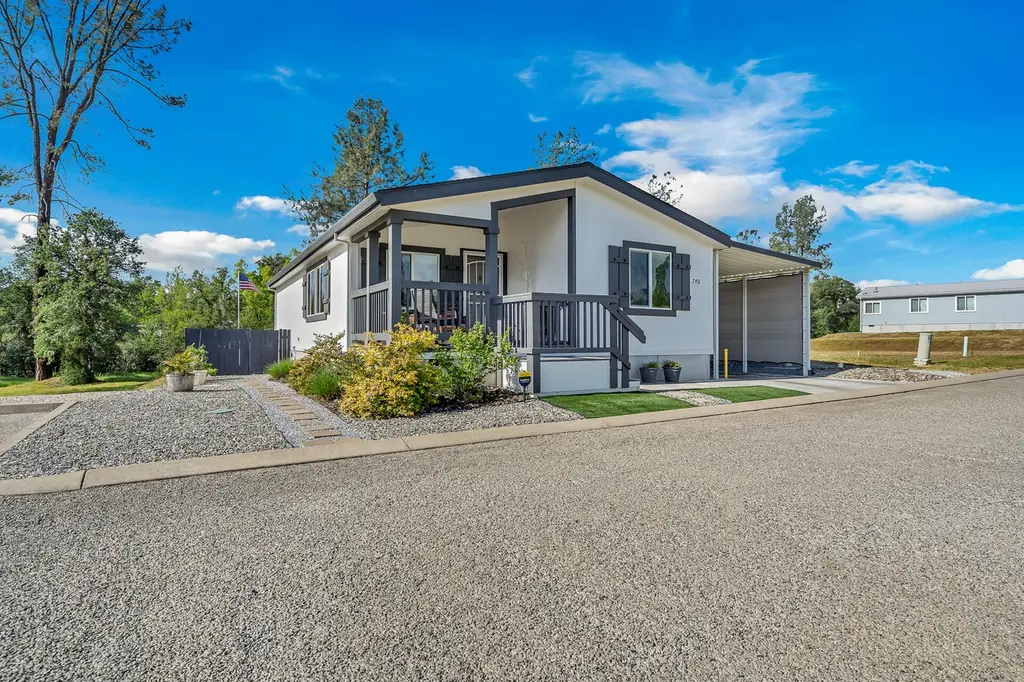
Welcome to 740 Sweetgum Trl where you will find this 2020 custom-built, Skyline Manufactured Home with concrete perimeter enclosure, 2x6 sidewall construction, and energy star certification. This home is located in the desirable Los Robles Estates, a 55+ community. Highlighted features include; kitchen quartz countertops, stainless steel kitchen appliances, hardwood cabinets, laminate flooring, vaulted ceilings, custom window blinds, tented blocking UV windows and much more. Step outside to enjoy a covered front porch for morning coffee or unwind in a meticulous designed and kept private backyard. Full extended carport with shade screens allows ample parking. Los Robles community has a clubhouse and swimming pool to enjoy events and leisure activities. This peaceful setting home shows like new with all the work done for move-in ready living.
Key facts
- Hardwood cabinets
- Custom built
- Lvp flooring
Tags
Neighborhood map
What this means for you Summary
Snapshot
- This is a 2-bed/2.0-bath manufactured listed at $159k. Condition is rated excellent.
Deal economics
- At list price, monthly cash flow is $91 ($1k/yr) — positive.
- The deal already cash-flows at list — no discount required.
- To meet the 1% rule (rent ≥ 1% of price), the offer needs to be $151k (5.2% below list).
- Recommended offer: $151k (5.2% below list) — sets the bar for 1% rule.
- Cap rate 7.0% vs local median 3.3% in Redding — top-decile yield for the area; either an underpriced asset or a hidden risk that comps aren't pricing in. Stress-test before assuming the spread holds.
Location & tenants
- Location reads 76/100 on livability (#106 in CA, #3,726 nationally) — a middle-class / working-renter tenant base. Strengths: amenities A+, commute A+, health & safety A+; Watch: employment C-, crime F, cost of living F.
- Gateway Unified (suburban): math 25% / reading 35% proficiency, ranked #355 of 517 in CA (top 69%) — families likely to look elsewhere, expect single-tenant / working-renter base with shorter leases.
- Market conditions: Rents rising fast (+6.0%/yr); 391 active listings in the ZIP; 18 comparable units currently listed for rent nearby; rentals at typical pace (median 21d on market — plan ~3-4 weeks tenant-placement turnaround); 246 units permitted in Shasta County in 2024 (0 in 5+ unit buildings).
Forward outlook
- Local home prices are declining (-3.0%/yr); year-one equity from $1k of loan paydown is wiped out by about $5k of value loss. Plan a longer hold.
- Shasta County population projected to shrink 9% by 2050 — rents likely to lag national; underwrite the cash flow, not the appreciation.
Negotiation context
- It's been on market 34 days — a 3% lower offer ($154k) is reasonable based on typical stale-listing flexibility.
Risks & watch-outs
- Climate carrying-cost: major wildfire risk; extreme-heat days projected 7→18/yr by 2055 (HVAC capex compounding) — expect insurance premiums to compound above CPI over the hold.
Questions for the listing agent
- It's been on market 34 days. Have you received any prior offers? Is the seller open to a 5% concession, seller financing, or rate buy-down credit?
- Is there a deadline driving the sale (1031 exchange, divorce, estate, relocation)? That informs how much negotiation room exists.
- Schools are B-rated — typically a magnet for longer-tenancy family renters. What's the average tenant stay here, and is there a school-zone premium baked into asking?
- Crime grade is F in this area — have there been break-ins, vandalism, or insurance claims at this property in the last 3 years? What carrier currently insures it and at what premium?
- The area grade is low — what's the realistic commute time and amenity access for the typical tenant pool here? Any planned neighborhood developments (good or bad) we should know about?
- What's the average days-on-market for RENTAL listings here right now (not sales)? A rising rental-DOM trend means longer vacancies and softer asking-rent achievability than the comps imply.
- What's the recent tenant-quality profile in this submarket — average credit score on applications, eviction rate, late-payment / NSF rate, and stable-employment percentage? A property-management company in the area should have these aggregated.
- How much new for-sale + rental construction is in the pipeline within 1–3 miles? Heavy new supply typically softens prices + rents 12–24 months out; constrained supply supports both.
Investment metrics
- 1% rule
- 0.95% ✗
- Cap rate
- 6.98%
- Cash-on-cash
- 2.46%
- DSCR
- 1.11
- GRM
- 8.8
CMA / ARV
- ARV (median comp)
- $69,950
- List price
- $158,900
- Delta
- 127.16%
- Verdict
- OVERPRICED
- Comps
- 16 within 1.0 mi
Show comp detail 12 sales within ~0.75 mi
| Address | Dist | Beds/Ba | Sqft | Sold | Price | $/sf | Match |
|---|---|---|---|---|---|---|---|
| 432 Red Cedar DR Sp#91 Dr | 0.16mi | 2/2.0 | 1,040 (+1%) | 9mo | $80,500 | $77 | 84 |
| 493 Bitterroot Dr. Dr #46 | 0.18mi | 2/2.0 | 1,040 (+1%) | 10mo | $60,000 | $58 | 82 |
| 472 Red Cedar Dr #86 | 0.14mi | 2/2.0 | 1,080 (+4%) | 8mo | $40,000 | $37 | 79 |
| 4824 Pecan Dr #51 | 0.12mi | 2/— | 1,120 (+8%) | 11mo | $66,530 | $59 | 71 |
| 426 Milkwood Dr #188 | 0.14mi | 3/2.0 (+1) | 928 (-10%) | 1mo | $57,000 | $61 | 71 |
| 1187 Mountain Shadows Blvd #162 | 0.33mi | 2/1.0 | 980 (-5%) | 4mo | $64,000 | $65 | 69 |
| 4518 Big Eagle Ln | 0.35mi | 2/2.0 | 1,056 (+2%) | 14mo | $85,000 | $80 | 68 |
| 1120 Shawnee Trl | 0.44mi | 2/2.0 | 976 (-6%) | 5mo | $109,500 | $112 | 66 |
| 1318 Mountain Shadows Blvd #255 | 0.24mi | 3/2.0 (+1) | 1,144 (+11%) | 2mo | $95,000 | $83 | 64 |
| 4717 Hardwood Blvd #242 | 0.16mi | 2/2.0 | 1,176 (+14%) | 9mo | $75,000 | $64 | 62 |
| 888 Shawnee Trl | 0.45mi | 2/2.0 | 1,080 (+4%) | 11mo | $95,000 | $88 | 62 |
| 1269 Mountain Shadows Blvd | 0.28mi | 2/2.0 | 896 (-13%) | 6mo | $52,500 | $59 | 60 |
Match score weights: distance 35% · size 25% · config 20% · recency 20%. Top-matched comps best support the ARV.
Projected returns pro-forma
-3.0% appreciation · 5.98% rent growth · sell at horizon
- IRR
- -9.1%
- Equity multiple
- 0.66×
- Total profit
- $-15,257
- Equity at exit
- $23,693
- IRR
- 4.0%
- Equity multiple
- 1.33×
- Total profit
- $14,584
- Equity at exit
- $13,739
Cash invested: $44,492 (down + closing). Projections, not guarantees.
Landlord ↔ Tenant lean methodology
- Overall (STATE)
- 18 Strongly Tenant-Friendly
- State California
- 18 Strongly Tenant-Friendly · D+13
- County
- — inherits STATE
- City
- — inherits STATE
ZIP-level market 96003
- Rents YoY
- 6.0%
- Active inventory
- 391
- Price-to-rent
- 8.8×
Monthly cashflow live
- Estimated rent
- $1,506 high interval (Pro) →
- Mortgage (P&I)
- −$833
- Tax est. 1.5%
- −$199 /mo · $2,384/yr
- Insurance
- −$66
- HOA
- −$0
- Vacancy / Maint / Mgmt
- −$316
- Net cashflow
- $91
Break-even live
UW: 25.0% down · 7.5% · 30yr · 1.5% tax · 5.0% vac · 8.0% maint · 8.0% mgmt
Financing live
Cash to close
- Down payment
- $39,725
- Closing costs
- $4,767
- Reserves months
- —
- Total cash needed
- —
Loan-product check · same deal, 3 products live
Conventional
25% down · 7.5% · 30yr
- Down + closing
- —
- Monthly P&I
- —
- Monthly cashflow
- —
- DSCR
- —
- Eligible?
- —
Personal DTI + credit; lowest rate.
DSCR
20% down · 8.5% · 30yr
- Down + closing
- —
- Monthly P&I
- —
- Monthly cashflow
- —
- DSCR
- —
- Eligible?
- —
No personal income docs; deal must DSCR.
Hard money
10% down · 12.0% · 12mo
- Down + closing
- —
- Monthly P&I
- —
- Monthly cashflow
- —
- DSCR
- —
- Eligible?
- —
Short-term bridge; refi at stabilization.
Rent comps 18 comps
| Address | Beds | Baths | Sqft | Rent | $/sqft | DOM | Units | Dist |
|---|---|---|---|---|---|---|---|---|
| 701 Redwood Blvd Redding, CA | 2.0 | 1.5–2.5 | 1163 | $1,820 | $1.56 | 13d | 1 | 0.25mi |
| 4490 Alder St Unit C Redding, CA | 2.0 | 1.0 | 900 | $1,150 | $1.28 | 21d | 1 | 0.33mi |
| 4433 White River Dr Redding, CA | 2.0 | 2.0 | 1100 | $1,500 | $1.36 | 43d | 1 | 0.38mi |
| 4296 Clay St Unit 17 Redding, CA | 2.0 | 1.5 | 900 | $1,395 | $1.55 | 21d | 1 | 0.41mi |
| 400 Lake Blvd Redding, CA | 2.0 | 1.5 | 900 | $1,310 | $1.46 | 13d | 1 | 0.44mi |
| 335 Buckeye Ter Unit 2 Redding, CA | 2.0 | 1.5 | 800 | $1,399 | $1.75 | 21d | 1 | 0.52mi |
| 5391 Stonethrow Ct Redding, CA | 3.0 | 2.0 | 1100 | $1,895 | $1.72 | 43d | 1 | 0.58mi |
| 130 Masonic Ave Apt 9 Redding, CA | 2.0 | 1.0 | 780 | $1,200 | $1.54 | 43d | 1 | 0.62mi |
| 150 Masonic Ave Unit 1 Redding, CA | 2.0 | 1.5 | 924 | $1,400 | $1.52 | 13d | 1 | 0.65mi |
| 170 Masonic Ave #4 Redding, CA | 2.0 | 1.5 | 924 | $1,400 | $1.52 | 13d | 1 | 0.66mi |
| 4288 Bradley Dr Redding, CA | 3.0 | 2.0 | 1008 | $1,950 | $1.93 | 21d | 1 | 0.66mi |
| 636 Lake Blvd Redding, CA | 2.0–3.0 | 1.0–2.0 | 986 | $1,295 | $1.31 | 13d | 8 | 0.67mi |
| 333 Boulder Creek Dr Redding, CA | 1.0–2.0 | 1.0 | 780 | $1,000 | $1.28 | 13d | 1 | 0.79mi |
| 5576 Mountain View Dr Redding, CA | 2.0 | 1.0 | 776 | $1,200 | $1.55 | 13d | 1 | 0.82mi |
| 251 Hilltop Dr Redding, CA | 1.0–2.0 | 1.0–2.0 | 757 | $1,475 | $1.95 | 13d | 1 | 0.95mi |
| 3465 Magnums Way Apt 2 Redding, CA | 3.0 | 2.0 | 1080 | $1,775 | $1.64 | 43d | 1 | 1.25mi |
| 1477 Mishka Ct Apt 3 Redding, CA | 2.0 | 1.5 | 800 | $1,225 | $1.53 | 21d | 1 | 1.41mi |
| 500 Hilltop Dr Redding, CA | 2.0–3.0 | 2.0–3.0 | 1282 | $1,700 | $1.33 | 13d | 4 | 1.47mi |
Listing history 4 events
-
2026-05-15status Pending 854-char remark
Show marketing remark (854 chars)
Welcome to 740 Sweetgum Trl where you will find this 2020 custom-built, Skyline Manufactured Home with concrete perimeter enclosure, 2x6 sidewall construction, and energy star certification. This home is located in the desirable Los Robles Estates, a 55+ community. Highlighted features include; kitchen quartz countertops, stainless steel kitchen appliances, hardwood cabinets, laminate flooring, vaulted ceilings, custom window blinds, tented blocking UV windows and much more. Step outside to enjoy a covered front porch for morning coffee or unwind in a meticulous designed and kept private backyard. Full extended carport with shade screens allows ample parking. Los Robles community has a clubhouse and swimming pool to enjoy events and leisure activities. This peaceful setting home shows like new with all the work done for move-in ready living.
-
2026-05-01price $158,900 854-char remark
Show marketing remark (854 chars)
Welcome to 740 Sweetgum Trl where you will find this 2020 custom-built, Skyline Manufactured Home with concrete perimeter enclosure, 2x6 sidewall construction, and energy star certification. This home is located in the desirable Los Robles Estates, a 55+ community. Highlighted features include; kitchen quartz countertops, stainless steel kitchen appliances, hardwood cabinets, laminate flooring, vaulted ceilings, custom window blinds, tented blocking UV windows and much more. Step outside to enjoy a covered front porch for morning coffee or unwind in a meticulous designed and kept private backyard. Full extended carport with shade screens allows ample parking. Los Robles community has a clubhouse and swimming pool to enjoy events and leisure activities. This peaceful setting home shows like new with all the work done for move-in ready living.
-
2026-04-17price $174,900 854-char remark
Show marketing remark (854 chars)
Welcome to 740 Sweetgum Trl where you will find this 2020 custom-built, Skyline Manufactured Home with concrete perimeter enclosure, 2x6 sidewall construction, and energy star certification. This home is located in the desirable Los Robles Estates, a 55+ community. Highlighted features include; kitchen quartz countertops, stainless steel kitchen appliances, hardwood cabinets, laminate flooring, vaulted ceilings, custom window blinds, tented blocking UV windows and much more. Step outside to enjoy a covered front porch for morning coffee or unwind in a meticulous designed and kept private backyard. Full extended carport with shade screens allows ample parking. Los Robles community has a clubhouse and swimming pool to enjoy events and leisure activities. This peaceful setting home shows like new with all the work done for move-in ready living.
-
2026-04-10$184,900 Active 854-char remark
Show marketing remark (854 chars)
Welcome to 740 Sweetgum Trl where you will find this 2020 custom-built, Skyline Manufactured Home with concrete perimeter enclosure, 2x6 sidewall construction, and energy star certification. This home is located in the desirable Los Robles Estates, a 55+ community. Highlighted features include; kitchen quartz countertops, stainless steel kitchen appliances, hardwood cabinets, laminate flooring, vaulted ceilings, custom window blinds, tented blocking UV windows and much more. Step outside to enjoy a covered front porch for morning coffee or unwind in a meticulous designed and kept private backyard. Full extended carport with shade screens allows ample parking. Los Robles community has a clubhouse and swimming pool to enjoy events and leisure activities. This peaceful setting home shows like new with all the work done for move-in ready living.
ⓘ Source: listings_history table (triggers on properties + properties_extension) + one-shot
backfill from property_details.listing_events for pre-trigger history.
Climate risk First Street
- Flood 1/10 Low FEMA zone X (unshaded) · 0% chance over 30 yrs
- Wildfire 7/10 Severe
- Heat 8/10 Severe 7 d/yr ≥106°F today · 18 d/yr by 30 yrs out
- Wind 1/10 Low
- Air quality 10/10 Extreme 37 unhealthy d/yr today · 40 by 30 yrs out
Nearby sold comps map
Loading sold comps map…
Walkable amenities ~0.75 mi
Loading nearby amenities…
Taxation est. · year 1
- Rental income
- $18,068
- − Mortgage interest
- −$8,901
- − Property taxes
- −$2,384
- − Insurance
- −$794
- − Repairs & maintenance
- −$1,445
- − Management
- −$1,445
- − Depreciation
- −$4,623
- Taxable loss
- −$1,524
- Est. tax savings @ 24.0%
- +$366
- After-tax cash flow
- $1,462/yr
For passive investors: Depreciation is non-cash, so a rental often shows a tax loss while cash-flowing — sheltering income. Rental losses are passive: they offset passive income freely, and up to $25,000/yr can offset ordinary (W-2) income if you actively participate and your MAGI is under $100k (phasing out to $0 by $150k); unused losses carry forward. On sale, claimed depreciation is recaptured at up to 25%, and gains may owe capital-gains tax (a 1031 exchange can defer both). Figures are a year-1 estimate at your 24.0% rate — not tax advice; consult a CPA.
Condition & rehab AI · 12 photos
This 2020 custom-built Skyline Manufactured Home in Los Robles Estates is in excellent condition with no visible repairs needed. It offers a well-maintained exterior, spacious living areas, and a private backyard. Consider landscaping and painting to further enhance its curb appeal and value.
Value-add opportunities
- Both Landscaping — Enhances curb appeal and adds value
- Both Painting exterior — Fresh paint can improve curb appeal and value
- Both Landscaping around shed — Improves overall curb appeal and adds value
Renovation cost estimate screening
Value-add ROI direction
- Both Landscaping — Enhances curb appeal and adds value ↑
- Both Painting exterior — Fresh paint can improve curb appeal and value ↑
- Both Landscaping around shed — Improves overall curb appeal and adds value ↑
ⓘ Cost ranges are severity-bucket heuristics (US national rule-of-thumb). Get contractor quotes + a written scope before underwriting a rehab budget.
Schools (NCES district)
- District
- Gateway Unified
- NCES district ID
- 0614950
- Math proficiency
- 25% ▼ -5.00%
- Reading proficiency
- 35% ▲ 2.00%
- Median HH income
- $41,888
- Composite
- 25.39/100
- National rank
- #7465
- State rank
- #355 of 517 in CA
Livability — Redding
- Score
- 76/100
- State rank
- #106
- US rank
- #3726
Category grades
Schools grade is shown separately in the Schools card above.
Census & demographics
- Census place
- Redding, CA
- County
- Shasta County · 147,641 people
- City population
- 112,523
- Metro
- Redding, CA
- Population (ZIP)
- 44,923
- Household income
- $72,445
- Rent vs Own
- Severe rent burden
- 1668.0
Population outlook (Shasta County) Hauer SSP2
- Today (2025)
- 179,231 people
- By 2030
- 176,953 · -1.3%
- By 2040
- 169,982 · -5.2%
- By 2050
- 162,547 · -9.3%
- By 2075
- 145,649 · -18.7%
- By 2100
- 123,025 · -31.4%
Race, ethnicity, and origin ACS 2023
- Neighborhood character
- Predominantly White (76%)
- Race & ethnicity
- White 76% Hispanic / Latino 11% Two or more races 10% Asian 4% Native American 1% Black 1%
- Hispanic origin (detail)
- Mexican 7%
- Common ancestry
- Italian 5% Slovak 3% Lithuanian 3%
- Foreign-born
- 6% · Canada, China
- Languages at home
- 92% English-only · Spanish 3% German/W. Germanic 1% Other Asian/Pacific 1%
Political lean MEDSL · Shasta
- 2024 margin
- Solid R (+36.5) · D 30.5% · R 67.0% · Other 2.5%
- 2008→2024 swing
- -10.7pp toward R · 2008: -25.8pp · 2024: -36.5pp
- All cycles
- 2024: R+36.5 2020: R+33.1 2016: R+37.4 2012: R+30.3 2008: R+25.8
Not yet ingested
- Civics
- —
Market trends
- HPI YoY
- ▼ -181.66%
- Current HPI
- 152.3069
- Rent YoY
- ▲ 5.98%
- Metro
- Redding, CA
- State GDP YoY
- ▲ 3.21%
- F500 in state
- 116
Industry mix (Fortune 500 HQ in CA)
| Industry | F500 HQs | Revenue |
|---|---|---|
| Technology | 27 | $1,492B |
|
||
| Financial Services | 3 | $174B |
|
||
| Retail | 3 | $44B |
|
||
| Insurance | 3 | $26B |
|
||
| Media / Entertainment | 2 | $115B |
|
||
| Pharmaceuticals / Biotech | 2 | $62B |
|
||
Price history
-14.1% since first listed4 events — show timeline
- 2026-05-15 Pending — SAOR
- 2026-05-01 Price Changed $158,900 SAOR
- 2026-04-17 Price Changed $174,900 SAOR
- 2026-04-10 Listed $184,900 SAOR
Cash-flow waterfall
monthlySold comps — $/sqft
last 12 mo · ≤1 miLoading sold comps…