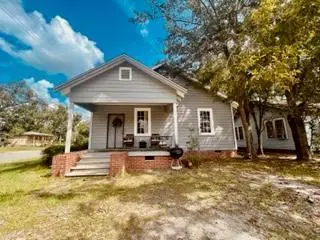
519 N Lee St · Valdosta, GA
Flood risk 1/10 · Minimal
- FEMA flood zone
- X (unshaded)
- Chance of flooding over 30 yrs
- 0.0%
- Est. flood insurance / yr
- $507 – $1,088
Fire risk 3/10 · Minor
- Est. fire insurance / yr
- $963 – $1,789
Heat risk 8/10 · Major
- Hot days now (above 108°F)
- 7 days/yr
- Hot days in 30 yrs
- 19 days/yr
Wind risk 9/10 · Severe
- Chance of severe wind over 30 yrs
- 99.0%
Air-quality risk 6/10 · Moderate
- Unhealthy air days now
- 11 days/yr
- Unhealthy air days in 30 yrs
- 12 days/yr
Risk factors via First Street. Map © Google.
Why this score? — see what drove the C+ grade
The composite is a weighted blend of 9 inputs, each scored 0–100. Each bar is that input's sub-score; the figure is the points it added to the 100-point composite (weight × sub-score).
- Cash flow +30.0/30.0
- DSCR +10.0/10.0
- 1% rule +9.1/10.0
- Rent growth +4.6/5.0
- Livability +3.0/5.0
- Condition / age +2.5/5.0
- Schools +1.5/10.0
- ARV discount +0.0/15.0
- Appreciation +0.0/10.0
$69,900
🖨 Deal sheet 📄 Offer letter ✓ Due diligence
Listing remarks MLS
Nice 3 bed 1 bath home that currently rents for $800/month. This home can also be bought in a package deal with MLS#1000060591 (217 N Troup St. , Valdosta GA).
Key facts
- 7,405 sq ft lot
- Listed 153 days
Neighborhood map
What this means for you Summary
Snapshot
- This is a 3-bed/1.0-bath single-family listed at $70k.
Deal economics
- At list price, monthly cash flow is $335 ($4k/yr) — positive.
- The deal already cash-flows at list — no discount required.
- Meets the 1% rule at list price ($988 rent vs $70k).
- Recommended offer: $62k (12.0% below list) — sets the bar for market timing.
- Cap rate 12.1% vs local median 4.3% in Valdosta — top-decile yield for the area; either an underpriced asset or a hidden risk that comps aren't pricing in. Stress-test before assuming the spread holds.
Location & tenants
- Location reads 60/100 on livability (#392 in GA) — a middle-class / working-renter tenant base. Strengths: cost of living A+, health & safety A+, housing A-; Watch: schools F, crime F, amenities F.
- Valdosta City (urban): math 15% / reading 22% proficiency, ranked #149 of 174 in GA (top 86%) — low school quality limits family demand, transient renter base, plan for 1-2y turnover; 74% free/reduced lunch — lower-income household profile, screen leases tightly.
- Market conditions: Rents rising fast (+8.3%/yr); 198 active listings in the ZIP; 27 comparable units currently listed for rent nearby; rentals lingering (median 44d on market — plan ~5-8 weeks vacancy on turnover, expect pricing pressure); 56% of comp listings sitting > 30 days — soft ceiling on asking rent; lower-income renter base — watch delinquency; 896 units permitted in Lowndes County in 2024 (0 in 5+ unit buildings).
- This rent runs 33% of the median local income ($36k/yr) — at the standard rent-burdened threshold; future hikes will face affordability resistance.
Forward outlook
- Local home prices are declining (-3.0%/yr); year-one equity from $483 of loan paydown is wiped out by about $2k of value loss. Plan a longer hold.
- Lowndes County population projected at +10% by 2050 — modest demand growth; plan on rents tracking national, not racing it.
- At projected returns (-3.0% appreciation + 8.0% rent growth), your $20k cash investment doubles in ~5 years — after that, you're playing with house money.
Negotiation context
- It's been on market 154 days — a 12% lower offer ($62k) is reasonable based on typical stale-listing flexibility.
- 2 sale attempts since 3y ago; this cycle's ask has dropped $10k (13%) from the opening price — seller is motivated, your offer sets the floor, not the list.
- Current owner paid $60k; 16% above their basis — modest negotiation headroom, anchor on the comps not their cost.
Risks & watch-outs
- Climate carrying-cost: severe wind risk, 99% chance of damaging wind over 30y; extreme-heat days projected 7→19/yr by 2055 (HVAC capex compounding) — expect insurance premiums to compound above CPI over the hold.
Questions for the listing agent
- It's been on market 154 days. Have you received any prior offers? Is the seller open to a 12% concession, seller financing, or rate buy-down credit?
- Built in 1975 — when were the roof, HVAC, electrical panel, plumbing, and water heater last replaced?
- Why hasn't it sold? Are there any deal-killer items the seller is aware of (foundation, flood, title, zoning, code violations)?
- Is there a deadline driving the sale (1031 exchange, divorce, estate, relocation)? That informs how much negotiation room exists.
- Schools are F-rated, which usually means shorter tenancies and higher turnover. Who's the typical renter profile here, and what's been the actual vacancy rate?
- Crime grade is F in this area — have there been break-ins, vandalism, or insurance claims at this property in the last 3 years? What carrier currently insures it and at what premium?
- What's the average days-on-market for RENTAL listings here right now (not sales)? A rising rental-DOM trend means longer vacancies and softer asking-rent achievability than the comps imply.
- What's the recent tenant-quality profile in this submarket — average credit score on applications, eviction rate, late-payment / NSF rate, and stable-employment percentage? A property-management company in the area should have these aggregated.
- How much new for-sale + rental construction is in the pipeline within 1–3 miles? Heavy new supply typically softens prices + rents 12–24 months out; constrained supply supports both.
Investment metrics
- 1% rule
- 1.41% ✓
- Cap rate
- 12.05%
- Cash-on-cash
- 20.56%
- DSCR
- 1.91
- GRM
- 5.9
CMA / ARV
- ARV (median comp)
- $58,792
- List price
- $69,900
- Delta
- 18.89%
- Verdict
- OVERPRICED
- Comps
- 20 within 1.0 mi
Show comp detail 12 sales within ~0.75 mi
| Address | Dist | Beds/Ba | Sqft | Sold | Price | $/sf | Match |
|---|---|---|---|---|---|---|---|
| 515 E Mary St | 0.36mi | 3/1.0 | 1,000 (+4%) | 2mo | $94,900 | $95 | 75 |
| 1012 N Troup St | 0.41mi | 2/1.0 (-1) | 892 (-7%) | 4mo | $13,000 | $15 | 60 |
| 507 N Barack Obama Blvd | 0.51mi | 3/1.0 | 1,032 (+8%) | 6mo | $79,900 | $77 | 59 |
| 622 E Jane St | 0.55mi | 3/1.0 | 940 (-2%) | 17mo | $40,000 | $43 | 57 |
| 722 E Jane St | 0.61mi | 3/1.0 | 1,044 (+9%) | 1mo | $76,500 | $73 | 56 |
| 410 West Adair St | 0.59mi | 2/1.0 (-1) | 894 (-7%) | 2mo | $15,000 | $17 | 55 |
| 907 E Gordon St | 0.48mi | 2/1.0 (-1) | 871 (-9%) | 5mo | $23,000 | $26 | 53 |
| 720 E Magnolia St | 0.56mi | 3/1.0 | 1,014 (+6%) | 18mo | $77,000 | $76 | 49 |
| 413 S Lee St | 0.74mi | 2/1.0 (-1) | 1,019 (+6%) | 6mo | $8,800 | $9 | 45 |
| 743 E Brookwood Dr | 0.69mi | 2/1.0 (-1) | 906 (-6%) | 13mo | $76,000 | $84 | 43 |
| 614 E Brookwood Dr | 0.61mi | 3/2.0 | 1,014 (+6%) | 19mo | $60,000 | $59 | 42 |
| 1011 Cypress St | 0.60mi | 2/1.0 (-1) | 896 (-7%) | 23mo | $42,000 | $47 | 37 |
Match score weights: distance 35% · size 25% · config 20% · recency 20%. Top-matched comps best support the ARV.
Projected returns pro-forma
-3.0% appreciation · 8.0% rent growth · sell at horizon
- IRR
- 18.2%
- Equity multiple
- 1.78×
- Total profit
- $15,246
- Equity at exit
- $10,422
- IRR
- 29.8%
- Equity multiple
- 4.30×
- Total profit
- $64,506
- Equity at exit
- $6,044
Cash invested: $19,572 (down + closing). Projections, not guarantees.
Landlord ↔ Tenant lean methodology
- Overall (STATE)
- 90 Strongly Landlord-Friendly
- State Georgia
- 90 Strongly Landlord-Friendly · R+3
- County
- — inherits STATE
- City
- — inherits STATE
ZIP-level market 31601
- Home prices YoY
- -31.2%
- Rents YoY
- 8.3%
- Active inventory
- 198
- Price-to-rent
- 5.9×
Monthly cashflow live
- Estimated rent
- $988 high interval (Pro) →
- Mortgage (P&I)
- −$367
- Tax from tax record
- −$49 /mo · $591/yr
- Insurance
- −$29
- HOA
- −$0
- Vacancy / Maint / Mgmt
- −$207
- Net cashflow
- $335
Break-even live
UW: 25.0% down · 7.5% · 30yr · 1.5% tax · 5.0% vac · 8.0% maint · 8.0% mgmt
Financing live
Cash to close
- Down payment
- $17,475
- Closing costs
- $2,097
- Reserves months
- —
- Total cash needed
- —
Loan-product check · same deal, 3 products live
Conventional
25% down · 7.5% · 30yr
- Down + closing
- —
- Monthly P&I
- —
- Monthly cashflow
- —
- DSCR
- —
- Eligible?
- —
Personal DTI + credit; lowest rate.
DSCR
20% down · 8.5% · 30yr
- Down + closing
- —
- Monthly P&I
- —
- Monthly cashflow
- —
- DSCR
- —
- Eligible?
- —
No personal income docs; deal must DSCR.
Hard money
10% down · 12.0% · 12mo
- Down + closing
- —
- Monthly P&I
- —
- Monthly cashflow
- —
- DSCR
- —
- Eligible?
- —
Short-term bridge; refi at stabilization.
Rent comps 27 comps
| Address | Beds | Baths | Sqft | Rent | $/sqft | DOM | Units | Dist |
|---|---|---|---|---|---|---|---|---|
| 522 Green St Valdosta, GA | 2.0 | 1.0 | 1020 | $900 | $0.88 | 21d | 1 | 0.40mi |
| 1010 N Toombs St Valdosta, GA | 2.0 | 1.5 | 1056 | $1,000 | $0.95 | 21d | 3 | 0.49mi |
| 1005 N Oak St Valdosta, GA | 3.0 | 1.0 | 1087 | $795 | $0.73 | 43d | 1 | 0.52mi |
| 1004 N Oak St Valdosta, GA | 1.0–2.0 | 1.0 | 866 | $750 | $0.87 | 21d | 3 | 0.55mi |
| 604 E Brookwood Dr Valdosta, GA | 2.0 | 1.0 | 720 | $995 | $1.38 | 43d | 1 | 0.58mi |
| 1029 Johnson St Valdosta, GA | 2.0 | 1.0 | 986 | $900 | $0.91 | 43d | 1 | 0.59mi |
| 743 E Brookwood Dr Valdosta, GA | 2.0 | 1.0 | 906 | $895 | $0.99 | 43d | 1 | 0.67mi |
| 722 Vallotton Dr Valdosta, GA | 3.0 | 1.0 | 984 | $900 | $0.91 | 43d | 1 | 0.82mi |
| 803 Lausanne Dr Valdosta, GA | 3.0 | 1.0 | 994 | $1,095 | $1.10 | 43d | 1 | 0.83mi |
| 1609 Marion St Unit B Valdosta, GA | 2.0 | 1.0 | 945 | $895 | $0.95 | 21d | 1 | 0.85mi |
| 1506 Slater St Unit 7 Valdosta, GA | 2.0 | 1.5 | 1037 | $695 | $0.67 | 43d | 1 | 0.87mi |
| 1701 N Troup St Valdosta, GA | 2.0 | 1.0 | 756 | $750 | $0.99 | 21d | 1 | 0.98mi |
| 808 Lilly St Apt B Valdosta, GA | 3.0 | 1.0 | 872 | $895 | $1.03 | 43d | 1 | 1.02mi |
| 1716 Charlton St Valdosta, GA | 2.0 | 1.0 | 833 | $825 | $0.99 | 43d | 1 | 1.06mi |
| 1503 E Park Ave Valdosta, GA | 1.0–3.0 | 1.0–2.0 | 890 | $1,260 | $1.42 | 43d | 54 | 1.10mi |
| 1704 N Patterson St Unit 4 Valdosta, GA | 2.0 | 2.0 | 1100 | $950 | $0.86 | 43d | 1 | 1.14mi |
| 1616 E Moore St Apt 19 Valdosta, GA | 2.0 | 1.0 | 1029 | $825 | $0.80 | 43d | 1 | 1.20mi |
| 304 E Cranford Ave Valdosta, GA | 2.0 | 1.0 | 980 | $850 | $0.87 | 43d | 1 | 1.21mi |
| 825 Bethune Dr Valdosta, GA | 3.0 | 1.0 | 834 | $895 | $1.07 | 21d | 1 | 1.27mi |
| 720 E Park Ave Unit 6 Valdosta, GA | 2.0 | 1.0 | 850 | $650 | $0.76 | 21d | 1 | 1.27mi |
| 1709 Azalea Dr Apt B Valdosta, GA | 2.0 | 1.0 | 775 | $1,250 | $1.61 | 21d | 1 | 1.28mi |
| 1425 E Park Ave Valdosta, GA | 1.0–2.0 | 1.0–2.0 | 917 | $1,095 | $1.19 | 21d | 2 | 1.31mi |
| 713 Lakeland Ave Valdosta, GA | 2.0 | 1.0 | 1047 | $895 | $0.85 | 43d | 1 | 1.32mi |
| 1400 Baytree Dr Valdosta, GA | 2.0–4.0 | 2.0–4.0 | 1277 | $614 | $0.48 | 43d | 1 | 1.37mi |
| 200 W Cranford Ave Valdosta, GA | 2.0 | 2.0 | 950 | $1,225 | $1.29 | 21d | 3 | 1.37mi |
| 1205 Bethune St Unit A Valdosta, GA | 2.0 | 1.5 | 1100 | $1,000 | $0.91 | 21d | 1 | 1.40mi |
| 1005 Langdale Dr Unit B Valdosta, GA | 2.0 | 1.0 | 879 | $700 | $0.80 | 21d | 1 | 1.50mi |
Listing history 20 events
-
2026-06-19days on market $69,900 Active 154 DOM
-
2026-06-18days on market $69,900 Active 153 DOM
-
2026-06-17days on market $69,900 Active 152 DOM
-
2026-06-17pricedays on market $69,900 Active 151 DOM
-
2026-06-05days on market $74,900 Active 148 DOM
-
2026-06-03days on market $74,900 Active 147 DOM
-
2026-06-02days on market $74,900 Active 146 DOM
-
2026-06-01days on market $74,900 Active 145 DOM
-
2026-05-31days on market $74,900 Active 144 DOM
-
2026-05-30days on market $74,900 Active 143 DOM
-
2026-02-24price $74,900 159-char remark
Show marketing remark (159 chars)
Nice 3 bed 1 bath home that currently rents for $800/month. This home can also be bought in a package deal with MLS#1000060591 (217 N Troup St. , Valdosta GA).
-
2026-01-07$79,900 Active 159-char remark
Show marketing remark (159 chars)
Nice 3 bed 1 bath home that currently rents for $800/month. This home can also be bought in a package deal with MLS#1000060591 (217 N Troup St. , Valdosta GA).
-
2024-03-01soldstatus $60,000 Closed 186-char remark
Show marketing remark (186 chars)
New Roof! Currently rents for $750.00. Updated 3 bedrooms 1 bath home with large fenced in back yard. Kitchen has been renovated with new flooring and black appliances. New laundry room.
-
2024-03-01soldstatus $120,000
Show marketing remark (186 chars)
New Roof! Currently rents for $750.00. Updated 3 bedrooms 1 bath home with large fenced in back yard. Kitchen has been renovated with new flooring and black appliances. New laundry room.
-
2024-03-01soldstatus $120,000
Show marketing remark (186 chars)
New Roof! Currently rents for $750.00. Updated 3 bedrooms 1 bath home with large fenced in back yard. Kitchen has been renovated with new flooring and black appliances. New laundry room.
-
2024-01-29status Pending 186-char remark
Show marketing remark (186 chars)
New Roof! Currently rents for $750.00. Updated 3 bedrooms 1 bath home with large fenced in back yard. Kitchen has been renovated with new flooring and black appliances. New laundry room.
-
2023-10-18$74,900 Active 186-char remark
Show marketing remark (186 chars)
New Roof! Currently rents for $750.00. Updated 3 bedrooms 1 bath home with large fenced in back yard. Kitchen has been renovated with new flooring and black appliances. New laundry room.
-
2004-09-01soldstatus $65,000
-
2001-03-08soldstatus $52,000
-
1995-07-31soldstatus $20,000
ⓘ Source: listings_history table (triggers on properties + properties_extension) + one-shot
backfill from property_details.listing_events for pre-trigger history.
Tax reassessment forecast GA · Resets to sale price
- Current annual tax
- $591 · $49/mo
- Projected year-2 tax
- $643 · $54/mo
- Expected delta
- +$52/yr (+$4/mo · 8.8%)
ⓘ Screening estimate from a state-policy table — verify with the county assessor before closing.
Climate risk First Street
- Flood 1/10 Low FEMA zone X (unshaded) · 0% chance over 30 yrs
- Wildfire 3/10 Moderate
- Heat 8/10 Severe 7 d/yr ≥108°F today · 19 d/yr by 30 yrs out
- Wind 9/10 Extreme 99% chance of damaging wind over 30 yrs
- Air quality 6/10 Major 11 unhealthy d/yr today · 12 by 30 yrs out
Nearby sold comps map
Loading sold comps map…
Walkable amenities ~0.75 mi
Loading nearby amenities…
Taxation est. · year 1
- Rental income
- $11,853
- − Mortgage interest
- −$3,915
- − Property taxes
- −$591
- − Insurance
- −$350
- − Repairs & maintenance
- −$948
- − Management
- −$948
- − Depreciation
- −$2,033
- Taxable income
- $3,067
- Est. tax owed @ 24.0%
- −$736
- After-tax cash flow
- $3,289/yr
For passive investors: Depreciation is non-cash, so a rental often shows a tax loss while cash-flowing — sheltering income. Rental losses are passive: they offset passive income freely, and up to $25,000/yr can offset ordinary (W-2) income if you actively participate and your MAGI is under $100k (phasing out to $0 by $150k); unused losses carry forward. On sale, claimed depreciation is recaptured at up to 25%, and gains may owe capital-gains tax (a 1031 exchange can defer both). Figures are a year-1 estimate at your 24.0% rate — not tax advice; consult a CPA.
Schools (NCES district)
- District
- Valdosta City
- NCES district ID
- 1305310
- Math proficiency
- 15% ▼ -12.00%
- Reading proficiency
- 22% ▼ -7.00%
- Median HH income
- $30,634
- Composite
- 14.79/100
- National rank
- #9388
- State rank
- #149 of 174 in GA
Livability — Valdosta
- Score
- 60/100
- State rank
- #392
- US rank
- #19544
Category grades
Schools grade is shown separately in the Schools card above.
Census & demographics
- Census place
- Valdosta, GA
- County
- Lowndes County · 107,801 people
- City population
- 91,859
- Metro
- Valdosta, GA
- Population (ZIP)
- 31,302
- Household income
- $36,111
- Rent vs Own
- Severe rent burden
- 2016.0
Population outlook (Lowndes County) Hauer SSP2
- Today (2025)
- 120,348 people
- By 2030
- 123,469 · +2.6%
- By 2040
- 128,482 · +6.8%
- By 2050
- 131,907 · +9.6%
- By 2075
- 139,080 · +15.6%
- By 2100
- 133,649 · +11.1%
Race, ethnicity, and origin ACS 2023
- Neighborhood character
- Diverse neighborhood (Simpson 0.57)
- Race & ethnicity
- Black 57% White 31% Hispanic / Latino 8% Two or more races 4% Asian 1%
- Hispanic origin (detail)
- Mexican 4%
- Common ancestry
- Slovak 1% Italian 1%
- Foreign-born
- 4% · Canada, South Korea
- Languages at home
- 92% English-only · Spanish 7% Korean 1%
Political lean MEDSL · Lowndes
- 2024 margin
- R (+18.0) · D 40.8% · R 58.8%
- 2008→2024 swing
- -8.6pp toward R · 2008: -9.4pp · 2024: -18.0pp
- All cycles
- 2024: R+18.0 2020: R+12.0 2016: R+18.2 2012: R+10.5 2008: R+9.4
Not yet ingested
- Civics
- —
Market trends
- HPI YoY
- ▼ -55.12%
- Current HPI
- 121.5948
- Rent YoY
- ▲ 8.34%
- Metro
- Valdosta, GA
- State GDP YoY
- ▲ 2.66%
- F500 in state
- 28
Industry mix (Fortune 500 HQ in GA)
| Industry | F500 HQs | Revenue |
|---|---|---|
| Paper / Packaging | 2 | $29B |
|
||
| Retail | 1 | $160B |
|
||
| Transportation / Logistics | 1 | $91B |
|
||
| Airlines | 1 | $62B |
|
||
| Consumer Goods | 1 | $47B |
|
||
| Utilities | 1 | $25B |
|
||
Price history
+274.5% since first listed10 events — show timeline
- 2026-02-24 Price Changed $74,900 SGMLS
- 2026-01-07 Listed $79,900 SGMLS
- 2024-03-01 Sold (Public Records) $120,000 Public Records
- 2024-03-01 Sold (Public Records) $120,000 Public Records
- 2024-03-01 Sold (MLS) $60,000 SGMLS
- 2024-01-29 Pending — SGMLS
- 2023-10-18 Listed $74,900 SGMLS
- 2004-09-01 Sold (Public Records) $65,000 Public Records
- 2001-03-08 Sold (Public Records) $52,000 Public Records
- 1995-07-31 Sold (Public Records) $20,000 Public Records
Property tax history
+2.5%/yrLatest (2025): $591 · +26.1% YoY. Source: county tax records.
Cash-flow waterfall
monthlySold comps — $/sqft
last 12 mo · ≤1 miLoading sold comps…