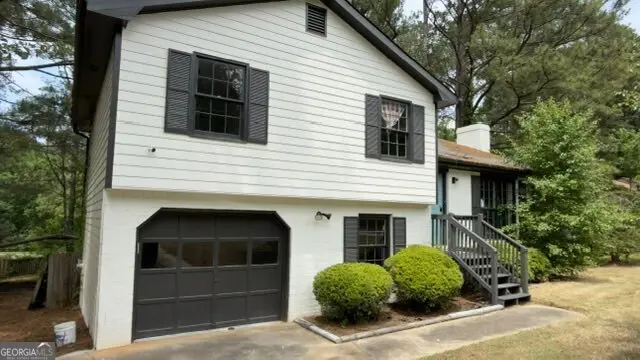
408 Willow Ct SE · Conyers, GA
Flood risk 1/10 · Minimal
- FEMA flood zone
- X (unshaded)
- Chance of flooding over 30 yrs
- 0.0%
- Est. flood insurance / yr
- $473 – $860
Fire risk 3/10 · Minor
- Est. fire insurance / yr
- $963 – $1,789
Heat risk 6/10 · Moderate
- Hot days now (above 106°F)
- 7 days/yr
- Hot days in 30 yrs
- 18 days/yr
Wind risk 6/10 · Moderate
- Chance of severe wind over 30 yrs
- 27.0%
Air-quality risk 4/10 · Minor
- Unhealthy air days now
- 5 days/yr
- Unhealthy air days in 30 yrs
- 7 days/yr
Risk factors via First Street. Map © Google.
Why this score? — see what drove the F grade
The composite is a weighted blend of 9 inputs, each scored 0–100. Each bar is that input's sub-score; the figure is the points it added to the 100-point composite (weight × sub-score).
- Cash flow +13.2/30.0
- 1% rule +4.0/10.0
- DSCR +4.0/10.0
- Rent growth +3.5/5.0
- Livability +3.4/5.0
- Condition / age +2.5/5.0
- Schools +1.9/10.0
- ARV discount +0.0/15.0
- Appreciation +0.0/10.0
$215,000
🖨 Deal sheet 📄 Offer letter ✓ Due diligence
Listing remarks MLS
Located in the heart of Conyers, this 3 bedroom, 2 bath split level home needs a little TLC to bring it back to life. The shaker style soft-close cabinets, quartz countertops, and stainless steel appliances, as well as both bathrooms, are still in great condition. The backyard is fenced in and overlooks Honey Creek golf course. The carport is an added bonus and doubles as a shaded entertainment area, ideal for hosting gatherings. THIS IS A SHORT SALE AND SUBJECT TO THE MORTGAGE COMPANY'S FINAL APPROVAL. NO BLIND OFFERS. CASH OR CONVENTIONAL ONLY.
Key facts
- Quartz countertops
- Fenced backyard
- 0.38 acre lot
Tags
Property features AI
Exterior
- Parking: 2-car garage; Driveway parking; Garage faces front; Additional open parking available
- Utilities: Public water; Public sewer; Electric service available; Cable available
- Home design: Multi/split level home; Resale property
- Construction: Brick front with HardiPlank siding; Composition roof; Slab foundation
- Exterior features: Backyard fencing; Deck
Interior
- Kitchen: White cabinets; Eat-in kitchen; Dishwasher; Electric range; Refrigerator
- Bedrooms: Three bedrooms on the upper level
- Flooring: Carpet; Laminate
- Bathrooms: Two full bathrooms (both on the upper level); Master bathroom with shower-only configuration
- Heating & cooling: Central heating; Central air conditioning
- Interior features: High 9-ft ceilings on the lower level; One fireplace located in the family room; Open-concept dining area; Bonus room
- Laundry & utility: Laundry located on the lower level
Neighborhood map
What this means for you Summary
Snapshot
- This is a 3-bed/2.0-bath single-family listed at $215k.
Deal economics
- At list price, monthly cash flow is $-4 ($-54/yr) — negative.
- To cash-flow at today's rent, offer at most $214k (0.4% below list).
- To meet the 1% rule (rent ≥ 1% of price), the offer needs to be $194k (9.8% below list).
- Recommended offer: $194k (9.8% below list) — sets the bar for 1% rule.
- Cap rate 6.3% vs local median 4.4% in Conyers — top-decile yield for the area; either an underpriced asset or a hidden risk that comps aren't pricing in. Stress-test before assuming the spread holds.
Location & tenants
- Location reads 67/100 on livability (#167 in GA) — a middle-class / working-renter tenant base. Strengths: cost of living A+, housing A+; Watch: crime D, amenities D, commute F.
- Rockdale County (suburban): math 14% / reading 29% proficiency, ranked #136 of 174 in GA (top 78%) — low school quality limits family demand, transient renter base, plan for 1-2y turnover.
- Zoned schools: Barksdale Elementary School (math 17% / reading 27%, grade F, #810 of 1,228 statewide, top 69%, 489 students, 70% FRL); Conyers Middle School (math 9% / reading 24%, grade F, #388 of 470 statewide, top 83%, 1,031 students, 78% FRL); Rockdale County High School (math 12% / reading 17%, grade F, #315 of 424 statewide, top 76%, 2,369 students, 64% FRL).
- Market conditions: Rents rising fast (+4.2%/yr); 386 active listings in the ZIP; 5 comparable units currently listed for rent nearby; rentals at typical pace (median 21d on market — plan ~3-4 weeks tenant-placement turnaround); 40% of comp listings sitting > 30 days — soft ceiling on asking rent; solid renter incomes; 483 units permitted in Rockdale County in 2024 (0 in 5+ unit buildings).
Forward outlook
- Local home prices are declining (-3.0%/yr); year-one equity from $1k of loan paydown is wiped out by about $6k of value loss. Plan a longer hold.
- Rockdale County population projected at +29% by 2050 — long-run rental-demand tailwind backs the buy-and-hold thesis.
Negotiation context
- Only 6 days on market — expect competitive offers; lowballing is unlikely to land.
- 10 sale attempts since 8y ago with the ask held roughly flat each time — persistent listings suggest the price (not the market) is what's stuck; bring a comps-based counter.
Risks & watch-outs
- Climate carrying-cost: major wind risk, 27% chance of damaging wind over 30y; extreme-heat days projected 7→18/yr by 2055 (HVAC capex compounding) — expect insurance premiums to compound above CPI over the hold.
Questions for the listing agent
- What do current leases actually rent for vs. the listed asking? Can we see a recent rent roll and the last 12 months of T-12 income?
- Is there a deadline driving the sale (1031 exchange, divorce, estate, relocation)? That informs how much negotiation room exists.
- Schools are D-rated, which usually means shorter tenancies and higher turnover. Who's the typical renter profile here, and what's been the actual vacancy rate?
- Crime grade is D in this area — have there been break-ins, vandalism, or insurance claims at this property in the last 3 years? What carrier currently insures it and at what premium?
- The area grade is low — what's the realistic commute time and amenity access for the typical tenant pool here? Any planned neighborhood developments (good or bad) we should know about?
- What's the average days-on-market for RENTAL listings here right now (not sales)? A rising rental-DOM trend means longer vacancies and softer asking-rent achievability than the comps imply.
- What's the recent tenant-quality profile in this submarket — average credit score on applications, eviction rate, late-payment / NSF rate, and stable-employment percentage? A property-management company in the area should have these aggregated.
- How much new for-sale + rental construction is in the pipeline within 1–3 miles? Heavy new supply typically softens prices + rents 12–24 months out; constrained supply supports both.
Investment metrics
- 1% rule
- 0.90% ✗
- Cap rate
- 6.27%
- Cash-on-cash
- -0.09%
- DSCR
- 1.00
- GRM
- 9.2
CMA / ARV
- ARV (on-the-fly)
- $172,572
- Comps found
- 1
Show comp detail 1 sale within ~0.75 mi
| Address | Dist | Beds/Ba | Sqft | Sold | Price | $/sf | Match |
|---|---|---|---|---|---|---|---|
| 411 Willow Ct | 0.05mi | 3/2.0 | 1,296 (+10%) | 9mo | $189,500 | $146 | 74 |
Match score weights: distance 35% · size 25% · config 20% · recency 20%. Top-matched comps best support the ARV.
Projected returns pro-forma
-3.0% appreciation · 4.16% rent growth · sell at horizon
- IRR
- -15.1%
- Equity multiple
- 0.46×
- Total profit
- $-32,774
- Equity at exit
- $32,057
- IRR
- -4.6%
- Equity multiple
- 0.68×
- Total profit
- $-19,041
- Equity at exit
- $18,589
Cash invested: $60,200 (down + closing). Projections, not guarantees.
Landlord ↔ Tenant lean methodology
- Overall (STATE)
- 90 Strongly Landlord-Friendly
- State Georgia
- 90 Strongly Landlord-Friendly · R+3
- County
- — inherits STATE
- City
- — inherits STATE
ZIP-level market 30094
- Rents YoY
- 4.2%
- Active inventory
- 386
- Price-to-rent
- 9.2×
Monthly cashflow live
- Estimated rent
- $1,939 high interval (Pro) →
- Mortgage (P&I)
- −$1,127
- Tax from tax record
- −$319 /mo · $3,833/yr
- Insurance
- −$90
- HOA
- −$0
- Vacancy / Maint / Mgmt
- −$407
- Net cashflow
- $-4
Break-even live
UW: 25.0% down · 7.5% · 30yr · 1.5% tax · 5.0% vac · 8.0% maint · 8.0% mgmt
Financing live
Cash to close
- Down payment
- $53,750
- Closing costs
- $6,450
- Reserves months
- —
- Total cash needed
- —
Loan-product check · same deal, 3 products live
Conventional
25% down · 7.5% · 30yr
- Down + closing
- —
- Monthly P&I
- —
- Monthly cashflow
- —
- DSCR
- —
- Eligible?
- —
Personal DTI + credit; lowest rate.
DSCR
20% down · 8.5% · 30yr
- Down + closing
- —
- Monthly P&I
- —
- Monthly cashflow
- —
- DSCR
- —
- Eligible?
- —
No personal income docs; deal must DSCR.
Hard money
10% down · 12.0% · 12mo
- Down + closing
- —
- Monthly P&I
- —
- Monthly cashflow
- —
- DSCR
- —
- Eligible?
- —
Short-term bridge; refi at stabilization.
Rent comps 5 comps
| Address | Beds | Baths | Sqft | Rent | $/sqft | DOM | Units | Dist |
|---|---|---|---|---|---|---|---|---|
| 309 Cowan Rd SE Conyers, GA | 4.0 | 2.0 | 1424 | $1,700 | $1.19 | 44d | 1 | 0.31mi |
| 3775 Ebenezer Rd SE Conyers, GA | 3.0 | 2.0 | 1464 | $1,800 | $1.23 | 5d | 1 | 0.51mi |
| 1062 Plantation Blvd SE Conyers, GA | 3.0 | 3.0 | 1219 | $1,810 | $1.48 | 20d | 1 | 0.67mi |
| 4656 Bristol Dr SE Conyers, GA | 3.0 | 2.0 | 1056 | $1,600 | $1.52 | 44d | 1 | 1.22mi |
| 427 Birch Ln SE Conyers, GA | 3.0 | 2.0 | 1476 | $1,499 | $1.02 | 2d | 1 | 1.44mi |
Listing history 6 events
-
2026-06-18days on market $215,000 Active 6 DOM
-
2026-06-17days on market $215,000 Active 5 DOM
-
2026-06-16days on market $215,000 Active 4 DOM
-
2026-06-15days on market $215,000 Active 3 DOM
-
2026-06-13remarks 552-char remark
-
2026-06-13$215,000 Active 1 DOM
ⓘ Source: listings_history table (triggers on properties + properties_extension) + one-shot
backfill from property_details.listing_events for pre-trigger history.
Tax reassessment forecast GA · Resets to sale price
- Current annual tax
- $3,833 · $319/mo
- Projected year-2 tax
- $3,833 · $319/mo
- Expected delta
- $0/yr ($0/mo · 0.0%)
ⓘ Screening estimate from a state-policy table — verify with the county assessor before closing.
Climate risk First Street
- Flood 1/10 Low FEMA zone X (unshaded) · 0% chance over 30 yrs
- Wildfire 3/10 Moderate
- Heat 6/10 Major 7 d/yr ≥106°F today · 18 d/yr by 30 yrs out
- Wind 6/10 Major 27% chance of damaging wind over 30 yrs
- Air quality 4/10 Moderate 5 unhealthy d/yr today · 7 by 30 yrs out
Nearby sold comps map
Loading sold comps map…
Walkable amenities ~0.75 mi
Loading nearby amenities…
Taxation est. · year 1
- Rental income
- $23,271
- − Mortgage interest
- −$12,043
- − Property taxes
- −$3,833
- − Insurance
- −$1,075
- − Repairs & maintenance
- −$1,862
- − Management
- −$1,862
- − Depreciation
- −$6,255
- Taxable loss
- −$3,658
- Est. tax savings @ 24.0%
- +$878
- After-tax cash flow
- $824/yr
For passive investors: Depreciation is non-cash, so a rental often shows a tax loss while cash-flowing — sheltering income. Rental losses are passive: they offset passive income freely, and up to $25,000/yr can offset ordinary (W-2) income if you actively participate and your MAGI is under $100k (phasing out to $0 by $150k); unused losses carry forward. On sale, claimed depreciation is recaptured at up to 25%, and gains may owe capital-gains tax (a 1031 exchange can defer both). Figures are a year-1 estimate at your 24.0% rate — not tax advice; consult a CPA.
Schools (NCES district)
- District
- Rockdale County
- NCES district ID
- 1304410
- Math proficiency
- 14% ▼ -17.00%
- Reading proficiency
- 29% ▼ -11.00%
- Median HH income
- $53,325
- Composite
- 19.42/100
- National rank
- #8776
- State rank
- #136 of 174 in GA
Livability — Conyers
- Score
- 67/100
- State rank
- #167
- US rank
- #10533
Category grades
Schools grade is shown separately in the Schools card above.
Census & demographics
- County
- Rockdale County · 96,534 people
- City population
- 96,534
- Metro
- Atlanta-Sandy Springs-Alpharetta, GA
- Population (ZIP)
- 33,731
- Household income
- $88,530
- Rent vs Own
- Severe rent burden
- 549.0
Population outlook (Rockdale County) Hauer SSP2
- Today (2025)
- 99,145 people
- By 2030
- 104,558 · +5.5%
- By 2040
- 116,100 · +17.1%
- By 2050
- 127,827 · +28.9%
- By 2075
- 159,113 · +60.5%
- By 2100
- 181,178 · +82.7%
Race, ethnicity, and origin ACS 2023
- Neighborhood character
- Diverse neighborhood (Simpson 0.60)
- Race & ethnicity
- Black 56% White 29% Two or more races 9% Hispanic / Latino 7% Asian 1%
- Hispanic origin (detail)
- Mexican 4% Puerto Rican 1%
- Common ancestry
- Hispanic 1% Serbian 1% Slovak 1%
- Foreign-born
- 7% · Canada
- Languages at home
- 91% English-only · Spanish 5% French/Haitian/Cajun 1%
Political lean MEDSL · Rockdale
- 2024 margin
- Solid D (+47.5) · D 73.4% · R 25.9%
- 2008→2024 swing
- +37.9pp toward D · 2008: 9.6pp · 2024: 47.5pp
- All cycles
- 2024: D+47.5 2020: D+40.8 2016: D+25.9 2012: D+16.4 2008: D+9.6
Not yet ingested
- Civics
- —
Market trends
- HPI YoY
- ▼ -168.06%
- Current HPI
- 205.627
- Rent YoY
- ▲ 4.16%
- Metro
- Atlanta-Sandy Springs-Alpharetta, GA
- State GDP YoY
- ▲ 2.66%
- F500 in state
- 28
Industry mix (Fortune 500 HQ in GA)
| Industry | F500 HQs | Revenue |
|---|---|---|
| Paper / Packaging | 2 | $29B |
|
||
| Retail | 1 | $160B |
|
||
| Transportation / Logistics | 1 | $91B |
|
||
| Airlines | 1 | $62B |
|
||
| Consumer Goods | 1 | $47B |
|
||
| Utilities | 1 | $25B |
|
||
Price history
+237.0% since first listed32 events — show timeline
- 2026-06-12 Listed $215,000 GAMLS
- 2026-06-12 Listed $215,000 FMLS
- 2023-11-17 Sold (Public Records) $280,000 Public Records
- 2023-11-16 Sold (MLS) $280,000 FMLS
- 2023-11-16 Sold (MLS) $280,000 GAMLS
- 2023-10-17 Pending — GAMLS
- 2023-10-17 Pending — FMLS
- 2023-09-29 Listed $270,000 FMLS
- 2023-09-29 Listed $270,000 GAMLS
- 2023-08-16 Sold (Public Records) $165,000 Public Records
- 2023-08-16 Sold (MLS) $165,000 FMLS
- 2023-08-16 Sold (MLS) $165,000 GAMLS
- 2023-08-01 Pending — GAMLS
- 2023-08-01 Pending — FMLS
- 2023-07-27 Price Changed $225,000 GAMLS
- 2023-07-26 Relisted — FMLS
- 2023-07-26 Relisted — GAMLS
- 2023-07-26 Price Changed $225,000 FMLS
- 2023-07-19 Pending — GAMLS
- 2023-07-19 Pending — FMLS
- 2023-07-10 Listed $240,000 FMLS
- 2023-07-03 Listed $240,000 GAMLS
- 2018-10-19 Sold (Public Records) $132,000 Public Records
- 2018-10-17 Sold (MLS) $132,000 GAMLS
- 2018-09-12 Pending — GAMLS
- 2018-09-11 Relisted — GAMLS
- 2018-09-10 Pending — GAMLS
- 2018-09-06 Listed $132,000 GAMLS
- 2000-04-11 Sold (Public Records) $89,400 Public Records
- 1994-05-02 Sold (Public Records) $69,010 Public Records
- 1993-02-01 Sold (Public Records) $70,700 Public Records
- 1986-07-24 Sold (Public Records) $63,800 Public Records
Property tax history
+10.0%/yrLatest (2025): $3,833 · +7.6% YoY. Source: county tax records.
Cash-flow waterfall
monthlySold comps — $/sqft
last 12 mo · ≤1 miLoading sold comps…