 Triplex
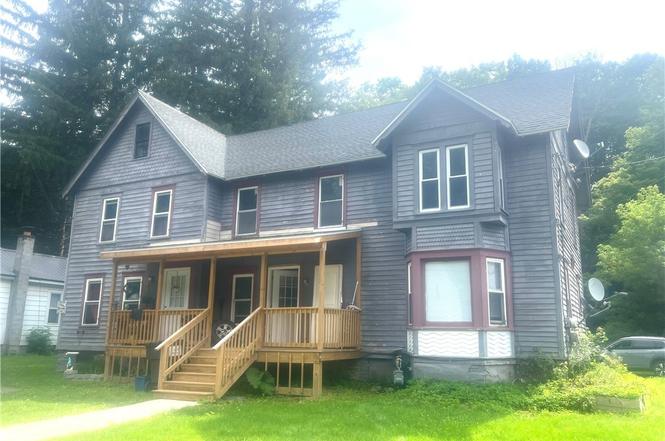
25 North St · McGraw, NY
Flood risk 9/10 · Severe
- FEMA flood zone
- AE
- Chance of flooding over 30 yrs
- 0.99%
- Est. flood insurance / yr
- $2,026 – $9,024
Fire risk 3/10 · Minor
- Est. fire insurance / yr
- $691 – $1,283
Heat risk 2/10 · Minimal
- Hot days now (above 91°F)
- 7 days/yr
- Hot days in 30 yrs
- 16 days/yr
Wind risk 2/10 · Minimal
- Chance of severe wind over 30 yrs
- 1.0%
Air-quality risk 2/10 · Minimal
- Unhealthy air days now
- 0 days/yr
- Unhealthy air days in 30 yrs
- 1 days/yr
Risk factors via First Street. Map © Google.
Why this score? — see what drove the B+ grade
The composite is a weighted blend of 9 inputs, each scored 0–100. Each bar is that input's sub-score; the figure is the points it added to the 100-point composite (weight × sub-score).
- Cash flow +30.0/30.0
- 1% rule +10.0/10.0
- DSCR +10.0/10.0
- ARV discount +7.5/15.0
- Appreciation +7.4/10.0
- Schools +5.0/10.0
- Livability +3.6/5.0
- Rent growth +2.5/5.0
- Condition / age +2.5/5.0
$129,000
🖨 Deal sheet (PDF) 📄 Offer letter ✓ Due diligence
Multi-family units
County records classify this as Multi-Family (2-4 Unit). Listing-text estimate: 3 units. confirmed
Listing remarks MLS
Opportunity to own a 3 unit fully rented with all separate utilities (Gas and electric). Monthly rental $2050. Flood insurance needed.
Key facts
- New floors
- New porches
- New paint
Tags
Neighborhood map
What this means for you Summary
Snapshot
- This is a 1×3bd/1.3ba + 2×2bd/1.3ba units multifamily listed at $129k.
Deal economics
- At list price, monthly cash flow is $1k ($14k/yr) — positive. Per door: $386/mo.
- The deal already cash-flows at list — no discount required.
- Meets the 1% rule at list price ($3k rent vs $129k).
- Recommended offer: $114k (12.0% below list) — sets the bar for market timing.
Location & tenants
- Location reads 71/100 on livability (#411 in NY) — a middle-class / working-renter tenant base. Strengths: cost of living A+, housing A+, crime A-; Watch: health & safety D, amenities F.
- Mcgraw Central School District (rural): math 57% / reading 61% proficiency, ranked #252 of 590 in NY (top 43%) — acceptable for families but not a draw, mixed tenant base, ~2y average lease.
- Zoned schools: Mcgraw Elementary School (math 47% / reading 52%, grade D, #1,085 of 2,108 statewide, top 56%, 232 students, 57% FRL); Mcgraw Secondary School (math 62% / reading 67%, grade B-, #776 of 1,100 statewide, top 73%, 282 students, 52% FRL).
- Market conditions: 13 active listings in the ZIP; 45 units permitted in Cortland County in 2024 (12 in 5+ unit buildings).
Forward outlook
- In year one you build about $7k of equity ($892 loan paydown + $6k appreciation (4.9% local appreciation)).
- Cortland County population projected at -15% by 2050 — secular population decline; favor cash flow + early exit over multi-decade hold.
- At projected returns (4.9% appreciation + 3.0% rent growth), your $36k cash investment doubles in ~2 years — after that, you're playing with house money.
- By year 5, paydown + projected appreciation supports a ~$31k cash-out refi (75% LTV) — recoverable capital for the next deal without selling this one.
Negotiation context
- It's been on market 263 days — a 12% lower offer ($114k) is reasonable based on typical stale-listing flexibility.
- 5 sale attempts since 11y ago; this cycle's ask has dropped $20k (13%) from the opening price — seller is motivated, your offer sets the floor, not the list.
- Current owner paid $60k; list at $129k implies a 115% gain — meaningful room to come down on a strong offer.
Risks & watch-outs
- Watch-outs: flood insurance adds $460/mo; built in 1830 — expect roof / HVAC / electrical / plumbing capex.
- Climate carrying-cost: in FEMA flood zone AE (mandatory federal flood insurance) — expect insurance premiums to compound above CPI over the hold.
Questions for the listing agent
- It's been on market 263 days. Have you received any prior offers? Is the seller open to a 12% concession, seller financing, or rate buy-down credit?
- Can we see the unit-by-unit rent roll, current vacancy, and any below-market leases? What's the average tenancy length?
- What capital expenditures (roof, boiler, parking lot, exteriors) have been made in the last 5 years, and what's planned in the next 2?
- Built in 1830 — when were the roof, HVAC, electrical panel, plumbing, and water heater last replaced?
- What's the actual annual flood-insurance premium (NFIP or private), and is the property in a SFHA with mandatory coverage?
- Why hasn't it sold? Are there any deal-killer items the seller is aware of (foundation, flood, title, zoning, code violations)?
- Is there a deadline driving the sale (1031 exchange, divorce, estate, relocation)? That informs how much negotiation room exists.
- What's the average days-on-market for RENTAL listings here right now (not sales)? A rising rental-DOM trend means longer vacancies and softer asking-rent achievability than the comps imply.
- What's the recent tenant-quality profile in this submarket — average credit score on applications, eviction rate, late-payment / NSF rate, and stable-employment percentage? A property-management company in the area should have these aggregated.
- How much new apartment / multifamily construction is in the pipeline within 1–3 miles? Heavy new supply (>2% of stock underway) typically softens rents 12–24 months out; light construction supports rent growth.
Investment metrics
- 1% rule
- 2.53% ✓
- Cap rate
- 21.35%
- Cash-on-cash
- 53.77%
- DSCR
- 3.39
- GRM
- 3.3
CMA / ARV
No comps found within radius.
Projected returns pro-forma
4.86% appreciation · 3.0% rent growth · sell at horizon
- IRR
- 46.8%
- Equity multiple
- 3.85×
- Total profit
- $102,819
- Equity at exit
- $71,986
- IRR
- 44.9%
- Equity multiple
- 7.87×
- Total profit
- $248,290
- Equity at exit
- $123,325
Cash invested: $36,120 (down + closing). Projections, not guarantees.
Landlord ↔ Tenant lean methodology
- Overall (STATE)
- 15 Strongly Tenant-Friendly
- State New York
- 15 Strongly Tenant-Friendly · D+10
- County
- — inherits STATE
- City
- — inherits STATE
ZIP-level market 13101
- Home prices YoY
- 1.6%
- Active inventory
- 13
- Price-to-rent
- 9.4×
Monthly cashflow live
- Estimated rent
- $3,261 medium interval (Pro) →
- Mortgage (P&I)
- −$676
- Tax from tax record
- −$227 /mo · $2,729/yr
- Insurance
- −$54
- Flood insurance flood zone
- −$460 /mo · $5,525/yr
- HOA
- −$0
- Vacancy / Maint / Mgmt
- −$685
- Net cashflow
- $1,158
Break-even live
Sensitivity live
| Price | -10% $1,231 | -5% $1,195 | +0% $1,158 | +5% $1,122 | +10% $1,085 |
|---|---|---|---|---|---|
| Rent | -10% $901 | -5% $1,029 | +0% $1,158 | +5% $1,287 | +10% $1,416 |
| Rate | -1.0pp $1,223 | -0.5pp $1,191 | base $1,158 | +0.5pp $1,125 | +1.0pp $1,091 |
3-unit breakdown (identical units grouped — click to expand)
| Units | Beds | Baths | Est. rent |
|---|---|---|---|
| 1× unit | 3 | 1.3 | $1,143 |
| 2× units | 2 | 1.3 | $2,118 |
| #2 | 2 | 1.3 | $1,059 |
| #3 | 2 | 1.3 | $1,059 |
| Total (3 units) | $3,261 | ||
UW: 25.0% down · 7.5% · 30yr · 1.5% tax · 5.0% vac · 8.0% maint · 8.0% mgmt
Financing live
Cash to close
- Down payment
- $32,250
- Closing costs
- $3,870
- Reserves months
- —
- Total cash needed
- —
Loan-product check · same deal, 3 products live
Conventional
25% down · 7.5% · 30yr
- Down + closing
- —
- Monthly P&I
- —
- Monthly cashflow
- —
- DSCR
- —
- Eligible?
- —
Personal DTI + credit; lowest rate.
DSCR
20% down · 8.5% · 30yr
- Down + closing
- —
- Monthly P&I
- —
- Monthly cashflow
- —
- DSCR
- —
- Eligible?
- —
No personal income docs; deal must DSCR.
Hard money
10% down · 12.0% · 12mo
- Down + closing
- —
- Monthly P&I
- —
- Monthly cashflow
- —
- DSCR
- —
- Eligible?
- —
Short-term bridge; refi at stabilization.
Listing history 14 events
-
2026-04-03status Pending
-
2026-02-13historical Active Under Contract
-
2025-10-20price $129,000
-
2025-09-30status Active
-
2025-08-27historical Active Under Contract
-
2025-08-14price $139,000
-
2025-07-14$149,000 Active
-
2018-10-18soldstatus $60,000
-
2018-10-12soldstatus $60,000 134-char remark
Show marketing remark (134 chars)
Opportunity to own a 3 unit fully rented with all separate utilities (Gas and electric). Monthly rental $2050. Flood insurance needed.
-
2018-05-31$72,900 134-char remark
Show marketing remark (134 chars)
Opportunity to own a 3 unit fully rented with all separate utilities (Gas and electric). Monthly rental $2050. Flood insurance needed.
-
2015-08-27historical
-
2015-04-27$97,000
-
2015-04-27$97,000
-
2006-02-27soldstatus $47,000
ⓘ Source: listings_history table (triggers on properties + properties_extension) + one-shot
backfill from property_details.listing_events for pre-trigger history.
Tax reassessment forecast NY · Partial reset (capped growth)
- Current annual tax
- $2,729 · $227/mo
- Projected year-2 tax
- $2,729 · $227/mo
- Expected delta
- $0/yr ($0/mo · 0.0%)
ⓘ Screening estimate from a state-policy table — verify with the county assessor before closing.
Climate risk First Street
- Flood 9/10 Extreme FEMA zone AE · 99% chance over 30 yrs
- Wildfire 3/10 Moderate
- Heat 2/10 Low 7 d/yr ≥91°F today · 16 d/yr by 30 yrs out
- Wind 2/10 Low 100% chance of damaging wind over 30 yrs
- Air quality 2/10 Low 0 unhealthy d/yr today · 1 by 30 yrs out
Nearby sold comps map
Loading sold comps map…
Walkable amenities ~0.75 mi
Loading nearby amenities…
Taxation est. · year 1
- Rental income
- $39,132
- − Mortgage interest
- −$7,226
- − Property taxes
- −$2,729
- − Insurance
- −$6,170
- − Repairs & maintenance
- −$3,131
- − Management
- −$3,131
- − Depreciation
- −$3,753
- Taxable income
- $12,993
- Est. tax owed @ 24.0%
- −$3,118
- After-tax cash flow
- $10,779/yr
For passive investors: Depreciation is non-cash, so a rental often shows a tax loss while cash-flowing — sheltering income. Rental losses are passive: they offset passive income freely, and up to $25,000/yr can offset ordinary (W-2) income if you actively participate and your MAGI is under $100k (phasing out to $0 by $150k); unused losses carry forward. On sale, claimed depreciation is recaptured at up to 25%, and gains may owe capital-gains tax (a 1031 exchange can defer both). Figures are a year-1 estimate at your 24.0% rate — not tax advice; consult a CPA.
Schools (NCES district)
- District
- Mcgraw Central School District
- NCES district ID
- 3618840
- Math proficiency
- 57% ▲ 7.00%
- Reading proficiency
- 61% ▲ 11.00%
- Median HH income
- $51,404
- Composite
- 50.37/100
- National rank
- #1875
- State rank
- #252 of 590 in NY
Livability — McGraw
- Score
- 71/100
- State rank
- #411
- US rank
- #7091
Category grades
Schools grade is shown separately in the Schools card above.
Census & demographics
- Census place
- McGraw, NY
- Population (ZIP)
- 2,221
Population outlook (Cortland County) Hauer SSP2
- Today (2025)
- 47,543 people
- By 2030
- 46,107 · -3.0%
- By 2040
- 43,122 · -9.3%
- By 2050
- 40,216 · -15.4%
- By 2075
- 34,717 · -27.0%
- By 2100
- 28,953 · -39.1%
Race, ethnicity, and origin ACS 2023
- Neighborhood character
- Predominantly White (94%)
- Race & ethnicity
- White 94% Two or more races 4% Hispanic / Latino 2%
- Common ancestry
- Romanian 3% Iranian 3% Serbian 2%
- Foreign-born
- 0% · Canada
- Languages at home
- 98% English-only · Spanish 1%
Political lean MEDSL · Cortland
- 2024 margin
- Lean R (+6.4) · D 46.8% · R 53.2%
- 2008→2024 swing
- -16.4pp toward R · 2008: 10.0pp · 2024: -6.4pp
- All cycles
- 2024: R+6.4 2020: R+1.9 2016: R+6.7 2012: D+8.8 2008: D+10.0
Not yet ingested
- Civics
- —
Market trends
- HPI YoY
- ▲ 4.86%
- Current HPI
- 305.3272
- Rent YoY
- —
- Metro
- —
- State GDP YoY
- ▲ 2.60%
- F500 in state
- 92
Industry mix (Fortune 500 HQ in NY)
| Industry | F500 HQs | Revenue |
|---|---|---|
| Financial Services | 10 | $950B |
|
||
| Consumer Goods | 9 | $162B |
|
||
| Insurance | 4 | $225B |
|
||
| Telecommunications | 2 | $144B |
|
||
| Pharmaceuticals | 2 | $112B |
|
||
| Media / Entertainment | 2 | $69B |
|
||
Price history
+174.5% since first listed14 events — show timeline
- 2026-04-03 Pending — CNYIS
- 2026-02-13 Contingent — CNYIS
- 2025-10-20 Price Changed $129,000 CNYIS
- 2025-09-30 Relisted — CNYIS
- 2025-08-27 Contingent — CNYIS
- 2025-08-14 Price Changed $139,000 CNYIS
- 2025-07-14 Listed $149,000 CNYIS
- 2018-10-18 Sold (Public Records) $60,000 Public Records
- 2018-10-12 Sold (MLS) $60,000 CNYIS
- 2018-05-31 Listed $72,900 CNYIS
- 2015-08-27 Listing Removed — CNYIS
- 2015-04-27 Listed $97,000 IBRMLS
- 2015-04-27 Listed $97,000 CNYIS
- 2006-02-27 Sold (Public Records) $47,000 Public Records
Property tax history
+1.0%/yrLatest (2025): $2,729 · +3.1% YoY. Source: county tax records.
Cash-flow waterfall
monthlySold comps — $/sqft
last 12 mo · ≤1 miLoading sold comps…