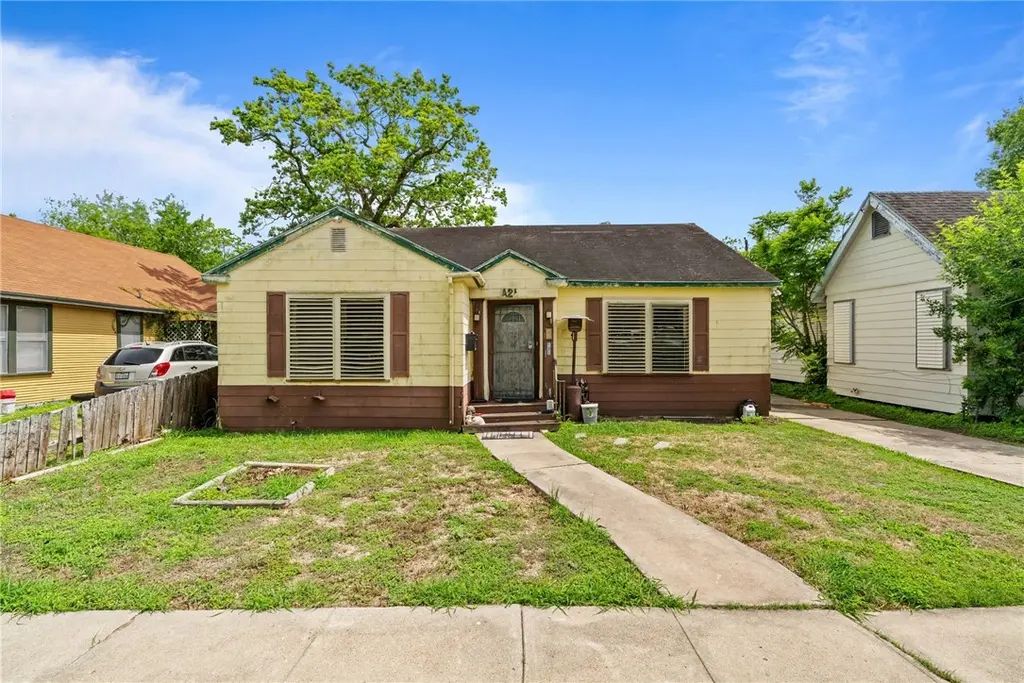
425 Ohio Ave · Corpus Christi, TX
Flood risk 1/10 · Minimal
- FEMA flood zone
- X (unshaded)
- Chance of flooding over 30 yrs
- 0.0%
- Est. flood insurance / yr
- $507 – $1,088
Fire risk 1/10 · Minimal
- Est. fire insurance / yr
- $1,222 – $2,270
Heat risk 10/10 · Severe
- Hot days now (above 107°F)
- 6 days/yr
- Hot days in 30 yrs
- 22 days/yr
Wind risk 9/10 · Severe
- Chance of severe wind over 30 yrs
- 99.0%
Air-quality risk 1/10 · Minimal
- Unhealthy air days now
- 0 days/yr
- Unhealthy air days in 30 yrs
- 0 days/yr
Risk factors via First Street. Map © Google.
Why this score? — see what drove the C- grade
The composite is a weighted blend of 9 inputs, each scored 0–100. Each bar is that input's sub-score; the figure is the points it added to the 100-point composite (weight × sub-score).
- Cash flow +20.2/30.0
- ARV discount +9.7/15.0
- DSCR +6.4/10.0
- 1% rule +5.9/10.0
- Livability +3.9/5.0
- Rent growth +3.0/5.0
- Schools +2.8/10.0
- Condition / age +2.5/5.0
- Appreciation +0.0/10.0
$189,000
🖨 Deal sheet 📄 Offer letter ✓ Due diligence
Listing remarks MLS
Investment opportunity at 425 Ohio in Corpus Christi! This 3-bedroom, 2-bath home offers a functional layout with generously sized bedrooms and recently installed vinyl flooring throughout for durability and easy maintenance. The home features a spacious living area with a fireplace, a separate dining space, and convenient interior washer and dryer hookups. Hurricane shutters provide added protection—an ideal feature for coastal living. Situated on a property with a long driveway, covered parking, and a single-car garage with an attached workshop, there’s plenty of space for storage, projects, or additional utility. Currently tenant-occupied (until 7/14/2026), this property presents an excellent opportunity for investors looking for immediate rental income or buyers willing to add value over time. Conveniently located near hospitals, schools, shopping, and major roadways.
Key facts
- Vinyl flooring
- Covered parking
- Attached workshop
Tags
Neighborhood map
What this means for you Summary
Snapshot
- This is a 3-bed/2.0-bath single-family listed at $189k.
Deal economics
- At list price, monthly cash flow is $239 ($3k/yr) — positive.
- The deal already cash-flows at list — no discount required.
- Meets the 1% rule at list price ($2k rent vs $189k).
- Recommended offer: $183k (3.0% below list) — sets the bar for market timing.
- Cap rate 7.8% vs local median 3.6% in Corpus Christi — top-decile yield for the area; either an underpriced asset or a hidden risk that comps aren't pricing in. Stress-test before assuming the spread holds.
Location & tenants
- Location reads 78/100 on livability (#66 in TX, #2,404 nationally) — a middle-class / working-renter tenant base. Strengths: commute A+, cost of living A+, housing A+; Watch: crime F.
- Corpus Christi ISD (urban): math 31% / reading 35% proficiency, ranked #562 of 826 in TX (top 68%) — families likely to look elsewhere, expect single-tenant / working-renter base with shorter leases; 63% free/reduced lunch — lower-income household profile, screen leases tightly.
- Market conditions: Rents rising (+1.9%/yr); 141 active listings in the ZIP; 26 comparable units currently listed for rent nearby; rentals lingering (median 44d on market — plan ~5-8 weeks vacancy on turnover, expect pricing pressure); 58% of comp listings sitting > 30 days — soft ceiling on asking rent; 1,397 units permitted in Nueces County in 2024 (47 in 5+ unit buildings).
- This rent runs 40% of the median local income ($61k/yr) — at the standard rent-burdened threshold; future hikes will face affordability resistance.
Forward outlook
- Local home prices are declining (-3.0%/yr); year-one equity from $1k of loan paydown is wiped out by about $6k of value loss. Plan a longer hold.
- Nueces County population projected at +36% by 2050 — long-run rental-demand tailwind backs the buy-and-hold thesis.
Negotiation context
- It's been on market 52 days — a 3% lower offer ($183k) is reasonable based on typical stale-listing flexibility.
- 2 sale attempts since 25y ago with the ask held roughly flat each time — persistent listings suggest the price (not the market) is what's stuck; bring a comps-based counter.
- Current owner paid $73k; list at $189k implies a 159% gain — meaningful room to come down on a strong offer.
Risks & watch-outs
- Watch-outs: built in 1937 — expect roof / HVAC / electrical / plumbing capex.
- Climate carrying-cost: severe wind risk, 99% chance of damaging wind over 30y; extreme-heat days projected 6→22/yr by 2055 (HVAC capex compounding) — expect insurance premiums to compound above CPI over the hold.
Questions for the listing agent
- It's been on market 52 days. Have you received any prior offers? Is the seller open to a 3% concession, seller financing, or rate buy-down credit?
- Built in 1937 — when were the roof, HVAC, electrical panel, plumbing, and water heater last replaced?
- Is there a deadline driving the sale (1031 exchange, divorce, estate, relocation)? That informs how much negotiation room exists.
- Crime grade is F in this area — have there been break-ins, vandalism, or insurance claims at this property in the last 3 years? What carrier currently insures it and at what premium?
- What's the average days-on-market for RENTAL listings here right now (not sales)? A rising rental-DOM trend means longer vacancies and softer asking-rent achievability than the comps imply.
- What's the recent tenant-quality profile in this submarket — average credit score on applications, eviction rate, late-payment / NSF rate, and stable-employment percentage? A property-management company in the area should have these aggregated.
- How much new for-sale + rental construction is in the pipeline within 1–3 miles? Heavy new supply typically softens prices + rents 12–24 months out; constrained supply supports both.
Investment metrics
- 1% rule
- 1.09% ✓
- Cap rate
- 7.81%
- Cash-on-cash
- 5.41%
- DSCR
- 1.24
- GRM
- 7.6
CMA / ARV
- ARV (median comp)
- $198,489
- List price
- $189,000
- Delta
- -4.78%
- Verdict
- FAIR
- Comps
- 20 within 1.0 mi
Show comp detail 12 sales within ~0.75 mi
| Address | Dist | Beds/Ba | Sqft | Sold | Price | $/sf | Match |
|---|---|---|---|---|---|---|---|
| 634 Sorrell St | 0.48mi | 3/2.0 | 1,552 (+0%) | 1mo | $237,500 | $153 | 77 |
| 702 Texas Ave | 0.38mi | 3/2.0 | 1,514 (-2%) | 2mo | $239,900 | $158 | 76 |
| 2810 Topeka St | 0.12mi | 3/2.0 | 1,395 (-10%) | 5mo | $199,900 | $143 | 73 |
| 502 Vaky St | 0.46mi | 3/2.0 | 1,543 (-0%) | 6mo | $67,900 | $44 | 73 |
| 636 Texas Ave | 0.33mi | 3/2.0 | 1,342 (-14%) | 4mo | $149,900 | $112 | 59 |
| 714 Indiana Ave | 0.40mi | 3/2.0 | 1,741 (+12%) | 2mo | $265,000 | $152 | 59 |
| 1113 Annapolis Dr | 0.74mi | 3/2.0 | 1,518 (-2%) | 4mo | $224,900 | $148 | 58 |
| 1725 15th St | 0.64mi | 3/2.5 | 1,447 (-7%) | 2mo | $190,000 | $131 | 56 |
| 311 Clifford St | 0.50mi | 3/1.0 | 1,400 (-10%) | 2mo | $118,000 | $84 | 55 |
| 641 Naples St | 0.44mi | 2/2.0 (-1) | 1,376 (-11%) | 4mo | $205,000 | $149 | 53 |
| 1154 Florida Ave | 0.68mi | 3/2.0 | 1,737 (+12%) | 1mo | $275,000 | $158 | 47 |
| 3301 Willies Landing Dr | 0.70mi | 3/2.5 | 1,700 (+10%) | 4mo | $321,757 | $189 | 46 |
Match score weights: distance 35% · size 25% · config 20% · recency 20%. Top-matched comps best support the ARV.
Projected returns pro-forma
-3.0% appreciation · 1.87% rent growth · sell at horizon
- IRR
- -9.2%
- Equity multiple
- 0.67×
- Total profit
- $-17,661
- Equity at exit
- $28,181
- IRR
- -1.4%
- Equity multiple
- 0.91×
- Total profit
- $-4,779
- Equity at exit
- $16,341
Cash invested: $52,920 (down + closing). Projections, not guarantees.
Landlord ↔ Tenant lean methodology
- Overall (STATE)
- 87 Strongly Landlord-Friendly
- State Texas
- 87 Strongly Landlord-Friendly · R+5
- County
- — inherits STATE
- City
- — inherits STATE
ZIP-level market 78404
- Rents YoY
- 1.9%
- Active inventory
- 141
- Price-to-rent
- 7.6×
Monthly cashflow live
- Estimated rent
- $2,068 high interval (Pro) →
- Mortgage (P&I)
- −$991
- Tax from tax record
- −$325 /mo · $3,903/yr
- Insurance
- −$79
- HOA
- −$0
- Vacancy / Maint / Mgmt
- −$434
- Net cashflow
- $239
Break-even live
UW: 25.0% down · 7.5% · 30yr · 1.5% tax · 5.0% vac · 8.0% maint · 8.0% mgmt
Financing live
Cash to close
- Down payment
- $47,250
- Closing costs
- $5,670
- Reserves months
- —
- Total cash needed
- —
Loan-product check · same deal, 3 products live
Conventional
25% down · 7.5% · 30yr
- Down + closing
- —
- Monthly P&I
- —
- Monthly cashflow
- —
- DSCR
- —
- Eligible?
- —
Personal DTI + credit; lowest rate.
DSCR
20% down · 8.5% · 30yr
- Down + closing
- —
- Monthly P&I
- —
- Monthly cashflow
- —
- DSCR
- —
- Eligible?
- —
No personal income docs; deal must DSCR.
Hard money
10% down · 12.0% · 12mo
- Down + closing
- —
- Monthly P&I
- —
- Monthly cashflow
- —
- DSCR
- —
- Eligible?
- —
Short-term bridge; refi at stabilization.
Rent comps 26 comps
| Address | Beds | Baths | Sqft | Rent | $/sqft | DOM | Units | Dist |
|---|---|---|---|---|---|---|---|---|
| 455 Louisiana Ave Corpus Christi, TX | 2.0 | 1.0 | 1528 | $3,000 | $1.96 | 21d | 1 | 0.07mi |
| 417 Southern St Corpus Christi, TX | 4.0 | 2.5 | 2028 | $2,350 | $1.16 | 43d | 1 | 0.12mi |
| 426 Palmero St Corpus Christi, TX | 3.0 | 2.0 | 1720 | $1,350 | $0.78 | 43d | 1 | 0.53mi |
| 1802 16th St Unit B Corpus Christi, TX | 3.0 | 1.0 | 1575 | $1,000 | $0.63 | 43d | 1 | 0.54mi |
| 3102 Santa Fe St Corpus Christi, TX | 1.0–2.0 | 1.0–2.0 | 922 | $1,095 | $1.19 | 43d | 1 | 0.67mi |
| 2901 S Staples St Unit B Corpus Christi, TX | 2.0 | 1.0 | 2236 | $900 | $0.40 | 43d | 1 | 0.69mi |
| 1539 10th St Unit 1 Corpus Christi, TX | 2.0 | 1.0 | 1944 | $1,225 | $0.63 | 43d | 1 | 0.79mi |
| 1628 18th St Corpus Christi, TX | 2.0 | 1.0 | 1112 | $1,000 | $0.90 | 43d | 1 | 0.83mi |
| 1117 Ocean Dr Unit B Corpus Christi, TX | 2.0 | 1.0 | 1543 | $3,000 | $1.94 | 43d | 1 | 0.98mi |
| 1525 S 19th St Unit B Corpus Christi, TX | 3.0 | 2.0 | 1062 | $2,100 | $1.98 | 13d | 1 | 1.00mi |
| 2622 Cloyde St Corpus Christi, TX | 2.0 | 1.0 | 1693 | $1,150 | $0.68 | 43d | 1 | 1.03mi |
| 522 Hancock Ave Unit 1-319 Corpus Christi, TX | 2.0 | 2.0 | 1133 | $1,625 | $1.43 | 21d | 1 | 1.10mi |
| 522 Hancock Ave Corpus Christi, TX | 1.0–2.0 | 1.0–2.0 | 915 | $2,000 | $2.18 | 13d | 10 | 1.12mi |
| 1405 Annapolis Dr Corpus Christi, TX | 3.0 | 1.5 | 1502 | $2,000 | $1.33 | 13d | 1 | 1.12mi |
| 813 Furman Ave Apt 1 Corpus Christi, TX | 3.0 | 2.0 | 1430 | $1,475 | $1.03 | 13d | 1 | 1.15mi |
| 823 S Water St Corpus Christi, TX | 2.0 | 2.0 | 1243 | $2,000 | $1.61 | 13d | 1 | 1.17mi |
| 225 Watson St Corpus Christi, TX | 3.0 | 1.0 | 1472 | $1,295 | $0.88 | 43d | 1 | 1.19mi |
| 1722 Trenton Dr Corpus Christi, TX | 4.0 | 2.0 | 1432 | $2,100 | $1.47 | 13d | 1 | 1.19mi |
| 802 S Carancahua St Corpus Christi, TX | 2.0 | 1.0–2.0 | 869 | $1,770 | $2.04 | 13d | 68 | 1.20mi |
| 1446 Annapolis Dr Corpus Christi, TX | 3.0 | 2.0 | 1500 | $1,700 | $1.13 | 43d | 1 | 1.23mi |
| 1107 14th St Corpus Christi, TX | 4.0 | 1.5 | 1520 | $1,300 | $0.86 | 43d | 1 | 1.25mi |
| 801 S Alameda St Unit A Corpus Christi, TX | 2.0 | 1.0 | 1760 | $900 | $0.51 | 43d | 1 | 1.27mi |
| 3314 Casa de Palmas Dr Corpus Christi, TX | 3.0 | 2.0 | 1869 | $2,300 | $1.23 | 13d | 1 | 1.28mi |
| 3509 Topeka St Corpus Christi, TX | 2.0 | 1.0 | 1114 | $1,850 | $1.66 | 43d | 1 | 1.31mi |
| 1522 Cambridge Dr Corpus Christi, TX | 3.0 | 1.5 | 1278 | $1,600 | $1.25 | 43d | 1 | 1.33mi |
| 3562 Topeka St Corpus Christi, TX | 3.0 | 1.0 | 1208 | $1,695 | $1.40 | 13d | 1 | 1.43mi |
Listing history 15 events
-
2026-06-18days on market $189,000 Active 52 DOM
-
2026-06-17days on market $189,000 Active 51 DOM
-
2026-06-16days on market $189,000 Active 50 DOM
-
2026-06-15days on market $189,000 Active 49 DOM
-
2026-06-14days on market $189,000 Active 47 DOM
-
2026-06-10days on market $189,000 Active 44 DOM
-
2026-06-09days on market $189,000 Active 43 DOM
-
2026-06-08days on market $189,000 Active 42 DOM
-
2026-06-07days on market $189,000 Active 41 DOM
-
2026-06-05statusdays on market $189,000 Active 38 DOM
-
2026-06-01statusdays on market $189,000 Pending 37 DOM
-
2026-04-15$189,000 Active 896-char remark
Show marketing remark (896 chars)
Investment opportunity at 425 Ohio in Corpus Christi! This 3-bedroom, 2-bath home offers a functional layout with generously sized bedrooms and recently installed vinyl flooring throughout for durability and easy maintenance. The home features a spacious living area with a fireplace, a separate dining space, and convenient interior washer and dryer hookups. Hurricane shutters provide added protection—an ideal feature for coastal living. Situated on a property with a long driveway, covered parking, and a single-car garage with an attached workshop, there’s plenty of space for storage, projects, or additional utility. Currently tenant-occupied (until 7/14/2026), this property presents an excellent opportunity for investors looking for immediate rental income or buyers willing to add value over time. Conveniently located near hospitals, schools, shopping, and major roadways.
-
2002-01-03soldstatus 216-char remark
Show marketing remark (216 chars)
NICE SETTLED AREA, MANY UPDATES, LG W/ I CLOSET IN MAS. B/R DOU. SINK IN MAST. BATH, ARCHED ENTRY TO D. R. , HRDW. FL. NEW VINYL FLOORS, ALSO HAS REAR APT. WILL SHOW WELL VA VENDEE ADDENDUMS MUST ACCOMPANY ALL OFFERS
-
2002-01-03soldstatus $73,000
Show marketing remark (216 chars)
NICE SETTLED AREA, MANY UPDATES, LG W/ I CLOSET IN MAS. B/R DOU. SINK IN MAST. BATH, ARCHED ENTRY TO D. R. , HRDW. FL. NEW VINYL FLOORS, ALSO HAS REAR APT. WILL SHOW WELL VA VENDEE ADDENDUMS MUST ACCOMPANY ALL OFFERS
-
2001-10-02$73,500 216-char remark
Show marketing remark (216 chars)
NICE SETTLED AREA, MANY UPDATES, LG W/ I CLOSET IN MAS. B/R DOU. SINK IN MAST. BATH, ARCHED ENTRY TO D. R. , HRDW. FL. NEW VINYL FLOORS, ALSO HAS REAR APT. WILL SHOW WELL VA VENDEE ADDENDUMS MUST ACCOMPANY ALL OFFERS
ⓘ Source: listings_history table (triggers on properties + properties_extension) + one-shot
backfill from property_details.listing_events for pre-trigger history.
Tax reassessment forecast TX · Resets to sale price
- Current annual tax
- $3,903 · $325/mo
- Projected year-2 tax
- $3,903 · $325/mo
- Expected delta
- $0/yr ($0/mo · 0.0%)
ⓘ Screening estimate from a state-policy table — verify with the county assessor before closing.
Climate risk First Street
- Flood 1/10 Low FEMA zone X (unshaded) · 0% chance over 30 yrs
- Wildfire 1/10 Low
- Heat 10/10 Extreme 6 d/yr ≥107°F today · 22 d/yr by 30 yrs out
- Wind 9/10 Extreme 99% chance of damaging wind over 30 yrs
- Air quality 1/10 Low 0 unhealthy d/yr today · 0 by 30 yrs out
Nearby sold comps map
Loading sold comps map…
Walkable amenities ~0.75 mi
Loading nearby amenities…
Taxation est. · year 1
- Rental income
- $24,818
- − Mortgage interest
- −$10,587
- − Property taxes
- −$3,903
- − Insurance
- −$945
- − Repairs & maintenance
- −$1,985
- − Management
- −$1,985
- − Depreciation
- −$5,498
- Taxable loss
- −$86
- Est. tax savings @ 24.0%
- +$21
- After-tax cash flow
- $2,885/yr
For passive investors: Depreciation is non-cash, so a rental often shows a tax loss while cash-flowing — sheltering income. Rental losses are passive: they offset passive income freely, and up to $25,000/yr can offset ordinary (W-2) income if you actively participate and your MAGI is under $100k (phasing out to $0 by $150k); unused losses carry forward. On sale, claimed depreciation is recaptured at up to 25%, and gains may owe capital-gains tax (a 1031 exchange can defer both). Figures are a year-1 estimate at your 24.0% rate — not tax advice; consult a CPA.
Schools (NCES district)
- District
- Corpus Christi ISD
- NCES district ID
- 4815270
- Math proficiency
- 31% ▼ -18.00%
- Reading proficiency
- 35% ▼ -7.00%
- Median HH income
- $45,672
- Composite
- 28.27/100
- National rank
- #6793
- State rank
- #562 of 826 in TX
Livability — Corpus Christi
- Score
- 78/100
- State rank
- #66
- US rank
- #2404
Category grades
Schools grade is shown separately in the Schools card above.
Census & demographics
- Census place
- Corpus Christi, TX
- County
- Nueces County · 296,836 people
- City population
- 296,836
- Metro
- Corpus Christi, TX
- Population (ZIP)
- 12,635
- Household income
- $61,280
- Rent vs Own
- Severe rent burden
- 596.0
Population outlook (Nueces County) Hauer SSP2
- Today (2025)
- 418,037 people
- By 2030
- 447,123 · +7.0%
- By 2040
- 505,911 · +21.0%
- By 2050
- 567,522 · +35.8%
- By 2075
- 729,686 · +74.6%
- By 2100
- 847,087 · +102.6%
Race, ethnicity, and origin ACS 2023
- Neighborhood character
- Majority Hispanic (62%)
- Race & ethnicity
- Hispanic / Latino 62% White 32% Two or more races 29% Black 4%
- Hispanic origin (detail)
- Mexican 56%
- Common ancestry
- Slovak 3% Italian 2% Lithuanian 1%
- Foreign-born
- 9% · Canada
- Languages at home
- 61% English-only · Spanish 39%
Political lean MEDSL · Nueces
- 2024 margin
- R (+11.5) · D 43.8% · R 55.3%
- 2008→2024 swing
- -7.1pp toward R · 2008: -4.4pp · 2024: -11.5pp
- All cycles
- 2024: R+11.5 2020: R+2.9 2016: R+1.5 2012: R+3.2 2008: R+4.4
Not yet ingested
- Civics
- —
Market trends
- HPI YoY
- ▼ -211.10%
- Current HPI
- 177.4759
- Rent YoY
- ▲ 1.87%
- Metro
- Corpus Christi, TX
- State GDP YoY
- ▲ 3.95%
- F500 in state
- 110
Industry mix (Fortune 500 HQ in TX)
| Industry | F500 HQs | Revenue |
|---|---|---|
| Energy | 16 | $1,198B |
|
||
| Technology | 5 | $198B |
|
||
| Engineering / Construction | 4 | $72B |
|
||
| Energy Services | 3 | $60B |
|
||
| Utilities | 3 | $41B |
|
||
| Healthcare | 2 | $330B |
|
||
Price history
+157.1% since first listed4 events — show timeline
- 2026-04-15 Listed $189,000 CBMLS
- 2002-01-03 Sold (Public Records) $73,000 Public Records
- 2002-01-03 Sold (MLS) — CBMLS
- 2001-10-02 Listed $73,500 CBMLS
Property tax history
+3.0%/yrLatest (2025): $3,903 · -7.4% YoY. Source: county tax records.
Cash-flow waterfall
monthlySold comps — $/sqft
last 12 mo · ≤1 miLoading sold comps…