210 37th St SE #35 · Auburn, WA
Flood risk 1/10 · Minimal
- FEMA flood zone
- X (unshaded)
- Chance of flooding over 30 yrs
- 0.0%
- Est. flood insurance / yr
- $507 – $1,088
Fire risk 1/10 · Minimal
- Est. fire insurance / yr
- $604 – $1,122
Heat risk 3/10 · Minor
- Hot days now (above 88°F)
- 7 days/yr
- Hot days in 30 yrs
- 16 days/yr
Wind risk 1/10 · Minimal
- Chance of severe wind over 30 yrs
- —
Air-quality risk 7/10 · Major
- Unhealthy air days now
- 10 days/yr
- Unhealthy air days in 30 yrs
- 11 days/yr
Risk factors via First Street. Map © Google.
Why this score? — see what drove the A- grade
The composite is a weighted blend of 9 inputs, each scored 0–100. Each bar is that input's sub-score; the figure is the points it added to the 100-point composite (weight × sub-score).
- Cash flow +30.0/30.0
- ARV discount +15.0/15.0
- 1% rule +10.0/10.0
- DSCR +10.0/10.0
- Schools +4.7/10.0
- Livability +4.0/5.0
- Condition / age +4.0/5.0
- Rent growth +2.9/5.0
- Appreciation +0.0/10.0
$49,950
🖨 Deal sheet (PDF) 📄 Offer letter ✓ Due diligence
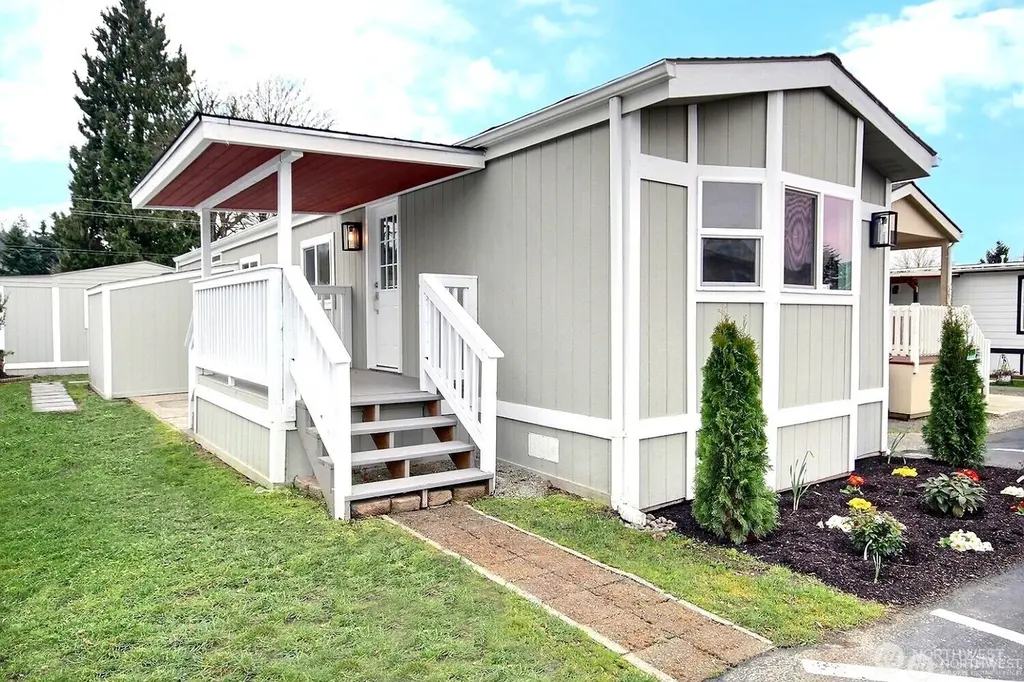
Listing remarks
Completely remodeled and truly better than new. Effortless living in this thoughtfully remodeled 1 bedroom + 1 den and 1 bathroom home located in an ALL AGES, private gated community. Affordable too! Spacious open floor plan living. Check out the quality finishing touches in the kitchen. . . solid surface countertops with complimentary custom tile that goes up the whole wall, stainless steel appliances and custom cabinets. The bathroom is a dream with tile flooring, solid surface countertops, new sink and faucet, a large walk-in shower and window to keep it light and bright. New doors & hardware throughout. Stacked washer & dryer plus laundry folding area add to the amenities. G
Key facts
- Custom cabinets
- Custom tile
- Tile flooring
Tags
Property features AI
Finance
- Other: Bus line nearby
- Financial info: Listing terms: Cash or Conventional
- HOA & community: Located in Auburn Manor Park (approx. 148 homes in park); Park amenities include BBQs, clubhouse, common area, exercise room, playground, pool; Pets allowed: cats OK; Land lease: $1,400
Exterior
- Parking: Uncovered parking; 2 open parking spaces
- Utilities: Electric energy source; Community water (park); Park sewer; Power by PSE; Cable (Comcast); Internet (Xfinity)
- Home design: Manufactured home (single wide); One level; Manufactured after 06/15/1976; Mobile home remains on site
- Construction: Wood construction; Composition roof; Pillar/post/pier foundation with tie downs; Make: FUQU, Model: 56114
- Exterior features: Wood exterior; Wood products
Interior
- Kitchen: Dishwasher; Microwave; Refrigerator; Stove/Range
- Bedrooms: 1 bedroom
- Flooring: Laminate
- Bathrooms: One 3/4 bathroom (shower)
- Heating & cooling: Forced air heating; No cooling
- Interior features: Water heater (electric, located in closet); Den/office; Kitchen with eating area; Living room
- Laundry & utility: Washer; Dryer
Neighborhood map
What this means for you Summary
Snapshot
- This is a 1-bed/1.0-bath manufactured listed at $50k. Condition is rated good.
Deal economics
- At list price, monthly cash flow is $944 ($11k/yr) — positive.
- The deal already cash-flows at list — no discount required.
- Meets the 1% rule at list price ($2k rent vs $50k).
- Recommended offer: $49k (1.5% below list) — sets the bar for market timing.
- Cap rate 29.0% vs local median 2.7% in Auburn — top-decile yield for the area; either an underpriced asset or a hidden risk that comps aren't pricing in. Stress-test before assuming the spread holds.
Location & tenants
- Location reads 81/100 on livability (#75 in WA, #1,371 nationally) — a professional / high-income tenant draw. Strengths: amenities A+, commute A+, employment A+; Watch: crime F, cost of living F.
- Auburn School District (urban): math 47% / reading 56% proficiency, ranked #125 of 291 in WA (top 43%) — acceptable for families but not a draw, mixed tenant base, ~2y average lease.
- Zoned schools: Ilalko Elementary School (493 students, 65% FRL); Mt Baker Middle School (977 students, 58% FRL); Auburn Senior High School (1,844 students, 67% FRL) — zoned schools average 63% FRL vs 44% district-wide (19 pts higher); higher-poverty schools than district average — tighter screening recommended.
- Market conditions: Rents rising (+1.5%/yr); 176 active listings in the ZIP; 15 comparable units currently listed for rent nearby; rentals leasing fast (median 7d on market — plan ~1-2 weeks tenant-placement turnaround); solid renter incomes; 10,555 units permitted in King County in 2024 (7,119 in 5+ unit buildings).
Forward outlook
- Local home prices are declining (-3.0%/yr); year-one equity from $346 of loan paydown is wiped out by about $1k of value loss. Plan a longer hold.
- King County population projected at +44% by 2050 — long-run rental-demand tailwind backs the buy-and-hold thesis.
- At projected returns (-3.0% appreciation + 1.5% rent growth), your $14k cash investment doubles in ~2 years — after that, you're playing with house money.
Negotiation context
- It's been on market 18 days — a 2% lower offer ($49k) is reasonable based on typical stale-listing flexibility.
- 2 sale attempts; this cycle's ask has dropped $25k (33%) from the opening price — seller is motivated, your offer sets the floor, not the list.
Questions for the listing agent
- Is there a deadline driving the sale (1031 exchange, divorce, estate, relocation)? That informs how much negotiation room exists.
- Crime grade is F in this area — have there been break-ins, vandalism, or insurance claims at this property in the last 3 years? What carrier currently insures it and at what premium?
- What's the average days-on-market for RENTAL listings here right now (not sales)? A rising rental-DOM trend means longer vacancies and softer asking-rent achievability than the comps imply.
- What's the recent tenant-quality profile in this submarket — average credit score on applications, eviction rate, late-payment / NSF rate, and stable-employment percentage? A property-management company in the area should have these aggregated.
- How much new for-sale + rental construction is in the pipeline within 1–3 miles? Heavy new supply typically softens prices + rents 12–24 months out; constrained supply supports both.
Investment metrics
- 1% rule
- 3.27% ✓
- Cap rate
- 28.97%
- Cash-on-cash
- 80.99%
- DSCR
- 4.60
- GRM
- 2.6
CMA / ARV
- ARV (on-the-fly)
- $91,728
- Comps found
- 7
Show comp detail 7 sales within ~0.75 mi
| Address | Dist | Beds/Ba | Sqft | Sold | Price | $/sf | Match |
|---|---|---|---|---|---|---|---|
| 210 37th St SE #35 | 0.00mi | 2/1.0 (+1) | 784 (0%) | 13mo | $115,000 | $147 | 84 |
| 401 37 St SE #95 | 0.14mi | 2/1.0 (+1) | 845 (+8%) | 20mo | $100,000 | $118 | 58 |
| 401 37th St SE #20 | 0.13mi | 2/1.0 (+1) | 896 (+14%) | 12mo | $100,000 | $112 | 55 |
| 900 29th St SE Unit E10 | 0.61mi | 2/1.0 (+1) | 720 (-8%) | 6mo | $29,000 | $40 | 48 |
| 3105 M St SE #44 | 0.69mi | 2/1.0 (+1) | 720 (-8%) | 2mo | $36,000 | $50 | 48 |
| 401 37th St SE #31 | 0.14mi | 2/1.0 (+1) | 900 (+15%) | 20mo | $118,000 | $131 | 47 |
| 3225 M St SE #131 | 0.67mi | 2/2.0 (+1) | 900 (+15%) | 8mo | $105,000 | $117 | 28 |
Match score weights: distance 35% · size 25% · config 20% · recency 20%. Top-matched comps best support the ARV.
Projected returns pro-forma
-3.0% appreciation · 1.51% rent growth · sell at horizon
- IRR
- 79.5%
- Equity multiple
- 4.55×
- Total profit
- $49,642
- Equity at exit
- $7,448
- IRR
- 82.6%
- Equity multiple
- 8.95×
- Total profit
- $111,144
- Equity at exit
- $4,319
Cash invested: $13,986 (down + closing). Projections, not guarantees.
Landlord ↔ Tenant lean methodology
- Overall (STATE)
- 28 Tenant-Leaning
- State Washington
- 28 Tenant-Leaning · D+8
- County
- — inherits STATE
- City
- — inherits STATE
ZIP-level market 98002
- Rents YoY
- 1.5%
- Active inventory
- 176
- Price-to-rent
- 2.6×
Monthly cashflow live
- Estimated rent
- $1,632 high interval (Pro) →
- Mortgage (P&I)
- −$262
- Tax est. 1.5%
- −$62 /mo · $749/yr
- Insurance
- −$21
- HOA
- −$0
- Vacancy / Maint / Mgmt
- −$343
- Net cashflow
- $944
Break-even live
Sensitivity live
| Price | -10% $978 | -5% $961 | +0% $944 | +5% $927 | +10% $909 |
|---|---|---|---|---|---|
| Rent | -10% $815 | -5% $880 | +0% $944 | +5% $1,008 | +10% $1,073 |
| Rate | -1.0pp $969 | -0.5pp $957 | base $944 | +0.5pp $931 | +1.0pp $918 |
UW: 25.0% down · 7.5% · 30yr · 1.5% tax · 5.0% vac · 8.0% maint · 8.0% mgmt
Financing live
Cash to close
- Down payment
- $12,488
- Closing costs
- $1,498
- Reserves months
- —
- Total cash needed
- —
Loan-product check · same deal, 3 products live
Conventional
25% down · 7.5% · 30yr
- Down + closing
- —
- Monthly P&I
- —
- Monthly cashflow
- —
- DSCR
- —
- Eligible?
- —
Personal DTI + credit; lowest rate.
DSCR
20% down · 8.5% · 30yr
- Down + closing
- —
- Monthly P&I
- —
- Monthly cashflow
- —
- DSCR
- —
- Eligible?
- —
No personal income docs; deal must DSCR.
Hard money
10% down · 12.0% · 12mo
- Down + closing
- —
- Monthly P&I
- —
- Monthly cashflow
- —
- DSCR
- —
- Eligible?
- —
Short-term bridge; refi at stabilization.
Rent comps 15 comps
| Address | Beds | Baths | Sqft | Rent | $/sqft | DOM | Units | Dist |
|---|---|---|---|---|---|---|---|---|
| 732 4th Ave NE Pacific, WA | 2.0 | 1.0 | 850 | $1,805 | $2.12 | 6d | 2 | 0.38mi |
| 1014 37th St SE Apt 4 Auburn, WA | 2.0 | 2.0 | 1005 | $1,780 | $1.77 | 6d | 1 | 0.51mi |
| 1120 37th St SE Auburn, WA | 2.0 | 1.0 | 788 | $1,695 | $2.15 | 14d | 1 | 0.57mi |
| 404 27th St SE Unit 19-1 Auburn, WA | 2.0 | 1.0 | 1000 | $1,750 | $1.75 | 14d | 1 | 0.66mi |
| 703 47th St SE Auburn, WA | 2.0 | 1.0–2.0 | 781 | $1,760 | $2.25 | 3d | 7 | 0.67mi |
| 2455 F St SE Auburn, WA | 1.0–3.0 | 1.0–2.0 | 757 | $1,400 | $1.85 | 4d | 6 | 0.84mi |
| 2952 O St SE Unit F Auburn, WA | 2.0 | 1.0 | 1051 | $1,495 | $1.42 | 3d | 1 | 0.88mi |
| 2952 O St SE Unit D Auburn, WA | 2.0 | 1.0 | 795 | $1,375 | $1.73 | 3d | 1 | 0.88mi |
| 1526 29th St SE Auburn, WA | 2.0 | 1.0 | 912 | $1,595 | $1.75 | 25d | 1 | 0.94mi |
| 417 22nd St SE Apt C Auburn, WA | 2.0 | 1.0 | 600 | $1,700 | $2.83 | 0d | 1 | 0.96mi |
| 402 21st St SE Auburn, WA | 1.0–2.0 | 1.0–1.5 | 747 | $1,525 | $2.04 | 16d | 4 | 1.01mi |
| 2020 F St SE Auburn, WA | 1.0–2.0 | 1.0 | 725 | $1,399 | $1.93 | 25d | 1 | 1.11mi |
| 508 4th Ave SE Pacific, WA | 2.0 | 1.0 | 885 | $2,100 | $2.37 | 25d | 1 | 1.14mi |
| 6170 Terrace View Ln SE Auburn, WA | 1.0–3.0 | 1.0–2.0 | 956 | $1,517 | $1.59 | 0d | 36 | 1.48mi |
| 1420 17th St SE Auburn, WA | 1.0–2.0 | 1.0 | 725 | $1,425 | $1.96 | 4d | 4 | 1.49mi |
Listing history 17 events
-
2026-06-21days on market $49,950 Active 18 DOM
-
2026-06-18days on market $49,950 Active 15 DOM
-
2026-06-18price $49,950 Active 14 DOM
-
2026-06-17days on market $59,950 Active 14 DOM
-
2026-06-16days on market $59,950 Active 13 DOM
-
2026-06-15days on market $59,950 Active 12 DOM
-
2026-06-13days on market $59,950 Active 10 DOM
-
2026-06-13days on market $59,950 Active 9 DOM
-
2026-06-09days on market $59,950 Active 6 DOM
-
2026-06-08days on market $59,950 Active 5 DOM
-
2026-06-07days on market $59,950 Active 4 DOM
-
2026-06-04pricedays on market $59,950 Active 1 DOM
-
2026-01-27price $59,900
-
2025-11-26$75,000 Active
-
2025-06-04soldstatus $115,000 Closed
-
2025-04-28status Pending
-
2025-03-07$125,000 Active
ⓘ Source: listings_history table (triggers on properties + properties_extension) + one-shot
backfill from property_details.listing_events for pre-trigger history.
Climate risk First Street
- Flood 1/10 Low FEMA zone X (unshaded) · 0% chance over 30 yrs
- Wildfire 1/10 Low
- Heat 3/10 Moderate 7 d/yr ≥88°F today · 16 d/yr by 30 yrs out
- Wind 1/10 Low
- Air quality 7/10 Severe 10 unhealthy d/yr today · 11 by 30 yrs out
Nearby sold comps map
Loading sold comps map…
Walkable amenities ~0.75 mi
Loading nearby amenities…
Taxation est. · year 1
- Rental income
- $19,582
- − Mortgage interest
- −$2,798
- − Property taxes
- −$749
- − Insurance
- −$250
- − Repairs & maintenance
- −$1,567
- − Management
- −$1,567
- − Depreciation
- −$1,453
- Taxable income
- $11,199
- Est. tax owed @ 24.0%
- −$2,688
- After-tax cash flow
- $8,640/yr
For passive investors: Depreciation is non-cash, so a rental often shows a tax loss while cash-flowing — sheltering income. Rental losses are passive: they offset passive income freely, and up to $25,000/yr can offset ordinary (W-2) income if you actively participate and your MAGI is under $100k (phasing out to $0 by $150k); unused losses carry forward. On sale, claimed depreciation is recaptured at up to 25%, and gains may owe capital-gains tax (a 1031 exchange can defer both). Figures are a year-1 estimate at your 24.0% rate — not tax advice; consult a CPA.
Condition & rehab AI · 1 photo
This remodeled manufactured home is in excellent condition with a good condition score of 80. It has been thoughtfully updated with quality finishes and is move-in ready.
Value-add opportunities
- Both Landscaping — Enhances curb appeal and adds value
- Both Painting — Fresh paint can make the home look newer
- Both Window treatments — Improves energy efficiency and aesthetics
Renovation cost estimate screening
Value-add ROI direction
- Both Landscaping — Enhances curb appeal and adds value ↑
- Both Painting — Fresh paint can make the home look newer ↑
- Both Window treatments — Improves energy efficiency and aesthetics ↑
ⓘ Cost ranges are severity-bucket heuristics (US national rule-of-thumb). Get contractor quotes + a written scope before underwriting a rehab budget.
Schools (NCES district)
- District
- Auburn School District
- NCES district ID
- 5300300
- Math proficiency
- 47% ▼ -3.00%
- Reading proficiency
- 56% ▼ -1.00%
- Median HH income
- $58,048
- Composite
- 46.73/100
- National rank
- #5240
- State rank
- #125 of 291 in WA
Livability — Auburn
- Score
- 81/100
- State rank
- #75
- US rank
- #1371
Category grades
Schools grade is shown separately in the Schools card above.
Census & demographics
- Census place
- Auburn, WA
- County
- King County · 2,251,916 people
- City population
- 74,969
- Metro
- Seattle-Tacoma-Bellevue, WA
- Population (ZIP)
- 37,509
- Household income
- $78,684
- Rent vs Own
- Severe rent burden
- 2202.0
Population outlook (King County) Hauer SSP2
- Today (2025)
- 2,576,485 people
- By 2030
- 2,803,316 · +8.8%
- By 2040
- 3,255,921 · +26.4%
- By 2050
- 3,706,444 · +43.9%
- By 2075
- 4,746,063 · +84.2%
- By 2100
- 5,407,730 · +109.9%
Race, ethnicity, and origin ACS 2023
- Neighborhood character
- Highly diverse neighborhood (Simpson 0.72)
- Race & ethnicity
- White 46% Hispanic / Latino 24% Two or more races 13% Black 12% Asian 6% Pacific Islander 4% Native American 2%
- Hispanic origin (detail)
- Mexican 20%
- Common ancestry
- Portuguese 4% Subsaharan African 4% Lithuanian 3%
- Foreign-born
- 24% · Canada, Vietnam
- Languages at home
- 63% English-only · Spanish 19% Russian/Polish/Slavic 6% Other Asian/Pacific 3%
Political lean MEDSL · King
- 2024 margin
- Solid D (+51.7) · D 74.2% · R 22.5% · Other 3.4%
- 2008→2024 swing
- +9.6pp toward D · 2008: 42.1pp · 2024: 51.7pp
- All cycles
- 2024: D+51.7 2020: D+52.7 2016: D+50.4 2012: D+39.9 2008: D+42.1
Not yet ingested
- Civics
- —
Market trends
- HPI YoY
- ▼ -677.96%
- Current HPI
- 298.0849
- Rent YoY
- ▲ 1.51%
- Metro
- Seattle-Tacoma-Bellevue, WA
- State GDP YoY
- ▲ 4.65%
- F500 in state
- 22
Industry mix (Fortune 500 HQ in WA)
| Industry | F500 HQs | Revenue |
|---|---|---|
| Retail | 2 | $269B |
|
||
| Technology / Retail | 1 | $638B |
|
||
| Technology | 1 | $245B |
|
||
| Telecommunications | 1 | $38B |
|
||
| Food / Beverage | 1 | $36B |
|
||
| Automotive / Trucks | 1 | $34B |
|
||
Price history
-52.1% since first listed5 events — show timeline
- 2026-01-27 Price Changed $59,900 NWMLS as Distributed by MLS Grid
- 2025-11-26 Listed $75,000 NWMLS as Distributed by MLS Grid
- 2025-06-04 Sold (MLS) $115,000 NWMLS as Distributed by MLS Grid
- 2025-04-28 Pending — NWMLS as Distributed by MLS Grid
- 2025-03-07 Listed $125,000 NWMLS as Distributed by MLS Grid
Cash-flow waterfall
monthlySold comps — $/sqft
last 12 mo · ≤1 miLoading sold comps…