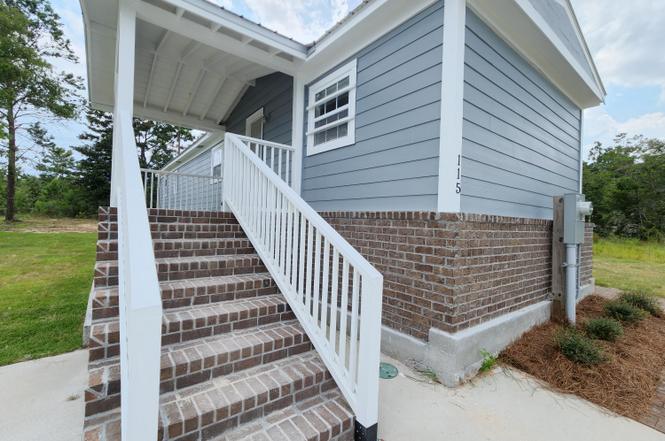
115 Rembrandt Cir · DeFuniak Springs, FL
Flood risk 1/10 · Minimal
- FEMA flood zone
- X (unshaded)
- Chance of flooding over 30 yrs
- 0.0%
- Est. flood insurance / yr
- $507 – $1,088
Fire risk 3/10 · Minor
- Est. fire insurance / yr
- $947 – $1,759
Heat risk 9/10 · Severe
- Hot days now (above 107°F)
- 7 days/yr
- Hot days in 30 yrs
- 20 days/yr
Wind risk 9/10 · Severe
- Chance of severe wind over 30 yrs
- 99.0%
Air-quality risk 1/10 · Minimal
- Unhealthy air days now
- 0 days/yr
- Unhealthy air days in 30 yrs
- 0 days/yr
Risk factors via First Street. Map © Google.
Why this score? — see what drove the C grade
The composite is a weighted blend of 9 inputs, each scored 0–100. Each bar is that input's sub-score; the figure is the points it added to the 100-point composite (weight × sub-score).
- Cash flow +19.1/30.0
- Appreciation +10.0/10.0
- ARV discount +7.3/15.0
- DSCR +6.0/10.0
- Schools +5.2/10.0
- 1% rule +3.9/10.0
- Livability +3.2/5.0
- Rent growth +2.5/5.0
- Condition / age +2.5/5.0
$187,700
🖨 Deal sheet 📄 Offer letter ✓ Due diligence
Listing remarks
Welcome home to this beautifully remodeled 3 bedroom, 2.5 bath home situated on 1/3 of an acre with no HOA! Completely updated in 2022, this home boasts charming brick skirting, durable hardy board siding, and a metal roof. The spacious front and side covered porches provide the perfect spots to relax and enjoy the outdoors, while the large yard offers plenty of space for play or entertaining. Inside, you'll love the open-concept family room and kitchen, ideal for gatherings. The kitchen features stunning cabinetry and ample counter space. The home includes a guest bedroom, an additional bedroom with a half bath, and a large master suite with a walk-in closet and an updated en-suite bathroo
Key facts
- Remodeled
- Covered porches
- Metal roof
Tags
Property features AI
Finance
- HOA & community: Short-term rentals allowed
Exterior
- Parking: Paved parking
- Utilities: Electricity available
- Home design: Single-story home; Zoned for mobile home or single-family residence
- Construction: Brick and HardiPlank-type siding; Metal roof
- Exterior features: Covered porch; Paved lot
Interior
- Kitchen: Electric oven; Electric range
- Bedrooms: Primary bedroom on the first floor
- Bathrooms: 2 full bathrooms; 1 half bathroom
- Heating & cooling: Electric heating
- Interior features: Covered porch
- Laundry & utility: Electric water heater
Neighborhood map
What this means for you Summary
Snapshot
- This is a 3-bed/3.0-bath manufactured listed at $188k.
Deal economics
- At list price, monthly cash flow is $199 ($2k/yr) — positive.
- The deal already cash-flows at list — no discount required.
- To meet the 1% rule (rent ≥ 1% of price), the offer needs to be $168k (10.6% below list).
- Recommended offer: $165k (12.0% below list) — sets the bar for market timing.
- Cap rate 7.6% vs local median 4.8% in DeFuniak Springs — top-decile yield for the area; either an underpriced asset or a hidden risk that comps aren't pricing in. Stress-test before assuming the spread holds.
Location & tenants
- Location reads 64/100 on livability (#694 in FL) — a middle-class / working-renter tenant base. Strengths: cost of living A+, housing A+; Watch: health & safety C-, schools D+, crime D.
- Walton (rural): math 62% / reading 61% proficiency, ranked #10 of 73 in FL (top 14%) — acceptable for families but not a draw, mixed tenant base, ~2y average lease.
- Market conditions: 422 active listings in the ZIP; 2,883 units permitted in Walton County in 2024 (1,322 in 5+ unit buildings).
- This rent runs 39% of the median local income ($52k/yr) — at the standard rent-burdened threshold; future hikes will face affordability resistance.
Forward outlook
- In year one you build about $20k of equity ($1k loan paydown + $19k appreciation (10.0% local appreciation)).
- Walton County population projected at +46% by 2050 — long-run rental-demand tailwind backs the buy-and-hold thesis.
- At projected returns (10.0% appreciation + 3.0% rent growth), your $53k cash investment doubles in ~3 years — after that, you're playing with house money.
- By year 2, paydown + projected appreciation supports a ~$32k cash-out refi (75% LTV) — recoverable capital for the next deal without selling this one.
Negotiation context
- It's been on market 273 days — a 12% lower offer ($165k) is reasonable based on typical stale-listing flexibility.
- 8 sale attempts since 4y ago with the ask held roughly flat each time — persistent listings suggest the price (not the market) is what's stuck; bring a comps-based counter.
Risks & watch-outs
- Climate carrying-cost: severe wind risk, 99% chance of damaging wind over 30y; extreme-heat days projected 7→20/yr by 2055 (HVAC capex compounding) — expect insurance premiums to compound above CPI over the hold.
Questions for the listing agent
- It's been on market 273 days. Have you received any prior offers? Is the seller open to a 12% concession, seller financing, or rate buy-down credit?
- Why hasn't it sold? Are there any deal-killer items the seller is aware of (foundation, flood, title, zoning, code violations)?
- Is there a deadline driving the sale (1031 exchange, divorce, estate, relocation)? That informs how much negotiation room exists.
- Schools are D-rated, which usually means shorter tenancies and higher turnover. Who's the typical renter profile here, and what's been the actual vacancy rate?
- Crime grade is D in this area — have there been break-ins, vandalism, or insurance claims at this property in the last 3 years? What carrier currently insures it and at what premium?
- What's the average days-on-market for RENTAL listings here right now (not sales)? A rising rental-DOM trend means longer vacancies and softer asking-rent achievability than the comps imply.
- What's the recent tenant-quality profile in this submarket — average credit score on applications, eviction rate, late-payment / NSF rate, and stable-employment percentage? A property-management company in the area should have these aggregated.
- How much new for-sale + rental construction is in the pipeline within 1–3 miles? Heavy new supply typically softens prices + rents 12–24 months out; constrained supply supports both.
Investment metrics
- 1% rule
- 0.89% ✗
- Cap rate
- 7.56%
- Cash-on-cash
- 4.54%
- DSCR
- 1.20
- GRM
- 9.3
CMA / ARV
- ARV (on-the-fly)
- $186,720
- Comps found
- 5
Show comp detail 5 sales within ~0.75 mi
| Address | Dist | Beds/Ba | Sqft | Sold | Price | $/sf | Match |
|---|---|---|---|---|---|---|---|
| 232 N Raphael Rd | 0.35mi | 3/2.0 | 1,064 (-9%) | 3mo | $180,000 | $169 | 63 |
| 444 Donatello Rd | 0.56mi | 4/2.0 (+1) | 1,140 (-2%) | 4mo | $148,000 | $130 | 58 |
| 105 Bellini Rd | 0.35mi | 3/2.0 | 1,064 (-9%) | 12mo | $125,000 | $117 | 55 |
| 304 E Michaelanglo Rd | 0.49mi | 3/2.0 | 1,248 (+7%) | 20mo | $200,000 | $160 | 45 |
| 663 E Picasso Cir | 0.70mi | 3/2.0 | 1,296 (+11%) | 8mo | $233,000 | $180 | 38 |
Match score weights: distance 35% · size 25% · config 20% · recency 20%. Top-matched comps best support the ARV.
Projected returns pro-forma
10.0% appreciation · 3.0% rent growth · sell at horizon
- IRR
- 27.5%
- Equity multiple
- 3.18×
- Total profit
- $114,809
- Equity at exit
- $169,095
- IRR
- 24.0%
- Equity multiple
- 7.24×
- Total profit
- $327,977
- Equity at exit
- $364,660
Cash invested: $52,556 (down + closing). Projections, not guarantees.
Landlord ↔ Tenant lean methodology
- Overall (STATE)
- 87 Strongly Landlord-Friendly
- State Florida
- 87 Strongly Landlord-Friendly · R+3
- County
- — inherits STATE
- City
- — inherits STATE
ZIP-level market 32433
- Home prices YoY
- 4.2%
- Active inventory
- 422
- Price-to-rent
- 9.3×
Monthly cashflow live
- Estimated rent
- $1,677 medium interval (Pro) →
- Mortgage (P&I)
- −$984
- Tax from tax record
- −$64 /mo · $764/yr
- Insurance
- −$78
- HOA
- −$0
- Vacancy / Maint / Mgmt
- −$352
- Net cashflow
- $199
Break-even live
UW: 25.0% down · 7.5% · 30yr · 1.5% tax · 5.0% vac · 8.0% maint · 8.0% mgmt
Financing live
Cash to close
- Down payment
- $46,925
- Closing costs
- $5,631
- Reserves months
- —
- Total cash needed
- —
Loan-product check · same deal, 3 products live
Conventional
25% down · 7.5% · 30yr
- Down + closing
- —
- Monthly P&I
- —
- Monthly cashflow
- —
- DSCR
- —
- Eligible?
- —
Personal DTI + credit; lowest rate.
DSCR
20% down · 8.5% · 30yr
- Down + closing
- —
- Monthly P&I
- —
- Monthly cashflow
- —
- DSCR
- —
- Eligible?
- —
No personal income docs; deal must DSCR.
Hard money
10% down · 12.0% · 12mo
- Down + closing
- —
- Monthly P&I
- —
- Monthly cashflow
- —
- DSCR
- —
- Eligible?
- —
Short-term bridge; refi at stabilization.
Listing history 26 events
-
2026-05-31days on market $187,700 Active 273 DOM
-
2026-05-30days on market $187,700 Active 272 DOM
-
2026-03-03status Active
-
2026-02-25status Active
-
2026-02-22historical
-
2026-01-25price $187,700
-
2026-01-25price $187,700
-
2025-11-04price $189,700
-
2025-11-03price $189,700
-
2025-10-18price $194,700
-
2025-10-17price $194,700
-
2025-09-18price $195,700
-
2025-08-22$196,700 Active
-
2025-08-22$196,700 Active
-
2025-06-12status Active
-
2025-02-26price $194,700
-
2025-01-20$199,700 Active
-
2023-02-15soldstatus $182,000 Sold
-
2023-02-15soldstatus $182,000 Sold
-
2023-02-15soldstatus $182,000
-
2023-01-05status Pending
-
2023-01-05status Pending
-
2022-11-30price $185,000
-
2022-11-30price $185,000
-
2022-08-18$199,000 Active
-
2022-08-17$199,000 Active
ⓘ Source: listings_history table (triggers on properties + properties_extension) + one-shot
backfill from property_details.listing_events for pre-trigger history.
Tax reassessment forecast FL · Resets to sale price
- Current annual tax
- $764 · $64/mo
- Projected year-2 tax
- $1,558 · $130/mo
- Expected delta
- +$794/yr (+$66/mo · 103.9%)
ⓘ Screening estimate from a state-policy table — verify with the county assessor before closing.
Climate risk First Street
- Flood 1/10 Low FEMA zone X (unshaded) · 0% chance over 30 yrs
- Wildfire 3/10 Moderate
- Heat 9/10 Extreme 7 d/yr ≥107°F today · 20 d/yr by 30 yrs out
- Wind 9/10 Extreme 99% chance of damaging wind over 30 yrs
- Air quality 1/10 Low 0 unhealthy d/yr today · 0 by 30 yrs out
Nearby sold comps map
Loading sold comps map…
Walkable amenities ~0.75 mi
Loading nearby amenities…
Taxation est. · year 1
- Rental income
- $20,127
- − Mortgage interest
- −$10,514
- − Property taxes
- −$764
- − Insurance
- −$938
- − Repairs & maintenance
- −$1,610
- − Management
- −$1,610
- − Depreciation
- −$5,460
- Taxable loss
- −$771
- Est. tax savings @ 24.0%
- +$185
- After-tax cash flow
- $2,571/yr
For passive investors: Depreciation is non-cash, so a rental often shows a tax loss while cash-flowing — sheltering income. Rental losses are passive: they offset passive income freely, and up to $25,000/yr can offset ordinary (W-2) income if you actively participate and your MAGI is under $100k (phasing out to $0 by $150k); unused losses carry forward. On sale, claimed depreciation is recaptured at up to 25%, and gains may owe capital-gains tax (a 1031 exchange can defer both). Figures are a year-1 estimate at your 24.0% rate — not tax advice; consult a CPA.
Schools (NCES district)
- District
- Walton
- NCES district ID
- 1201980
- Math proficiency
- 62% ▼ -4.00%
- Reading proficiency
- 61% ▼ -2.00%
- Median HH income
- $46,794
- Composite
- 52.03/100
- National rank
- #1634
- State rank
- #10 of 73 in FL
Livability — DeFuniak Springs
- Score
- 64/100
- State rank
- #694
- US rank
- #14475
Category grades
Schools grade is shown separately in the Schools card above.
Census & demographics
- County
- Walton County · 70,839 people
- City population
- 19,746
- Metro
- Crestview-Fort Walton Beach-Destin, FL
- Population (ZIP)
- 19,746
- Household income
- $52,199
- Rent vs Own
- Severe rent burden
- 356.0
Population outlook (Walton County) Hauer SSP2
- Today (2025)
- 80,014 people
- By 2030
- 88,120 · +10.1%
- By 2040
- 103,537 · +29.4%
- By 2050
- 117,034 · +46.3%
- By 2075
- 143,901 · +79.8%
- By 2100
- 155,138 · +93.9%
Race, ethnicity, and origin ACS 2023
- Neighborhood character
- Predominantly White (75%)
- Race & ethnicity
- White 75% Black 10% Hispanic / Latino 8% Two or more races 7% Native American 1%
- Hispanic origin (detail)
- Mexican 5%
- Common ancestry
- Slovak 3% Italian 2% Lithuanian 2%
- Foreign-born
- 6% · Canada
- Languages at home
- 92% English-only · Spanish 4% Other Indo-European 1% French/Haitian/Cajun 1%
Political lean MEDSL · Walton
- 2024 margin
- Solid R (+57.8) · D 20.7% · R 78.6%
- 2008→2024 swing
- -12.0pp toward R · 2008: -45.8pp · 2024: -57.8pp
- All cycles
- 2024: R+57.8 2020: R+51.7 2016: R+56.1 2012: R+52.0 2008: R+45.8
Not yet ingested
- Civics
- —
Market trends
- HPI YoY
- ▲ 14.77%
- Current HPI
- 367.046
- Rent YoY
- —
- Metro
- Crestview-Fort Walton Beach-Destin, FL
- State GDP YoY
- ▲ 3.28%
- F500 in state
- 36
Industry mix (Fortune 500 HQ in FL)
| Industry | F500 HQs | Revenue |
|---|---|---|
| Industrial Technology | 2 | $29B |
|
||
| Insurance | 2 | $17B |
|
||
| Retail | 1 | $60B |
|
||
| Technology Distribution | 1 | $58B |
|
||
| Homebuilding | 1 | $35B |
|
||
| Technology Manufacturing | 1 | $35B |
|
||
Price history
-5.7% since first listed24 events — show timeline
- 2026-03-03 Relisted — CPARMLS
- 2026-02-25 Relisted — ECAR
- 2026-02-22 Listing Removed — CPARMLS
- 2026-01-25 Price Changed $187,700 ECAR
- 2026-01-25 Price Changed $187,700 CPARMLS
- 2025-11-04 Price Changed $189,700 CPARMLS
- 2025-11-03 Price Changed $189,700 ECAR
- 2025-10-18 Price Changed $194,700 ECAR
- 2025-10-17 Price Changed $194,700 CPARMLS
- 2025-09-18 Price Changed $195,700 ECAR
- 2025-08-22 Listed $196,700 CPARMLS
- 2025-08-22 Listed $196,700 ECAR
- 2025-06-12 Relisted — ECAR
- 2025-02-26 Price Changed $194,700 ECAR
- 2025-01-20 Listed $199,700 ECAR
- 2023-02-15 Sold (Public Records) $182,000 Public Records
- 2023-02-15 Sold (MLS) $182,000 NAMLS
- 2023-02-15 Sold (MLS) $182,000 ECAR
- 2023-01-05 Pending — NAMLS
- 2023-01-05 Pending — ECAR
- 2022-11-30 Price Changed $185,000 ECAR
- 2022-11-30 Price Changed $185,000 NAMLS
- 2022-08-18 Listed $199,000 ECAR
- 2022-08-17 Listed $199,000 NAMLS
Property tax history
+38.3%/yrLatest (2025): $764 · -10.6% YoY. Source: county tax records.
Cash-flow waterfall
monthlySold comps — $/sqft
last 12 mo · ≤1 miLoading sold comps…