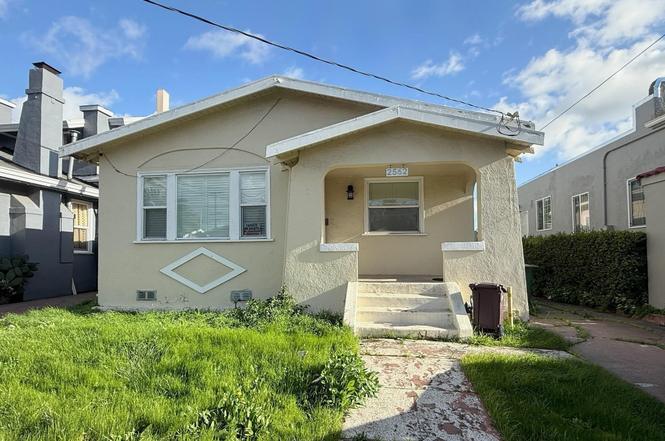
2562 67th Ave · Oakland, CA
Flood risk 1/10 · Minimal
- FEMA flood zone
- X (unshaded)
- Chance of flooding over 30 yrs
- 0.0%
- Est. flood insurance / yr
- $507 – $1,088
Fire risk 1/10 · Minimal
- Est. fire insurance / yr
- $659 – $1,223
Heat risk 4/10 · Minor
- Hot days now (above 83°F)
- 7 days/yr
- Hot days in 30 yrs
- 15 days/yr
Wind risk 1/10 · Minimal
- Chance of severe wind over 30 yrs
- —
Air-quality risk 8/10 · Major
- Unhealthy air days now
- 14 days/yr
- Unhealthy air days in 30 yrs
- 14 days/yr
Risk factors via First Street. Map © Google.
Why this score? — see what drove the B- grade
The composite is a weighted blend of 9 inputs, each scored 0–100. Each bar is that input's sub-score; the figure is the points it added to the 100-point composite (weight × sub-score).
- Cash flow +30.0/30.0
- 1% rule +10.0/10.0
- DSCR +10.0/10.0
- ARV discount +7.5/15.0
- Livability +3.6/5.0
- Schools +3.0/10.0
- Rent growth +2.7/5.0
- Condition / age +2.5/5.0
- Appreciation +0.0/10.0
$165,000
🖨 Deal sheet 📄 Offer letter ✓ Due diligence
Listing remarks
Two-bedroom, one-bath home located in East Oakland, built in 1926. Property is not currently habitable.
Key facts
- 4,000 sq ft lot
- Built 1927
- Listed 38 days
Neighborhood map
What this means for you Summary
Snapshot
- This is a 2-bed/1.0-bath single-family listed at $165k.
Deal economics
- At list price, monthly cash flow is $952 ($11k/yr) — positive.
- The deal already cash-flows at list — no discount required.
- Meets the 1% rule at list price ($3k rent vs $165k).
- Recommended offer: $160k (3.0% below list) — sets the bar for market timing.
- Cap rate 13.2% vs local median 2.4% in Oakland — top-decile yield for the area; either an underpriced asset or a hidden risk that comps aren't pricing in. Stress-test before assuming the spread holds.
Location & tenants
- Location reads 71/100 on livability (#224 in CA) — a middle-class / working-renter tenant base. Strengths: amenities A+, commute A+, employment A+; Watch: schools C-, crime F, cost of living F.
- Oakland Unified (urban): math 27% / reading 33% proficiency, ranked #1,007 of 1,400 in CA (top 72%) — families likely to look elsewhere, expect single-tenant / working-renter base with shorter leases; 68% free/reduced lunch — lower-income household profile, screen leases tightly.
- Market conditions: Rents flat; 186 active listings in the ZIP; 40 comparable units currently listed for rent nearby; rentals lingering (median 44d on market — plan ~5-8 weeks vacancy on turnover, expect pricing pressure); 55% of comp listings sitting > 30 days — soft ceiling on asking rent; solid renter incomes; 1,742 units permitted in Alameda County in 2024 (856 in 5+ unit buildings).
Forward outlook
- Local home prices are declining (-3.0%/yr); year-one equity from $1k of loan paydown is wiped out by about $5k of value loss. Plan a longer hold.
- Alameda County population projected at +34% by 2050 — long-run rental-demand tailwind backs the buy-and-hold thesis.
- At projected returns (-3.0% appreciation + 0.7% rent growth), your $46k cash investment doubles in ~6 years — after that, you're playing with house money.
Negotiation context
- It's been on market 38 days — a 3% lower offer ($160k) is reasonable based on typical stale-listing flexibility.
Risks & watch-outs
- Watch-outs: built in 1927 — expect roof / HVAC / electrical / plumbing capex.
Questions for the listing agent
- It's been on market 38 days. Have you received any prior offers? Is the seller open to a 3% concession, seller financing, or rate buy-down credit?
- Built in 1927 — when were the roof, HVAC, electrical panel, plumbing, and water heater last replaced?
- Is there a deadline driving the sale (1031 exchange, divorce, estate, relocation)? That informs how much negotiation room exists.
- Crime grade is F in this area — have there been break-ins, vandalism, or insurance claims at this property in the last 3 years? What carrier currently insures it and at what premium?
- What's the average days-on-market for RENTAL listings here right now (not sales)? A rising rental-DOM trend means longer vacancies and softer asking-rent achievability than the comps imply.
- What's the recent tenant-quality profile in this submarket — average credit score on applications, eviction rate, late-payment / NSF rate, and stable-employment percentage? A property-management company in the area should have these aggregated.
- How much new for-sale + rental construction is in the pipeline within 1–3 miles? Heavy new supply typically softens prices + rents 12–24 months out; constrained supply supports both.
Investment metrics
- 1% rule
- 1.61% ✓
- Cap rate
- 13.22%
- Cash-on-cash
- 24.72%
- DSCR
- 2.10
- GRM
- 5.2
CMA / ARV
- ARV (on-the-fly)
- $617,120
- Comps found
- 12
Show comp detail 12 sales within ~0.75 mi
| Address | Dist | Beds/Ba | Sqft | Sold | Price | $/sf | Match |
|---|---|---|---|---|---|---|---|
| 2562 67th Ave | 0.00mi | 2/1.0 | 1,160 (0%) | 0mo | $148,375 | $128 | 100 |
| 2427 67th Ave | 0.15mi | 3/2.0 (+1) | 1,134 (-2%) | 0mo | $652,500 | $575 | 80 |
| 1576 76th Ave | 0.46mi | 2/2.0 | 1,153 (-1%) | 1mo | $613,000 | $532 | 72 |
| 2907 Seminary Ave | 0.53mi | 2/1.0 | 1,087 (-6%) | 0mo | $625,000 | $575 | 64 |
| 7114 Halliday | 0.32mi | 3/2.0 (+1) | 1,242 (+7%) | 1mo | $510,000 | $411 | 64 |
| 1720 67th Ave | 0.29mi | 3/1.0 (+1) | 1,034 (-11%) | 2mo | $560,000 | $542 | 62 |
| 2939 57th Ave | 0.69mi | 2/1.0 | 1,122 (-3%) | 1mo | $485,000 | $432 | 62 |
| 6236 Laird Ave | 0.69mi | 2/1.0 | 1,103 (-5%) | 2mo | $637,000 | $578 | 58 |
| 1707 78th Ave | 0.50mi | 2/1.0 | 1,021 (-12%) | 0mo | $305,000 | $299 | 56 |
| 1672 67th Ave | 0.32mi | 3/1.5 (+1) | 998 (-14%) | 0mo | $500,000 | $501 | 55 |
| 2648 77th Ave | 0.65mi | 3/2.0 (+1) | 1,078 (-7%) | 2mo | $599,500 | $556 | 47 |
| 7850 Lockwood St | 0.58mi | 3/2.0 (+1) | 1,308 (+13%) | 1mo | $600,000 | $459 | 42 |
Match score weights: distance 35% · size 25% · config 20% · recency 20%. Top-matched comps best support the ARV.
Projected returns pro-forma
-3.0% appreciation · 0.65% rent growth · sell at horizon
- IRR
- 15.4%
- Equity multiple
- 1.60×
- Total profit
- $27,808
- Equity at exit
- $24,602
- IRR
- 22.3%
- Equity multiple
- 2.70×
- Total profit
- $78,488
- Equity at exit
- $14,266
Cash invested: $46,200 (down + closing). Projections, not guarantees.
Landlord ↔ Tenant lean methodology
- Overall (CITY)
- 0 Strongly Tenant-Friendly
- State California
- 18 Strongly Tenant-Friendly · D+13
- County
- — inherits STATE
- City Oakland
- 0 Strongly Tenant-Friendly · D+62
ZIP-level market 94605
- Rents YoY
- 0.7%
- Active inventory
- 186
- Price-to-rent
- 5.2×
Monthly cashflow live
- Estimated rent
- $2,648 high interval (Pro) →
- Mortgage (P&I)
- −$865
- Tax est. 1.5%
- −$206 /mo · $2,475/yr
- Insurance
- −$69
- HOA
- −$0
- Vacancy / Maint / Mgmt
- −$556
- Net cashflow
- $952
Break-even live
UW: 25.0% down · 7.5% · 30yr · 1.5% tax · 5.0% vac · 8.0% maint · 8.0% mgmt
Financing live
Cash to close
- Down payment
- $41,250
- Closing costs
- $4,950
- Reserves months
- —
- Total cash needed
- —
Loan-product check · same deal, 3 products live
Conventional
25% down · 7.5% · 30yr
- Down + closing
- —
- Monthly P&I
- —
- Monthly cashflow
- —
- DSCR
- —
- Eligible?
- —
Personal DTI + credit; lowest rate.
DSCR
20% down · 8.5% · 30yr
- Down + closing
- —
- Monthly P&I
- —
- Monthly cashflow
- —
- DSCR
- —
- Eligible?
- —
No personal income docs; deal must DSCR.
Hard money
10% down · 12.0% · 12mo
- Down + closing
- —
- Monthly P&I
- —
- Monthly cashflow
- —
- DSCR
- —
- Eligible?
- —
Short-term bridge; refi at stabilization.
Rent comps 40 comps
| Address | Beds | Baths | Sqft | Rent | $/sqft | DOM | Units | Dist |
|---|---|---|---|---|---|---|---|---|
| 2600 Havenscourt Blvd Oakland, CA | 2.0 | 1.0 | 906 | $3,000 | $3.31 | 14d | 1 | 0.04mi |
| 2600 Havenscourt Blvd Oakland, CA | 2.0 | 1.0 | 906 | $3,000 | $3.31 | 12d | 1 | 0.04mi |
| 2442 Havenscourt Blvd Oakland, CA | 2.0 | 1.0 | 1182 | $4,000 | $3.38 | 43d | 1 | 0.14mi |
| 2694 Havenscourt Blvd Unit A Oakland, CA | 2.0 | 1.0 | 800 | $1,995 | $2.49 | 5d | 1 | 0.14mi |
| 6625 Bancroft Ave Unit 6621 Oakland, CA | 2.0 | 1.0 | 734 | $1,950 | $2.66 | 43d | 1 | 0.18mi |
| 6621 Bancroft Ave Oakland, CA | 2.0 | 1.0 | 734 | $1,950 | $2.66 | 43d | 1 | 0.19mi |
| 7123 Holly St Unit d Oakland, CA | 2.0 | 1.0 | 700 | $1,795 | $2.56 | 14d | 1 | 0.29mi |
| 6415 Brann St Oakland, CA | 2.0 | 1.0 | 1240 | $3,100 | $2.50 | 43d | 1 | 0.29mi |
| 7630 Lockwood St Apt 41 Oakland, CA | 1.0 | 1.0 | 750 | $2,000 | $2.67 | 43d | 1 | 0.48mi |
| 6638 MacArthur Blvd Unit 6640-F Oakland, CA | 2.0 | 1.0 | 850 | $2,395 | $2.82 | 43d | 1 | 0.54mi |
| 5834 Elizabeth St Oakland, CA | 3.0 | 1.0 | 1050 | $3,724 | $3.55 | 43d | 1 | 0.57mi |
| 3337 64th Avenue Pl Oakland, CA | 3.0 | 2.0 | 1410 | $3,800 | $2.70 | 10d | 1 | 0.58mi |
| 3408 68th Ave Unit C Oakland, CA | 2.0 | 1.0 | 700 | $2,550 | $3.64 | 1d | 1 | 0.59mi |
| 3421 68th Ave Unit 3 Oakland, CA | 3.0 | 1.0 | 860 | $2,695 | $3.13 | 43d | 1 | 0.59mi |
| 3430 64th Avenue Pl Oakland, CA | 2.0 | 1.0 | 900 | $1,899 | $2.11 | 43d | 1 | 0.62mi |
| 1428 78th Ave Unit 1 Oakland, CA | 1.0 | 1.0 | 1000 | $1,950 | $1.95 | 43d | 1 | 0.64mi |
| 5633 Picardy Dr S Oakland, CA | 2.0 | 1.0 | 1130 | $3,700 | $3.27 | 43d | 1 | 0.64mi |
| 6167 Mauritania Ave Unit C Oakland, CA | 2.0 | 1.0 | 800 | $2,100 | $2.62 | 43d | 1 | 0.64mi |
| 6618 Laird Ave Oakland, CA | 2.0 | 1.0 | 1000 | $2,423 | $2.42 | 1d | 1 | 0.66mi |
| 3421 68th Ave Apt 6 Oakland, CA | 3.0 | 1.0 | 800 | $2,650 | $3.31 | 10d | 1 | 0.67mi |
| 1132 69th Ave Oakland, CA | 2.0 | 1.0 | 750 | $2,500 | $3.33 | 43d | 1 | 0.69mi |
| 7911 Bancroft Ave Oakland, CA | 2.0 | 1.0 | 900 | $2,500 | $2.78 | 43d | 1 | 0.71mi |
| 2837 55th Ave #4 Oakland, CA | 2.0 | 2.0 | 1075 | $2,825 | $2.63 | 43d | 1 | 0.74mi |
| 6055 Majestic Ave Oakland, CA | 2.0 | 1.0 | 758 | $3,500 | $4.62 | 4d | 1 | 0.75mi |
| 1715 82nd Ave Oakland, CA | 3.0 | 2.0 | 1290 | $3,000 | $2.33 | 43d | 1 | 0.78mi |
| 2678 79th Ave Unit B Oakland, CA | 2.0 | 1.0 | 1000 | $2,500 | $2.50 | 43d | 1 | 0.79mi |
| 2028 81st Ave Oakland, CA | 1.0 | 1.0 | 850 | $1,600 | $1.88 | 43d | 1 | 0.81mi |
| 8330 Birch St Unit C Oakland, CA | 3.0 | 1.0 | 1000 | $2,200 | $2.20 | 5d | 1 | 0.91mi |
| 1933 84th Ave Unit C Oakland, CA | 2.0 | 1.0 | 750 | $2,095 | $2.79 | 14d | 1 | 0.92mi |
| 8109 Hillside St Oakland, CA | 3.0 | 1.0 | 1182 | $3,300 | $2.79 | 43d | 1 | 0.94mi |
| 3849 Delmont Ave Oakland, CA | 3.0 | 2.0 | 1496 | $3,950 | $2.64 | 43d | 1 | 0.94mi |
| 5701 International Blvd Oakland, CA | 1.0 | 1.0 | 1115 | $2,300 | $2.06 | 3d | 2 | 0.95mi |
| 1341 58th Ave Ste 12 Oakland, CA | 1.0 | 1.0 | 1100 | $2,095 | $1.90 | 20d | 1 | 0.95mi |
| 1341 58th Ave Oakland, CA | 1.0 | 1.0 | 1100 | $2,095 | $1.90 | 21d | 1 | 0.95mi |
| 955 75th Ave Apt B Oakland, CA | 2.0 | 1.0 | 731 | $1,995 | $2.73 | 14d | 1 | 0.98mi |
| 2326 84th Ave Oakland, CA | 2.0 | 1.0 | 1000 | $2,075 | $2.08 | 3d | 1 | 1.08mi |
| 8521 Dowling St Oakland, CA | 2.0 | 1.0 | 880 | $2,575 | $2.93 | 1d | 1 | 1.13mi |
| 851 81st Ave Oakland, CA | 1.0 | 1.0–1.5 | 1135 | $2,700 | $2.38 | 43d | 1 | 1.13mi |
| 1333 87th Ave Oakland, CA | 2.0 | 1.0 | 1153 | $2,500 | $2.17 | 21d | 1 | 1.13mi |
| 7724 Crest Ave Oakland, CA | 3.0 | 1.0 | 1500 | $3,300 | $2.20 | 43d | 1 | 1.17mi |
Listing history 6 events
-
2026-04-04status Pending
-
2026-04-03historical
-
2026-04-03price $165,000
-
2026-04-03price $127,000
-
2026-02-24$600,000 Active
-
2017-08-04soldstatus $450,000
ⓘ Source: listings_history table (triggers on properties + properties_extension) + one-shot
backfill from property_details.listing_events for pre-trigger history.
Climate risk First Street
- Flood 1/10 Low FEMA zone X (unshaded) · 0% chance over 30 yrs
- Wildfire 1/10 Low
- Heat 4/10 Moderate 7 d/yr ≥83°F today · 15 d/yr by 30 yrs out
- Wind 1/10 Low
- Air quality 8/10 Severe 14 unhealthy d/yr today · 14 by 30 yrs out
Nearby sold comps map
Loading sold comps map…
Walkable amenities ~0.75 mi
Loading nearby amenities…
Taxation est. · year 1
- Rental income
- $31,779
- − Mortgage interest
- −$9,243
- − Property taxes
- −$2,475
- − Insurance
- −$825
- − Repairs & maintenance
- −$2,542
- − Management
- −$2,542
- − Depreciation
- −$4,800
- Taxable income
- $9,352
- Est. tax owed @ 24.0%
- −$2,244
- After-tax cash flow
- $9,178/yr
For passive investors: Depreciation is non-cash, so a rental often shows a tax loss while cash-flowing — sheltering income. Rental losses are passive: they offset passive income freely, and up to $25,000/yr can offset ordinary (W-2) income if you actively participate and your MAGI is under $100k (phasing out to $0 by $150k); unused losses carry forward. On sale, claimed depreciation is recaptured at up to 25%, and gains may owe capital-gains tax (a 1031 exchange can defer both). Figures are a year-1 estimate at your 24.0% rate — not tax advice; consult a CPA.
Schools (NCES district)
- District
- Oakland Unified
- NCES district ID
- 0628050
- Math proficiency
- 27% ▬ 0.00%
- Reading proficiency
- 33% ▬ 0.00%
- Median HH income
- $55,194
- Composite
- 29.52/100
- National rank
- #11769
- State rank
- #1007 of 1400 in CA
Livability — Oakland
- Score
- 71/100
- State rank
- #224
- US rank
- #7245
Category grades
Schools grade is shown separately in the Schools card above.
Census & demographics
- Census place
- Oakland, CA
- County
- Alameda County · 1,614,355 people
- City population
- 385,993
- Metro
- San Francisco-Oakland-Berkeley, CA
- Population (ZIP)
- 44,103
- Household income
- $106,068
- Rent vs Own
- Severe rent burden
- 2086.0
Population outlook (Alameda County) Hauer SSP2
- Today (2025)
- 1,928,884 people
- By 2030
- 2,069,146 · +7.3%
- By 2040
- 2,338,405 · +21.2%
- By 2050
- 2,586,608 · +34.1%
- By 2075
- 3,061,911 · +58.7%
- By 2100
- 3,234,133 · +67.7%
Race, ethnicity, and origin ACS 2023
- Neighborhood character
- Highly diverse neighborhood (Simpson 0.73)
- Race & ethnicity
- Black 40% Hispanic / Latino 27% White 17% Two or more races 11% Asian 9%
- Hispanic origin (detail)
- Mexican 18% Puerto Rican 1%
- Common ancestry
- Italian 2% Lithuanian 1% Romanian 1%
- Foreign-born
- 20% · Canada, China, Vietnam
- Languages at home
- 70% English-only · Spanish 21% Chinese 2% Other Asian/Pacific 2%
Political lean MEDSL · Alameda
- 2024 margin
- Solid D (+53.6) · D 74.6% · R 21.0% · Other 4.4%
- 2008→2024 swing
- -5.9pp toward R · 2008: 59.5pp · 2024: 53.6pp
- All cycles
- 2024: D+53.6 2020: D+62.5 2016: D+64.4 2012: D+59.8 2008: D+59.5
Not yet ingested
- Civics
- —
Market trends
- HPI YoY
- ▼ -793.09%
- Current HPI
- 294.5467
- Rent YoY
- ▲ 0.65%
- Metro
- San Francisco-Oakland-Berkeley, CA
- State GDP YoY
- ▲ 3.21%
- F500 in state
- 116
Industry mix (Fortune 500 HQ in CA)
| Industry | F500 HQs | Revenue |
|---|---|---|
| Technology | 27 | $1,492B |
|
||
| Financial Services | 3 | $174B |
|
||
| Retail | 3 | $44B |
|
||
| Insurance | 3 | $26B |
|
||
| Media / Entertainment | 2 | $115B |
|
||
| Pharmaceuticals / Biotech | 2 | $62B |
|
||
Price history
-63.3% since first listed6 events — show timeline
- 2026-04-04 Pending — bridgeMLS, Bay East AOR, or Contra Costa AOR
- 2026-04-03 Price Changed $165,000 bridgeMLS, Bay East AOR, or Contra Costa AOR
- 2026-04-03 Listing Removed — bridgeMLS, Bay East AOR, or Contra Costa AOR
- 2026-04-03 Price Changed $127,000 bridgeMLS, Bay East AOR, or Contra Costa AOR
- 2026-02-24 Listed $600,000 bridgeMLS, Bay East AOR, or Contra Costa AOR
- 2017-08-04 Sold (Public Records) $450,000 Public Records
Property tax history
+13.6%/yrLatest (2025): $15,658 · +7.4% YoY. Source: county tax records.
Cash-flow waterfall
monthlySold comps — $/sqft
last 12 mo · ≤1 miLoading sold comps…