 7-Plex
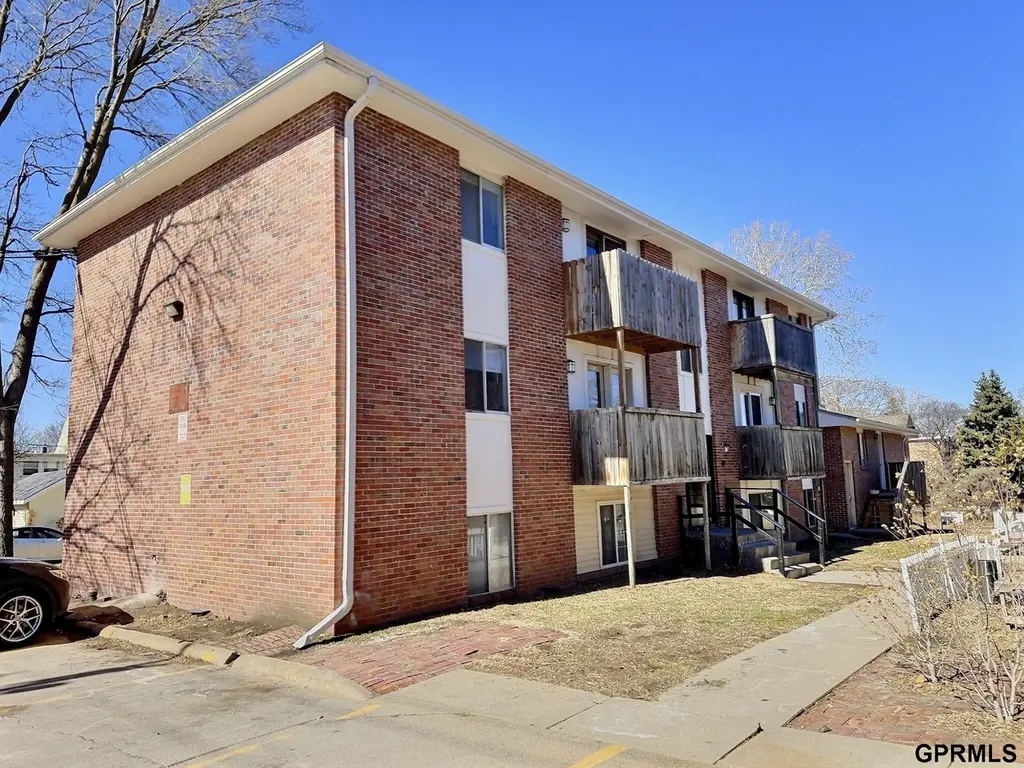
2125 A St · Lincoln, NE
Flood risk 1/10 · Minimal
- FEMA flood zone
- X (unshaded)
- Chance of flooding over 30 yrs
- 0.0%
- Est. flood insurance / yr
- $507 – $1,088
Fire risk 1/10 · Minimal
- Est. fire insurance / yr
- $1,161 – $2,155
Heat risk 3/10 · Minor
- Hot days now (above 104°F)
- 7 days/yr
- Hot days in 30 yrs
- 16 days/yr
Wind risk 2/10 · Minimal
- Chance of severe wind over 30 yrs
- —
Air-quality risk 1/10 · Minimal
- Unhealthy air days now
- 0 days/yr
- Unhealthy air days in 30 yrs
- 0 days/yr
Risk factors via First Street. Map © Google.
Why this score? — see what drove the D+ grade
The composite is a weighted blend of 9 inputs, each scored 0–100. Each bar is that input's sub-score; the figure is the points it added to the 100-point composite (weight × sub-score).
- Cash flow +16.1/30.0
- ARV discount +7.5/15.0
- DSCR +5.0/10.0
- Schools +4.4/10.0
- Livability +4.2/5.0
- 1% rule +3.8/10.0
- Rent growth +3.1/5.0
- Condition / age +2.5/5.0
- Appreciation +0.0/10.0
$660,000
🖨 Deal sheet (PDF) 📄 Offer letter ✓ Due diligence
Multi-family units
County records classify this as Multi-Family (5+ Unit). Listing-text estimate: 7 units. confirmed
5+ unit building — per-unit beds/baths from public records are typically unavailable; the breakdown below (if shown) is an estimate from the listing text.
Listing remarks MLS
Now offered at a sharpened price point, this fully occupied 7-unit apartment building delivers stable in-place income with a strong unit mix: four 2BR/1BA and three 1BR/1BA units driving broad tenant appeal. Off-street parking serves all tenants, with three rentable garage spaces adding income upside. Positioned on a main street along A Street with a city bus stop out front, the property offers easy access to downtown, universities, schools, shopping, and entertainment. Proximity to the Lincoln Children's Zoo and Sunken Gardens supports consistent occupancy. Recent capital improvements reduce near-term capex: new roof (2022), exterior grading (2023), and interior repainting (2024–2026). Solid operational history with documented maintenance records.
Key facts
- Main street location
- Off street parking
- City bus stop
Tags
Neighborhood map
What this means for you Summary
Snapshot
- This is a 4×2.0bd/1.0ba + 3×1.0bd/1.0ba units multifamily listed at $660k.
Deal economics
- At list price, monthly cash flow is $337 ($4k/yr) — positive. Per door: $48/mo.
- The deal already cash-flows at list — no discount required.
- To meet the 1% rule (rent ≥ 1% of price), the offer needs to be $578k (12.3% below list).
- Recommended offer: $578k (12.3% below list) — sets the bar for 1% rule.
- Cap rate 6.9% vs local median 3.0% in Lincoln — top-decile yield for the area; either an underpriced asset or a hidden risk that comps aren't pricing in. Stress-test before assuming the spread holds.
Location & tenants
- Location reads 85/100 on livability (#5 in NE, #545 nationally) — a professional / high-income tenant draw. Strengths: amenities A+, cost of living A+, housing A+; Watch: crime D+.
- Lincoln Public Schools (urban): math 50% / reading 53% proficiency, ranked #59 of 111 in NE (top 53%) — acceptable for families but not a draw, mixed tenant base, ~2y average lease.
- Zoned schools: Prescott Elementary School (math 37% / reading 52%, grade F, #289 of 502 statewide, top 63%, 505 students, 71% FRL); Irving Middle School (math 50% / reading 55%, grade C+, #42 of 128 statewide, top 32%, 890 students, 46% FRL); Lincoln High School (math 38% / reading 41%, grade F, #184 of 261 statewide, top 76%, 2,196 students, 59% FRL) — zoned schools average 59% FRL vs 37% district-wide (21 pts higher); higher-poverty schools than district average — tighter screening recommended.
- Market conditions: Rents rising (+2.4%/yr); 146 active listings in the ZIP; 1,940 units permitted in Lancaster County in 2024 (895 in 5+ unit buildings).
- At $5,785/mo this rent would consume 101% of the median local household income ($69k/yr) (locally 1252% of renters already pay >50% of income on rent) — very limited rent-growth headroom before tenants either downsize or default.
Forward outlook
- Local home prices are declining (-3.0%/yr); year-one equity from $5k of loan paydown is wiped out by about $20k of value loss. Plan a longer hold.
- Lancaster County population projected at +37% by 2050 — long-run rental-demand tailwind backs the buy-and-hold thesis.
Negotiation context
- It's been on market 114 days — a 9% lower offer ($601k) is reasonable based on typical stale-listing flexibility.
- 6 sale attempts since 15y ago with the ask held roughly flat each time — persistent listings suggest the price (not the market) is what's stuck; bring a comps-based counter.
- Current owner paid $560k; 18% above their basis — modest negotiation headroom, anchor on the comps not their cost.
Questions for the listing agent
- It's been on market 114 days. Have you received any prior offers? Is the seller open to a 12% concession, seller financing, or rate buy-down credit?
- Can we see the unit-by-unit rent roll, current vacancy, and any below-market leases? What's the average tenancy length?
- What capital expenditures (roof, boiler, parking lot, exteriors) have been made in the last 5 years, and what's planned in the next 2?
- Built in 1972 — when were the roof, HVAC, electrical panel, plumbing, and water heater last replaced?
- Why hasn't it sold? Are there any deal-killer items the seller is aware of (foundation, flood, title, zoning, code violations)?
- Is there a deadline driving the sale (1031 exchange, divorce, estate, relocation)? That informs how much negotiation room exists.
- Schools are A-rated — typically a magnet for longer-tenancy family renters. What's the average tenant stay here, and is there a school-zone premium baked into asking?
- Crime grade is D in this area — have there been break-ins, vandalism, or insurance claims at this property in the last 3 years? What carrier currently insures it and at what premium?
- The area grade is low — what's the realistic commute time and amenity access for the typical tenant pool here? Any planned neighborhood developments (good or bad) we should know about?
- What's the average days-on-market for RENTAL listings here right now (not sales)? A rising rental-DOM trend means longer vacancies and softer asking-rent achievability than the comps imply.
- What's the recent tenant-quality profile in this submarket — average credit score on applications, eviction rate, late-payment / NSF rate, and stable-employment percentage? A property-management company in the area should have these aggregated.
- How much new apartment / multifamily construction is in the pipeline within 1–3 miles? Heavy new supply (>2% of stock underway) typically softens rents 12–24 months out; light construction supports rent growth.
Investment metrics
- 1% rule
- 0.88% ✗
- Cap rate
- 6.91%
- Cash-on-cash
- 2.19%
- DSCR
- 1.10
- GRM
- 9.5
CMA / ARV
- ARV (median comp)
- $312,109
- List price
- $660,000
- Delta
- 111.46%
- Verdict
- OVERPRICED
- Comps
- 20 within 1.0 mi
Projected returns pro-forma
-3.0% appreciation · 2.38% rent growth · sell at horizon
- IRR
- -13.5%
- Equity multiple
- 0.52×
- Total profit
- $-89,160
- Equity at exit
- $98,408
- IRR
- -5.6%
- Equity multiple
- 0.65×
- Total profit
- $-64,968
- Equity at exit
- $57,065
Cash invested: $184,800 (down + closing). Projections, not guarantees.
Landlord ↔ Tenant lean methodology
- Overall (STATE)
- 83 Strongly Landlord-Friendly
- State Nebraska
- 83 Strongly Landlord-Friendly · R+13
- County
- — inherits STATE
- City
- — inherits STATE
ZIP-level market 68502
- Rents YoY
- 2.4%
- Active inventory
- 146
- Price-to-rent
- 65.2×
Monthly cashflow live
- Estimated rent
- $5,785 high interval (Pro) →
- Mortgage (P&I)
- −$3,461
- Tax from tax record
- −$497 /mo · $5,960/yr
- Insurance
- −$275
- HOA
- −$0
- Vacancy / Maint / Mgmt
- −$1,215
- Net cashflow
- $337
Break-even live
Sensitivity live
| Price | -10% $711 | -5% $524 | +0% $337 | +5% $151 | +10% $-36 |
|---|---|---|---|---|---|
| Rent | -10% $-120 | -5% $109 | +0% $337 | +5% $566 | +10% $794 |
| Rate | -1.0pp $670 | -0.5pp $505 | base $337 | +0.5pp $166 | +1.0pp $-8 |
7-unit breakdown (identical units grouped — click to expand)
| Units | Beds | Baths | Est. rent |
|---|---|---|---|
| 4× units | 2.0 | 1 | $3,372 |
| #1 | 2.0 | 1 | $843 |
| #2 | 2.0 | 1 | $843 |
| #3 | 2.0 | 1 | $843 |
| #4 | 2.0 | 1 | $843 |
| 3× units | 1.0 | 1 | $2,412 |
| #5 | 1.0 | 1 | $804 |
| #6 | 1.0 | 1 | $804 |
| #7 | 1.0 | 1 | $804 |
| Total (7 units) | $5,785 | ||
UW: 25.0% down · 7.5% · 30yr · 1.5% tax · 5.0% vac · 8.0% maint · 8.0% mgmt
Financing live
Cash to close
- Down payment
- $165,000
- Closing costs
- $19,800
- Reserves months
- —
- Total cash needed
- —
Loan-product check · same deal, 3 products live
Conventional
25% down · 7.5% · 30yr
- Down + closing
- —
- Monthly P&I
- —
- Monthly cashflow
- —
- DSCR
- —
- Eligible?
- —
Personal DTI + credit; lowest rate.
DSCR
20% down · 8.5% · 30yr
- Down + closing
- —
- Monthly P&I
- —
- Monthly cashflow
- —
- DSCR
- —
- Eligible?
- —
No personal income docs; deal must DSCR.
Hard money
10% down · 12.0% · 12mo
- Down + closing
- —
- Monthly P&I
- —
- Monthly cashflow
- —
- DSCR
- —
- Eligible?
- —
Short-term bridge; refi at stabilization.
Listing history 29 events
-
2026-06-21days on market $660,000 Active 114 DOM
-
2026-06-18days on market $660,000 Active 111 DOM
-
2026-06-17days on market $660,000 Active 110 DOM
-
2026-06-16days on market $660,000 Active 109 DOM
-
2026-06-15days on market $660,000 Active 108 DOM
-
2026-06-14days on market $660,000 Active 106 DOM
-
2026-06-10days on market $660,000 Active 103 DOM
-
2026-06-09days on market $660,000 Active 102 DOM
-
2026-06-08days on market $660,000 Active 101 DOM
-
2026-06-07days on market $660,000 Active 100 DOM
-
2026-06-05days on market $660,000 Active 97 DOM
-
2026-06-03days on market $660,000 Active 96 DOM
-
2026-06-02days on market $660,000 Active 95 DOM
-
2026-05-31days on market $660,000 Active 93 DOM
-
2026-05-30days on market $660,000 Active 92 DOM
-
2026-04-29price $660,000 764-char remark
Show marketing remark (764 chars)
Now offered at a sharpened price point, this fully occupied 7-unit apartment building delivers stable in-place income with a strong unit mix: four 2BR/1BA and three 1BR/1BA units driving broad tenant appeal. Off-street parking serves all tenants, with three rentable garage spaces adding income upside. Positioned on a main street along A Street with a city bus stop out front, the property offers easy access to downtown, universities, schools, shopping, and entertainment. Proximity to the Lincoln Children's Zoo and Sunken Gardens supports consistent occupancy. Recent capital improvements reduce near-term capex: new roof (2022), exterior grading (2023), and interior repainting (2024–2026). Solid operational history with documented maintenance records.
-
2026-02-27$685,000 New 764-char remark
Show marketing remark (764 chars)
Now offered at a sharpened price point, this fully occupied 7-unit apartment building delivers stable in-place income with a strong unit mix: four 2BR/1BA and three 1BR/1BA units driving broad tenant appeal. Off-street parking serves all tenants, with three rentable garage spaces adding income upside. Positioned on a main street along A Street with a city bus stop out front, the property offers easy access to downtown, universities, schools, shopping, and entertainment. Proximity to the Lincoln Children's Zoo and Sunken Gardens supports consistent occupancy. Recent capital improvements reduce near-term capex: new roof (2022), exterior grading (2023), and interior repainting (2024–2026). Solid operational history with documented maintenance records.
-
2023-04-14soldstatus $560,000 Sold 200-char remark
Show marketing remark (200 chars)
7-unit brick building, purpose-built investment opportunity, located just south of downtown Lincoln. (4) 2 Bedroom units, and (3) 1 Bedroom units. 5,430 sq ft NRA. 3 car garage and off-street parking.
-
2023-03-30status Pending 200-char remark
Show marketing remark (200 chars)
7-unit brick building, purpose-built investment opportunity, located just south of downtown Lincoln. (4) 2 Bedroom units, and (3) 1 Bedroom units. 5,430 sq ft NRA. 3 car garage and off-street parking.
-
2023-03-10$595,000 New 200-char remark
Show marketing remark (200 chars)
7-unit brick building, purpose-built investment opportunity, located just south of downtown Lincoln. (4) 2 Bedroom units, and (3) 1 Bedroom units. 5,430 sq ft NRA. 3 car garage and off-street parking.
-
2018-04-30soldstatus $240,000
-
2018-04-19historical
-
2018-04-19$240,000
-
2017-02-16historical
-
2016-12-16$285,000
-
2012-04-03historical
-
2012-02-08$219,900
-
2012-02-08historical
-
2011-11-02$219,000
ⓘ Source: listings_history table (triggers on properties + properties_extension) + one-shot
backfill from property_details.listing_events for pre-trigger history.
Tax reassessment forecast NE · Resets to sale price
- Current annual tax
- $5,960 · $497/mo
- Projected year-2 tax
- $11,418 · $952/mo
- Expected delta
- +$5,458/yr (+$455/mo · 91.6%)
ⓘ Screening estimate from a state-policy table — verify with the county assessor before closing.
Climate risk First Street
- Flood 1/10 Low FEMA zone X (unshaded) · 0% chance over 30 yrs
- Wildfire 1/10 Low
- Heat 3/10 Moderate 7 d/yr ≥104°F today · 16 d/yr by 30 yrs out
- Wind 2/10 Low
- Air quality 1/10 Low 0 unhealthy d/yr today · 0 by 30 yrs out
Nearby sold comps map
Loading sold comps map…
Walkable amenities ~0.75 mi
Loading nearby amenities…
Taxation est. · year 1
- Rental income
- $69,420
- − Mortgage interest
- −$36,970
- − Property taxes
- −$5,960
- − Insurance
- −$3,300
- − Repairs & maintenance
- −$5,554
- − Management
- −$5,554
- − Depreciation
- −$19,200
- Taxable loss
- −$7,117
- Est. tax savings @ 24.0%
- +$1,708
- After-tax cash flow
- $5,757/yr
For passive investors: Depreciation is non-cash, so a rental often shows a tax loss while cash-flowing — sheltering income. Rental losses are passive: they offset passive income freely, and up to $25,000/yr can offset ordinary (W-2) income if you actively participate and your MAGI is under $100k (phasing out to $0 by $150k); unused losses carry forward. On sale, claimed depreciation is recaptured at up to 25%, and gains may owe capital-gains tax (a 1031 exchange can defer both). Figures are a year-1 estimate at your 24.0% rate — not tax advice; consult a CPA.
Schools (NCES district)
- District
- Lincoln Public Schools
- NCES district ID
- 3172840
- Math proficiency
- 50% ▼ -6.00%
- Reading proficiency
- 53% ▼ -3.00%
- Median HH income
- $50,273
- Composite
- 44.05/100
- National rank
- #2880
- State rank
- #59 of 111 in NE
Livability — Lincoln
- Score
- 85/100
- State rank
- #5
- US rank
- #545
Category grades
Schools grade is shown separately in the Schools card above.
Census & demographics
- Census place
- Lincoln, NE
- County
- Lancaster County · 291,509 people
- City population
- 291,509
- Metro
- Lincoln, NE
- Population (ZIP)
- 25,846
- Household income
- $68,523
- Rent vs Own
- Severe rent burden
- 1252.0
Population outlook (Lancaster County) Hauer SSP2
- Today (2025)
- 352,806 people
- By 2030
- 377,899 · +7.1%
- By 2040
- 428,582 · +21.5%
- By 2050
- 483,103 · +36.9%
- By 2075
- 632,390 · +79.2%
- By 2100
- 759,513 · +115.3%
Race, ethnicity, and origin ACS 2023
- Neighborhood character
- Predominantly White (72%)
- Race & ethnicity
- White 72% Hispanic / Latino 13% Two or more races 11% Black 6% Asian 3%
- Hispanic origin (detail)
- Mexican 9%
- Common ancestry
- Portuguese 3% Romanian 2% Lithuanian 2%
- Foreign-born
- 10% · Canada, Vietnam, Philippines
- Languages at home
- 86% English-only · Spanish 9% Other Asian/Pacific 2% French/Haitian/Cajun 1%
Political lean MEDSL · Lancaster
- 2024 margin
- Toss-up / Even · D 51.4% · R 47.1% · Other 1.5%
- 2008→2024 swing
- -0.7pp no change · 2008: 5.0pp · 2024: 4.3pp
- All cycles
- 2024: D+4.3 2020: D+7.8 2016: D+0.1 2012: R+1.0 2008: D+5.0
Not yet ingested
- Civics
- —
Market trends
- HPI YoY
- ▼ -252.87%
- Current HPI
- 240.304
- Rent YoY
- ▲ 2.38%
- Metro
- Lincoln, NE
- State GDP YoY
- ▲ 0.68%
- F500 in state
- 2
Industry mix (Fortune 500 HQ in NE)
| Industry | F500 HQs | Revenue |
|---|---|---|
| Conglomerate | 1 | $371B |
|
||
Price history
+201.4% since first listed14 events — show timeline
- 2026-04-29 Price Changed $660,000 GPRMLS
- 2026-02-27 Listed $685,000 GPRMLS
- 2023-04-14 Sold (MLS) $560,000 GPRMLS
- 2023-03-30 Pending — GPRMLS
- 2023-03-10 Listed $595,000 GPRMLS
- 2018-04-30 Sold (MLS) $240,000 GPRMLS
- 2018-04-19 Listed $240,000 GPRMLS
- 2018-04-19 Listing Removed — GPRMLS
- 2017-02-16 Listing Removed — GPRMLS
- 2016-12-16 Listed $285,000 GPRMLS
- 2012-04-03 Listing Removed — GPRMLS
- 2012-02-08 Listing Removed — GPRMLS
- 2012-02-08 Listed $219,900 GPRMLS
- 2011-11-02 Listed $219,000 GPRMLS
Property tax history
+3.8%/yrLatest (2025): $5,960 · -3.4% YoY. Source: county tax records.
Cash-flow waterfall
monthlySold comps — $/sqft
last 12 mo · ≤1 miLoading sold comps…