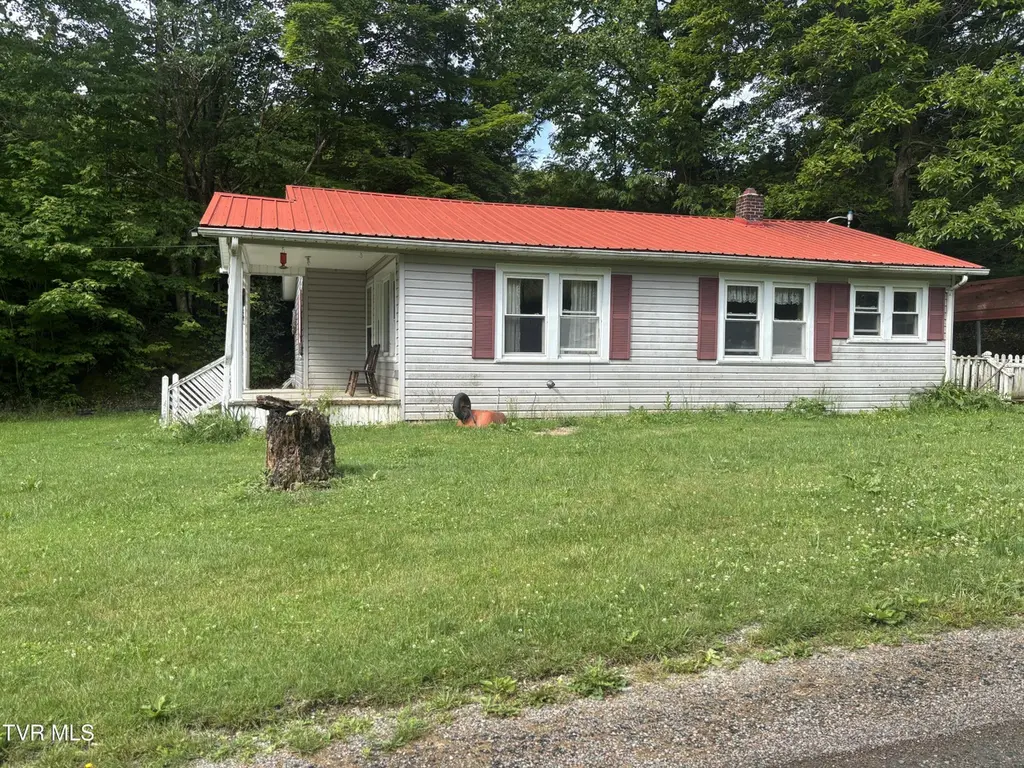
141 Canter Rd · Mountain City, TN
Flood risk 10/10 · Severe
- FEMA flood zone
- X (unshaded)
- Chance of flooding over 30 yrs
- 0.99%
- Est. flood insurance / yr
- $473 – $860
Fire risk 4/10 · Minor
- Est. fire insurance / yr
- $949 – $1,763
Heat risk 2/10 · Minimal
- Hot days now (above 87°F)
- 8 days/yr
- Hot days in 30 yrs
- 23 days/yr
Wind risk 2/10 · Minimal
- Chance of severe wind over 30 yrs
- —
Air-quality risk 1/10 · Minimal
- Unhealthy air days now
- 0 days/yr
- Unhealthy air days in 30 yrs
- 0 days/yr
Risk factors via First Street. Map © Google.
Why this score? — see what drove the B+ grade
The composite is a weighted blend of 9 inputs, each scored 0–100. Each bar is that input's sub-score; the figure is the points it added to the 100-point composite (weight × sub-score).
- Cash flow +30.0/30.0
- 1% rule +10.0/10.0
- DSCR +10.0/10.0
- ARV discount +7.5/15.0
- Appreciation +7.3/10.0
- Livability +3.2/5.0
- Rent growth +2.5/5.0
- Condition / age +2.5/5.0
- Schools +2.4/10.0
$99,000
🖨 Deal sheet 📄 Offer letter ✓ Due diligence
Listing remarks MLS
Fixer Upper! Conveniently located on Canter Road, just off Highway 421 in Trade, Tennessee, and just minutes from Boone, NC. If you're willing to do some work, don't miss this opportunity.
Key facts
- Good roof
- Good bones
- Almost an acre
Tags
Property features AI
Finance
- HOA & community: Association landscaping
Exterior
- Parking: Driveway; Detached parking; Gravel parking
- Utilities: Spring water source; Electricity connected; Water connected; Septic tank
- Home design: Single-family house; One story; Residential property; Fixer condition
- Construction: Vinyl siding; Metal roof
- Exterior features: Front porch; Shed(s); Cleared, level, mountainous and wooded lot
Interior
- Kitchen: Range; Refrigerator
- Bedrooms: Total of 5 rooms (includes bedrooms and living areas)
- Flooring: Hardwood; Laminate
- Bathrooms: 2 full bathrooms
- Heating & cooling: Kerosene heating; Ceiling fan(s) for cooling
- Interior features: Range; Refrigerator; Hardwood and laminate flooring; Crawl space basement
Neighborhood map
What this means for you Summary
Snapshot
- This is a 3-bed/2.0-bath single-family listed at $99k.
Deal economics
- At list price, monthly cash flow is $931 ($11k/yr) — positive.
- The deal already cash-flows at list — no discount required.
- Meets the 1% rule at list price ($2k rent vs $99k).
- Cap rate 18.3% vs local median 2.1% in Mountain City — top-decile yield for the area; either an underpriced asset or a hidden risk that comps aren't pricing in. Stress-test before assuming the spread holds.
Location & tenants
- Location reads 63/100 on livability (#191 in TN) — a middle-class / working-renter tenant base. Strengths: crime A+, cost of living A+; Watch: housing C-, health & safety C-, amenities F.
- Johnson County (rural): math 27% / reading 31% proficiency, ranked #69 of 139 in TN (top 50%) — low school quality limits family demand, transient renter base, plan for 1-2y turnover.
- Zoned schools: Roan Creek Elementary (math 32% / reading 27%, grade F, #423 of 952 statewide, top 48%, 345 students, 0% FRL); Johnson Co Middle School (math 28% / reading 31%, grade F, #107 of 333 statewide, top 33%, 284 students, 0% FRL); Johnson Co High School (math 17% / reading 32%, grade F, #129 of 332 statewide, top 43%, 643 students, 0% FRL) — zoned schools average 0% FRL vs 59% district-wide (59 pts lower); this property's tenant base skews higher-income than the district average.
- Market conditions: 15 active listings in the ZIP; 1 comparable units currently listed for rent nearby; 6 units permitted in Johnson County in 2024 (0 in 5+ unit buildings).
Forward outlook
- In year one you build about $5k of equity ($684 loan paydown + $5k appreciation (4.6% local appreciation)).
- Johnson County population projected at -21% by 2050 — secular population decline; favor cash flow + early exit over multi-decade hold.
- At projected returns (4.6% appreciation + 3.0% rent growth), your $28k cash investment doubles in ~2 years — after that, you're playing with house money.
- By year 7, paydown + projected appreciation supports a ~$34k cash-out refi (75% LTV) — recoverable capital for the next deal without selling this one.
Negotiation context
- Only 12 days on market — expect competitive offers; lowballing is unlikely to land.
- 2 sale attempts since 5y ago with the ask held roughly flat each time — persistent listings suggest the price (not the market) is what's stuck; bring a comps-based counter.
- Current owner paid $47k; list at $99k implies a 111% gain — meaningful room to come down on a strong offer.
Risks & watch-outs
- Watch-outs: flood insurance adds $56/mo; built in 1954 — expect roof / HVAC / electrical / plumbing capex.
- Climate carrying-cost: severe flood risk — expect insurance premiums to compound above CPI over the hold.
Questions for the listing agent
- Built in 1954 — when were the roof, HVAC, electrical panel, plumbing, and water heater last replaced?
- What's the actual annual flood-insurance premium (NFIP or private), and is the property in a SFHA with mandatory coverage?
- Is there a deadline driving the sale (1031 exchange, divorce, estate, relocation)? That informs how much negotiation room exists.
- Schools are F-rated, which usually means shorter tenancies and higher turnover. Who's the typical renter profile here, and what's been the actual vacancy rate?
- What's the average days-on-market for RENTAL listings here right now (not sales)? A rising rental-DOM trend means longer vacancies and softer asking-rent achievability than the comps imply.
- What's the recent tenant-quality profile in this submarket — average credit score on applications, eviction rate, late-payment / NSF rate, and stable-employment percentage? A property-management company in the area should have these aggregated.
- How much new for-sale + rental construction is in the pipeline within 1–3 miles? Heavy new supply typically softens prices + rents 12–24 months out; constrained supply supports both.
Investment metrics
- 1% rule
- 2.02% ✓
- Cap rate
- 18.25%
- Cash-on-cash
- 42.71%
- DSCR
- 2.90
- GRM
- 4.1
CMA / ARV
- ARV (on-the-fly)
- $271,212
- Comps found
- 1
Show comp detail 1 sale within ~0.75 mi
| Address | Dist | Beds/Ba | Sqft | Sold | Price | $/sf | Match |
|---|---|---|---|---|---|---|---|
| 302 Grover Reece Rd | 0.21mi | 3/2.0 | 1,087 (-7%) | 2mo | $253,000 | $233 | 78 |
Match score weights: distance 35% · size 25% · config 20% · recency 20%. Top-matched comps best support the ARV.
Projected returns pro-forma
4.6% appreciation · 3.0% rent growth · sell at horizon
- IRR
- 48.0%
- Equity multiple
- 3.88×
- Total profit
- $79,852
- Equity at exit
- $53,683
- IRR
- 46.2%
- Equity multiple
- 7.90×
- Total profit
- $191,286
- Equity at exit
- $90,710
Cash invested: $27,720 (down + closing). Projections, not guarantees.
Landlord ↔ Tenant lean methodology
- Overall (STATE)
- 87 Strongly Landlord-Friendly
- State Tennessee
- 87 Strongly Landlord-Friendly · R+13
- County
- — inherits STATE
- City
- — inherits STATE
ZIP-level market 37691
- Home prices YoY
- 1.5%
- Active inventory
- 15
- Price-to-rent
- 4.1×
Monthly cashflow live
- Estimated rent
- $2,000 medium interval (Pro) →
- Mortgage (P&I)
- −$519
- Tax from tax record
- −$33 /mo · $396/yr
- Insurance
- −$41
- Flood insurance flood zone
- −$56 /mo · $666/yr
- HOA
- −$0
- Vacancy / Maint / Mgmt
- −$420
- Net cashflow
- $931
Break-even live
UW: 25.0% down · 7.5% · 30yr · 1.5% tax · 5.0% vac · 8.0% maint · 8.0% mgmt
Financing live
Cash to close
- Down payment
- $24,750
- Closing costs
- $2,970
- Reserves months
- —
- Total cash needed
- —
Loan-product check · same deal, 3 products live
Conventional
25% down · 7.5% · 30yr
- Down + closing
- —
- Monthly P&I
- —
- Monthly cashflow
- —
- DSCR
- —
- Eligible?
- —
Personal DTI + credit; lowest rate.
DSCR
20% down · 8.5% · 30yr
- Down + closing
- —
- Monthly P&I
- —
- Monthly cashflow
- —
- DSCR
- —
- Eligible?
- —
No personal income docs; deal must DSCR.
Hard money
10% down · 12.0% · 12mo
- Down + closing
- —
- Monthly P&I
- —
- Monthly cashflow
- —
- DSCR
- —
- Eligible?
- —
Short-term bridge; refi at stabilization.
Rent comps 1 comps
| Address | Beds | Baths | Sqft | Rent | $/sqft | DOM | Units | Dist |
|---|---|---|---|---|---|---|---|---|
| 729 Drakes Creek Rd Trade, TN | 3.0 | 1.0 | 1265 | $2,000 | $1.58 | 13d | 1 | 1.32mi |
Listing history 10 events
-
2026-06-09status $99,000 Pending 12 DOM
-
2026-06-08days on market $99,000 Active 12 DOM
-
2026-06-07days on market $99,000 Active 11 DOM
-
2026-06-02days on market $99,000 Active 6 DOM
-
2026-06-01days on market $99,000 Active 5 DOM
-
2026-05-31days on market $99,000 Active 4 DOM
-
2026-05-30days on market $99,000 Active 3 DOM
-
2026-05-27$99,000 Active
-
2021-11-23soldstatus $47,000 188-char remark
Show marketing remark (188 chars)
Fixer Upper! Conveniently located on Canter Road, just off Highway 421 in Trade, Tennessee, and just minutes from Boone, NC. If you're willing to do some work, don't miss this opportunity.
-
2021-10-14$53,000 188-char remark
Show marketing remark (188 chars)
Fixer Upper! Conveniently located on Canter Road, just off Highway 421 in Trade, Tennessee, and just minutes from Boone, NC. If you're willing to do some work, don't miss this opportunity.
ⓘ Source: listings_history table (triggers on properties + properties_extension) + one-shot
backfill from property_details.listing_events for pre-trigger history.
Tax reassessment forecast TN · Resets to sale price
- Current annual tax
- $396 · $33/mo
- Projected year-2 tax
- $703 · $59/mo
- Expected delta
- +$307/yr (+$26/mo · 77.5%)
ⓘ Screening estimate from a state-policy table — verify with the county assessor before closing.
Climate risk First Street
- Flood 10/10 Extreme FEMA zone X (unshaded) · 99% chance over 30 yrs
- Wildfire 4/10 Moderate
- Heat 2/10 Low 8 d/yr ≥87°F today · 23 d/yr by 30 yrs out
- Wind 2/10 Low
- Air quality 1/10 Low 0 unhealthy d/yr today · 0 by 30 yrs out
Nearby sold comps map
Loading sold comps map…
Walkable amenities ~0.75 mi
Loading nearby amenities…
Taxation est. · year 1
- Rental income
- $24,000
- − Mortgage interest
- −$5,546
- − Property taxes
- −$396
- − Insurance
- −$1,162
- − Repairs & maintenance
- −$1,920
- − Management
- −$1,920
- − Depreciation
- −$2,880
- Taxable income
- $10,177
- Est. tax owed @ 24.0%
- −$2,442
- After-tax cash flow
- $8,730/yr
For passive investors: Depreciation is non-cash, so a rental often shows a tax loss while cash-flowing — sheltering income. Rental losses are passive: they offset passive income freely, and up to $25,000/yr can offset ordinary (W-2) income if you actively participate and your MAGI is under $100k (phasing out to $0 by $150k); unused losses carry forward. On sale, claimed depreciation is recaptured at up to 25%, and gains may owe capital-gains tax (a 1031 exchange can defer both). Figures are a year-1 estimate at your 24.0% rate — not tax advice; consult a CPA.
Schools (NCES district)
- District
- Johnson County
- NCES district ID
- 4702160
- Math proficiency
- 27% ▼ -11.00%
- Reading proficiency
- 31% ▬ 0.00%
- Median HH income
- $31,298
- Composite
- 23.58/100
- National rank
- #7852
- State rank
- #69 of 139 in TN
Livability — Mountain City
- Score
- 63/100
- State rank
- #191
- US rank
- #15252
Category grades
Schools grade is shown separately in the Schools card above.
Census & demographics
- Population (ZIP)
- 532
Population outlook (Johnson County) Hauer SSP2
- Today (2025)
- 16,842 people
- By 2030
- 16,158 · -4.1%
- By 2040
- 14,682 · -12.8%
- By 2050
- 13,306 · -21.0%
- By 2075
- 11,087 · -34.2%
- By 2100
- 9,360 · -44.4%
Race, ethnicity, and origin ACS 2023
- Neighborhood character
- Predominantly White (91%)
- Race & ethnicity
- White 91% Two or more races 9%
- Common ancestry
- Iranian 9% Slovak 7% German 3%
Political lean MEDSL · Johnson
- 2024 margin
- Solid R (+69.3) · D 15.0% · R 84.3%
- 2008→2024 swing
- -27.1pp toward R · 2008: -42.2pp · 2024: -69.3pp
- All cycles
- 2024: R+69.3 2020: R+66.9 2016: R+67.3 2012: R+50.5 2008: R+42.2
Not yet ingested
- Civics
- —
Market trends
- HPI YoY
- ▲ 4.60%
- Current HPI
- 302.6398
- Rent YoY
- —
- Metro
- —
- State GDP YoY
- ▲ 2.78%
- F500 in state
- 22
Industry mix (Fortune 500 HQ in TN)
| Industry | F500 HQs | Revenue |
|---|---|---|
| Healthcare | 3 | $91B |
|
||
| Retail | 3 | $72B |
|
||
| Transportation / Logistics | 1 | $88B |
|
||
| Paper / Packaging | 1 | $19B |
|
||
| Insurance | 1 | $13B |
|
||
| Energy | 1 | $12B |
|
||
Price history
+86.8% since first listed3 events — show timeline
- 2026-05-27 Listed $99,000 TVRMLS
- 2021-11-23 Sold (MLS) $47,000 TVRMLS
- 2021-10-14 Listed $53,000 TVRMLS
Property tax history
-0.7%/yrLatest (2025): $396 · +0.0% YoY. Source: county tax records.
Cash-flow waterfall
monthlySold comps — $/sqft
last 12 mo · ≤1 miLoading sold comps…