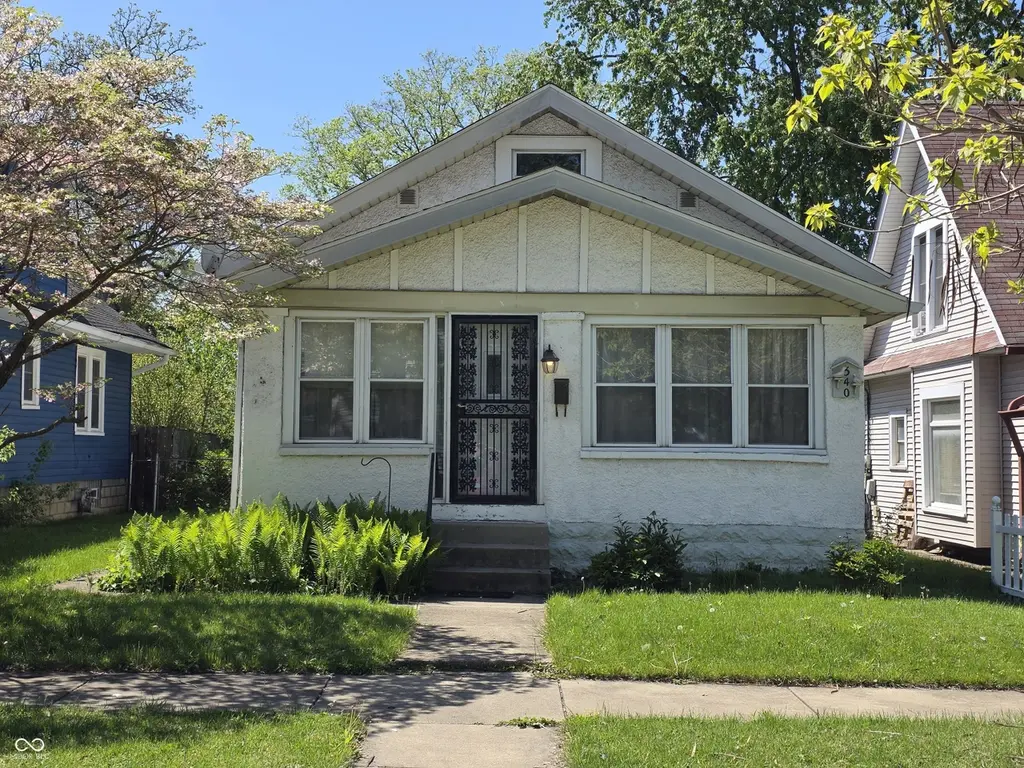
340 S Grand Ave · Indianapolis city (balance), IN
Flood risk 1/10 · Minimal
- FEMA flood zone
- X (unshaded)
- Chance of flooding over 30 yrs
- 0.0%
- Est. flood insurance / yr
- $473 – $860
Fire risk 1/10 · Minimal
- Est. fire insurance / yr
- $717 – $1,331
Heat risk 3/10 · Minor
- Hot days now (above 102°F)
- 7 days/yr
- Hot days in 30 yrs
- 19 days/yr
Wind risk 2/10 · Minimal
- Chance of severe wind over 30 yrs
- 1.0%
Air-quality risk 4/10 · Minor
- Unhealthy air days now
- 5 days/yr
- Unhealthy air days in 30 yrs
- 7 days/yr
Risk factors via First Street. Map © Google.
Why this score? — see what drove the D grade
The composite is a weighted blend of 9 inputs, each scored 0–100. Each bar is that input's sub-score; the figure is the points it added to the 100-point composite (weight × sub-score).
- ARV discount +15.0/15.0
- Cash flow +11.7/30.0
- 1% rule +4.0/10.0
- DSCR +3.4/10.0
- Rent growth +3.2/5.0
- Livability +2.5/5.0
- Condition / age +2.5/5.0
- Schools +1.4/10.0
- Appreciation +0.0/10.0
$129,900
🖨 Deal sheet (PDF) 📄 Offer letter ✓ Due diligence
Listing remarks
This single family bungalow offers 2 comfortable bedrooms on main level, with a large 3rd bedroom upstairs, provides ample private space. A well-appointed full bathroom serves the home's needs. Further expanding the property's potential is a basement, offering additional storage or the possibility for future customization. This 1.5-story home set on a generous 6,795 square foot lot, with a 2 car detached garage. Discover the possibilities this bungalow holds for creating your ideal home. This home would make a great rental. Sold in as-is condition.
Key facts
- Full bathroom
- Basement
- Detached garage
Tags
Property features AI
Finance
- Other: Property type: Residential
Exterior
- Parking: Detached 2-car garage; Guest street parking; Service door access to garage
- Utilities: Public water; Municipal sewer; Electricity connected; Natural gas connected; Solid waste service
- Home design: Single family residence; One and one-half story
- Construction: Stucco exterior; Block foundation
- Exterior features: Glass-enclosed patio/porch; Curbs and sidewalks; Small trees (under 20 ft)
Interior
- Kitchen: Gas oven; Refrigerator; Eat-in kitchen
- Bedrooms: 3 bedrooms total — 2 on the main level, 1 on the upper level
- Bathrooms: 1 full bathroom
- Heating & cooling: Forced air heating (natural gas); Central air conditioning
- Interior features: Attic stairway; Eat-in kitchen; Unfinished basement
- Laundry & utility: Washer; Dryer
Neighborhood map
What this means for you Summary
Snapshot
- This is a 2-bed/1.0-bath single-family listed at $130k.
Deal economics
- At list price, monthly cash flow is $-39 ($-470/yr) — negative.
- To cash-flow at today's rent, offer at most $123k (5.3% below list).
- To meet the 1% rule (rent ≥ 1% of price), the offer needs to be $117k (10.0% below list).
- Recommended offer: $117k (10.0% below list) — sets the bar for 1% rule.
- Cap rate 5.9% vs local median 4.4% in Indianapolis city (balance) — top-decile yield for the area; either an underpriced asset or a hidden risk that comps aren't pricing in. Stress-test before assuming the spread holds.
Location & tenants
- Location reads: area grade D — affects rentability + tenant quality, not the cash-flow math above.
- Indianapolis Public Schools (urban): math 14% / reading 20% proficiency, ranked #286 of 301 in IN (top 95%) — low school quality limits family demand, transient renter base, plan for 1-2y turnover; 77% free/reduced lunch — lower-income household profile, screen leases tightly.
- Zoned schools: Frederick Douglass School 19 (math 9% / reading 13%, grade F, #909 of 994 statewide, top 92%, 444 students, 81% FRL); H L Harshman Middle School (math 3% / reading 16%, grade F, #316 of 330 statewide, top 96%, 549 students, 84% FRL).
- Market conditions: Rents rising (+2.6%/yr); 143 active listings in the ZIP; 40 comparable units currently listed for rent nearby; rentals at typical pace (median 26d on market — plan ~3-4 weeks tenant-placement turnaround); 40% of comp listings sitting > 30 days — soft ceiling on asking rent; 1,906 units permitted in Marion County in 2024 (621 in 5+ unit buildings).
Forward outlook
- Local home prices are declining (-3.0%/yr); year-one equity from $898 of loan paydown is wiped out by about $4k of value loss. Plan a longer hold.
- Marion County population projected at +18% by 2050 — long-run rental-demand tailwind backs the buy-and-hold thesis.
Negotiation context
- It's been on market 33 days — a 3% lower offer ($126k) is reasonable based on typical stale-listing flexibility.
- 2 sale attempts; this cycle's ask has dropped $9k (6%) from the opening price — seller is motivated, your offer sets the floor, not the list.
Risks & watch-outs
- Watch-outs: built in 1915 — expect roof / HVAC / electrical / plumbing capex.
Questions for the listing agent
- What do current leases actually rent for vs. the listed asking? Can we see a recent rent roll and the last 12 months of T-12 income?
- It's been on market 33 days. Have you received any prior offers? Is the seller open to a 10% concession, seller financing, or rate buy-down credit?
- Built in 1915 — when were the roof, HVAC, electrical panel, plumbing, and water heater last replaced?
- Is there a deadline driving the sale (1031 exchange, divorce, estate, relocation)? That informs how much negotiation room exists.
- The area grade is low — what's the realistic commute time and amenity access for the typical tenant pool here? Any planned neighborhood developments (good or bad) we should know about?
- What's the average days-on-market for RENTAL listings here right now (not sales)? A rising rental-DOM trend means longer vacancies and softer asking-rent achievability than the comps imply.
- What's the recent tenant-quality profile in this submarket — average credit score on applications, eviction rate, late-payment / NSF rate, and stable-employment percentage? A property-management company in the area should have these aggregated.
- How much new for-sale + rental construction is in the pipeline within 1–3 miles? Heavy new supply typically softens prices + rents 12–24 months out; constrained supply supports both.
Investment metrics
- 1% rule
- 0.90% ✗
- Cap rate
- 5.93%
- Cash-on-cash
- -1.29%
- DSCR
- 0.94
- GRM
- 9.3
CMA / ARV
- ARV (median comp)
- $168,394
- List price
- $129,900
- Delta
- -22.86%
- Verdict
- UNDERPRICED
- Comps
- 20 within 1.0 mi
Show comp detail 12 sales within ~0.75 mi
| Address | Dist | Beds/Ba | Sqft | Sold | Price | $/sf | Match |
|---|---|---|---|---|---|---|---|
| 330 S Grand Ave | 0.01mi | 3/1.0 (+1) | 1,300 (+7%) | 7mo | $149,500 | $115 | 77 |
| 5109 E Burgess Ave | 0.05mi | 2/1.0 | 1,152 (-5%) | 21mo | $107,500 | $93 | 71 |
| 4830 Wentworth Blvd | 0.29mi | 2/1.0 | 1,152 (-5%) | 10mo | $132,000 | $115 | 69 |
| 729 Auvergne Ave | 0.43mi | 3/1.0 (+1) | 1,152 (-5%) | 1mo | $149,900 | $130 | 66 |
| 620 S Irvington Ave | 0.42mi | 2/1.0 | 1,340 (+10%) | 8mo | $182,000 | $136 | 56 |
| 4805 Wentworth Blvd | 0.35mi | 2/1.0 | 1,104 (-9%) | 20mo | $144,500 | $131 | 51 |
| 5332 Fletcher Ave | 0.36mi | 3/1.0 (+1) | 1,078 (-11%) | 10mo | $139,000 | $129 | 51 |
| 4425 Hoyt Ave | 0.72mi | 3/1.0 (+1) | 1,128 (-7%) | 2mo | $160,000 | $142 | 48 |
| 5508 E Rawles Ter | 0.46mi | 3/1.0 (+1) | 1,092 (-10%) | 16mo | $144,000 | $132 | 44 |
| 5810 Greenfield Ave | 0.73mi | 3/1.0 (+1) | 1,099 (-10%) | 2mo | $160,000 | $146 | 43 |
| 781 S Emerson Ave | 0.47mi | 3/1.0 (+1) | 1,104 (-9%) | 18mo | $115,000 | $104 | 43 |
| 4349 Fletcher Ave | 0.70mi | 2/1.0 | 1,080 (-11%) | 14mo | $178,000 | $165 | 37 |
Match score weights: distance 35% · size 25% · config 20% · recency 20%. Top-matched comps best support the ARV.
Projected returns pro-forma
-3.0% appreciation · 2.63% rent growth · sell at horizon
- IRR
- -18.8%
- Equity multiple
- 0.34×
- Total profit
- $-23,918
- Equity at exit
- $19,369
- IRR
- -12.0%
- Equity multiple
- 0.30×
- Total profit
- $-25,569
- Equity at exit
- $11,231
Cash invested: $36,372 (down + closing). Projections, not guarantees.
Landlord ↔ Tenant lean methodology
- Overall (STATE)
- 90 Strongly Landlord-Friendly
- State Indiana
- 90 Strongly Landlord-Friendly · R+11
- County
- — inherits STATE
- City
- — inherits STATE
ZIP-level market 46219
- Rents YoY
- 2.6%
- Active inventory
- 143
- Price-to-rent
- 9.3×
Monthly cashflow live
- Estimated rent
- $1,169 high interval (Pro) →
- Mortgage (P&I)
- −$681
- Tax from tax record
- −$227 /mo · $2,724/yr
- Insurance
- −$54
- HOA
- −$0
- Vacancy / Maint / Mgmt
- −$245
- Net cashflow
- $-39
Break-even live
Sensitivity live
| Price | -10% $34 | -5% $-2 | +0% $-39 | +5% $-76 | +10% $-113 |
|---|---|---|---|---|---|
| Rent | -10% $-131 | -5% $-85 | +0% $-39 | +5% $7 | +10% $53 |
| Rate | -1.0pp $26 | -0.5pp $-6 | base $-39 | +0.5pp $-73 | +1.0pp $-107 |
UW: 25.0% down · 7.5% · 30yr · 1.5% tax · 5.0% vac · 8.0% maint · 8.0% mgmt
Financing live
Cash to close
- Down payment
- $32,475
- Closing costs
- $3,897
- Reserves months
- —
- Total cash needed
- —
Loan-product check · same deal, 3 products live
Conventional
25% down · 7.5% · 30yr
- Down + closing
- —
- Monthly P&I
- —
- Monthly cashflow
- —
- DSCR
- —
- Eligible?
- —
Personal DTI + credit; lowest rate.
DSCR
20% down · 8.5% · 30yr
- Down + closing
- —
- Monthly P&I
- —
- Monthly cashflow
- —
- DSCR
- —
- Eligible?
- —
No personal income docs; deal must DSCR.
Hard money
10% down · 12.0% · 12mo
- Down + closing
- —
- Monthly P&I
- —
- Monthly cashflow
- —
- DSCR
- —
- Eligible?
- —
Short-term bridge; refi at stabilization.
Rent comps 40 comps
| Address | Beds | Baths | Sqft | Rent | $/sqft | DOM | Units | Dist |
|---|---|---|---|---|---|---|---|---|
| 5131 E Burgess Ave Indianapolis, IN | 2.0 | 1.0 | 816 | $1,100 | $1.35 | 45d | 1 | 0.07mi |
| 5131 E Burgess Ave Indianapolis, IN | 2.0 | 1.0 | 816 | $1,100 | $1.35 | 0d | 1 | 0.07mi |
| 4931 Orion Ave Indianapolis, IN | 2.0 | 1.0 | 1200 | $1,450 | $1.21 | 25d | 1 | 0.15mi |
| 4919 Orion Ave Indianapolis, IN | 2.0 | 1.0 | 766 | $875 | $1.14 | 45d | 1 | 0.18mi |
| 25 S Emerson Ave Indianapolis, IN | 1.0 | 1.0 | 710 | $649 | $0.91 | 45d | 1 | 0.38mi |
| 4 N Butler Ave Unit 11 Indianapolis, IN | 2.0 | 1.0 | 850 | $750 | $0.88 | 6d | 1 | 0.46mi |
| 4 N Butler Ave Unit 8 Indianapolis, IN | 2.0 | 1.0 | 850 | $800 | $0.94 | 45d | 1 | 0.46mi |
| 4926 E Washington St Apt 5 Indianapolis, IN | 1.0 | 1.0 | 700 | $895 | $1.28 | 45d | 1 | 0.49mi |
| 4831 E Washington St Unit 4 Indianapolis, IN | 2.0 | 2.0 | 1000 | $995 | $0.99 | 25d | 1 | 0.49mi |
| 528 S Bosart Ave Indianapolis, IN | 3.0 | 1.0 | 720 | $1,305 | $1.81 | 45d | 1 | 0.50mi |
| 4815 E Washington St Unit 4815-12 Indianapolis, IN | 1.0 | 1.0 | 700 | $950 | $1.36 | 45d | 1 | 0.51mi |
| 4741 E Washington St Indianapolis, IN | 1.0 | 1.0 | 700 | $950 | $1.36 | 23d | 1 | 0.54mi |
| 5250 E Market St Unit 5252 Indianapolis, IN | 2.0 | 1.0 | 1000 | $1,350 | $1.35 | 16d | 1 | 0.54mi |
| 750 S Dequincy St Indianapolis, IN | 3.0 | 1.5 | 936 | $1,500 | $1.60 | 45d | 1 | 0.55mi |
| 306 N Riley Ave Indianapolis, IN | 3.0 | 1.0 | 1320 | $1,095 | $0.83 | 19d | 1 | 0.64mi |
| 25 N Drexel Ave Unit A Indianapolis, IN | 3.0 | 2.0 | 1250 | $1,325 | $1.06 | 45d | 1 | 0.66mi |
| 4318 Spann Ave Indianapolis, IN | 3.0 | 1.0 | 1411 | $1,200 | $0.85 | 45d | 1 | 0.71mi |
| 739 Temperance Ave Indianapolis, IN | 3.0 | 1.0 | 1136 | $1,350 | $1.19 | 45d | 1 | 0.72mi |
| 415 N Dequincy St Indianapolis, IN | 3.0 | 2.0 | 1250 | $1,900 | $1.52 | 16d | 1 | 0.73mi |
| 508 Emerson Ave Indianapolis, IN | 3.0 | 1.5 | 1094 | $1,150 | $1.05 | 16d | 1 | 0.78mi |
| 508 N Emerson Ave Unit 506 Indianapolis, IN | 2.0 | 1.0 | 950 | $950 | $1.00 | 16d | 1 | 0.78mi |
| 29 S Audubon Rd Indianapolis, IN | 1.0–2.0 | 1.0 | 670 | $989 | $1.48 | 16d | 5 | 0.79mi |
| 5105 E North St Indianapolis, IN | 2.0 | 2.0 | 1180 | $2,250 | $1.91 | 45d | 1 | 0.81mi |
| 606 N Emerson Ave Indianapolis, IN | 2.0 | 1.5 | 1372 | $2,450 | $1.79 | 25d | 1 | 0.82mi |
| 4214 E Washington St Indianapolis, IN | 3.0 | 2.0 | 961 | $1,195 | $1.24 | 9d | 1 | 0.83mi |
| 4214 E Washington St Indianapolis, IN | 3.0 | 2.0 | 961 | $1,145 | $1.19 | 0d | 1 | 0.83mi |
| 5750 E Washington St Indianapolis, IN | 2.0 | 1.0 | 1186 | $1,100 | $0.93 | 5d | 2 | 0.88mi |
| 4114 E Washington St Indianapolis, IN | 2.0 | 1.0 | 909 | $1,100 | $1.21 | 46d | 1 | 0.88mi |
| 5819 E Washington St #13 Indianapolis, IN | 1.0 | 1.0 | 700 | $795 | $1.14 | 45d | 1 | 0.89mi |
| 628 N Riley Ave Indianapolis, IN | 2.0 | 1.5 | 948 | $1,295 | $1.37 | 25d | 1 | 0.89mi |
| 338 S Arlington Ave Indianapolis, IN | 2.0 | 2.0 | 1303 | $1,610 | $1.24 | 25d | 1 | 0.93mi |
| 338 S Arlington Ave Apt 204 Indianapolis, IN | 2.0 | 2.0 | 1303 | $1,674 | $1.28 | 16d | 1 | 0.94mi |
| 119 N Grant Ave Indianapolis, IN | 3.0 | 1.0 | 1408 | $1,195 | $0.85 | 45d | 1 | 0.96mi |
| 706 N Bosart Ave Indianapolis, IN | 2.0 | 1.0 | 1000 | $1,070 | $1.07 | 25d | 1 | 0.98mi |
| 729 N Bosart Ave Indianapolis, IN | 2.0 | 1.0 | 888 | $1,195 | $1.35 | 25d | 1 | 1.00mi |
| 622 N Linwood Ave Indianapolis, IN | 3.0 | 2.0 | 985 | $1,299 | $1.32 | 45d | 1 | 1.02mi |
| 3906 Hoyt Ave Indianapolis, IN | 2.0 | 1.0 | 912 | $1,250 | $1.37 | 9d | 1 | 1.03mi |
| 5914 E Washington St Indianapolis, IN | 1.0 | 1.0 | 700 | $825 | $1.18 | 25d | 1 | 1.04mi |
| 775 Dequincy St Indianapolis, IN | 1.0 | 1.0 | 784 | $875 | $1.12 | 25d | 1 | 1.07mi |
| 8 S Bradley Ave Indianapolis, IN | 2.0 | 1.0 | 1300 | $950 | $0.73 | 25d | 1 | 1.07mi |
Listing history 5 events
-
2026-06-07statusdays on market $129,900 Pending 33 DOM
-
2026-06-03days on market $129,900 Active 31 DOM
-
2026-06-02pricestatus $129,900 Active 30 DOM
-
2026-05-18price $131,900 557-char remark
-
2026-04-24$138,900 Active 557-char remark
ⓘ Source: listings_history table (triggers on properties + properties_extension) + one-shot
backfill from property_details.listing_events for pre-trigger history.
Tax reassessment forecast IN · Partial reset (capped growth)
- Current annual tax
- $2,724 · $227/mo
- Projected year-2 tax
- $2,724 · $227/mo
- Expected delta
- $0/yr ($0/mo · 0.0%)
ⓘ Screening estimate from a state-policy table — verify with the county assessor before closing.
Climate risk First Street
- Flood 1/10 Low FEMA zone X (unshaded) · 0% chance over 30 yrs
- Wildfire 1/10 Low
- Heat 3/10 Moderate 7 d/yr ≥102°F today · 19 d/yr by 30 yrs out
- Wind 2/10 Low 100% chance of damaging wind over 30 yrs
- Air quality 4/10 Moderate 5 unhealthy d/yr today · 7 by 30 yrs out
Nearby sold comps map
Loading sold comps map…
Walkable amenities ~0.75 mi
Loading nearby amenities…
Taxation est. · year 1
- Rental income
- $14,023
- − Mortgage interest
- −$7,276
- − Property taxes
- −$2,724
- − Insurance
- −$650
- − Repairs & maintenance
- −$1,122
- − Management
- −$1,122
- − Depreciation
- −$3,779
- Taxable loss
- −$2,649
- Est. tax savings @ 24.0%
- +$636
- After-tax cash flow
- $166/yr
For passive investors: Depreciation is non-cash, so a rental often shows a tax loss while cash-flowing — sheltering income. Rental losses are passive: they offset passive income freely, and up to $25,000/yr can offset ordinary (W-2) income if you actively participate and your MAGI is under $100k (phasing out to $0 by $150k); unused losses carry forward. On sale, claimed depreciation is recaptured at up to 25%, and gains may owe capital-gains tax (a 1031 exchange can defer both). Figures are a year-1 estimate at your 24.0% rate — not tax advice; consult a CPA.
Schools (NCES district)
- District
- Indianapolis Public Schools
- NCES district ID
- 1804770
- Math proficiency
- 14% ▼ -7.00%
- Reading proficiency
- 20% ▼ -3.00%
- Median HH income
- $32,034
- Composite
- 13.69/100
- National rank
- #9499
- State rank
- #286 of 301 in IN
Livability — Indianapolis city (balance)
No livability data for this city. (Only ~50 U.S. cities are tracked.)
Census & demographics
- Census place
- Indianapolis city (balance), IN
- County
- Marion County · 998,460 people
- City population
- 881,119
- Metro
- Indianapolis-Carmel-Anderson, IN
- Population (ZIP)
- 38,855
- Household income
- $60,803
- Rent vs Own
- Severe rent burden
- 2191.0
Population outlook (Marion County) Hauer SSP2
- Today (2025)
- 1,025,572 people
- By 2030
- 1,065,727 · +3.9%
- By 2040
- 1,141,577 · +11.3%
- By 2050
- 1,208,920 · +17.9%
- By 2075
- 1,367,288 · +33.3%
- By 2100
- 1,438,201 · +40.2%
Race, ethnicity, and origin ACS 2023
- Neighborhood character
- Diverse neighborhood (Simpson 0.63)
- Race & ethnicity
- White 54% Black 22% Hispanic / Latino 18% Two or more races 9%
- Hispanic origin (detail)
- Mexican 10% Puerto Rican 1%
- Common ancestry
- Slovak 2% Romanian 2% Lithuanian 2%
- Foreign-born
- 10% · Canada
- Languages at home
- 85% English-only · Spanish 14%
Political lean MEDSL · Marion
- 2024 margin
- Strong D (+27.7) · D 63.0% · R 35.3% · Other 1.7%
- 2008→2024 swing
- -0.7pp no change · 2008: 28.4pp · 2024: 27.7pp
- All cycles
- 2024: D+27.7 2020: D+29.1 2016: D+22.8 2012: D+22.2 2008: D+28.4
Not yet ingested
- Civics
- —
Market trends
- HPI YoY
- ▼ -199.69%
- Current HPI
- 289.8788
- Rent YoY
- ▲ 2.63%
- Metro
- Indianapolis-Carmel-Anderson, IN
- State GDP YoY
- ▲ 2.90%
- F500 in state
- 18
Industry mix (Fortune 500 HQ in IN)
| Industry | F500 HQs | Revenue |
|---|---|---|
| Industrial Machinery | 2 | $37B |
|
||
| Healthcare | 1 | $177B |
|
||
| Pharmaceuticals | 1 | $45B |
|
||
| Metals / Steel | 1 | $18B |
|
||
| Agriculture | 1 | $17B |
|
||
| Packaging | 1 | $12B |
|
||
Price history
-10.0% since first listed7 events — show timeline
- 2026-06-17 Sold (MLS) $125,000 MIBOR as Distributed by MLS Grid
- 2026-06-06 Pending — MIBOR as Distributed by MLS Grid
- 2026-06-02 Relisted — MIBOR as Distributed by MLS Grid
- 2026-06-02 Price Changed $129,900 MIBOR as Distributed by MLS Grid
- 2026-05-24 Pending — MIBOR as Distributed by MLS Grid
- 2026-05-18 Price Changed $131,900 MIBOR as Distributed by MLS Grid
- 2026-04-24 Listed $138,900 MIBOR as Distributed by MLS Grid
Property tax history
+49.1%/yrLatest (2025): $2,724 · +27.7% YoY. Source: county tax records.
Cash-flow waterfall
monthlySold comps — $/sqft
last 12 mo · ≤1 miLoading sold comps…