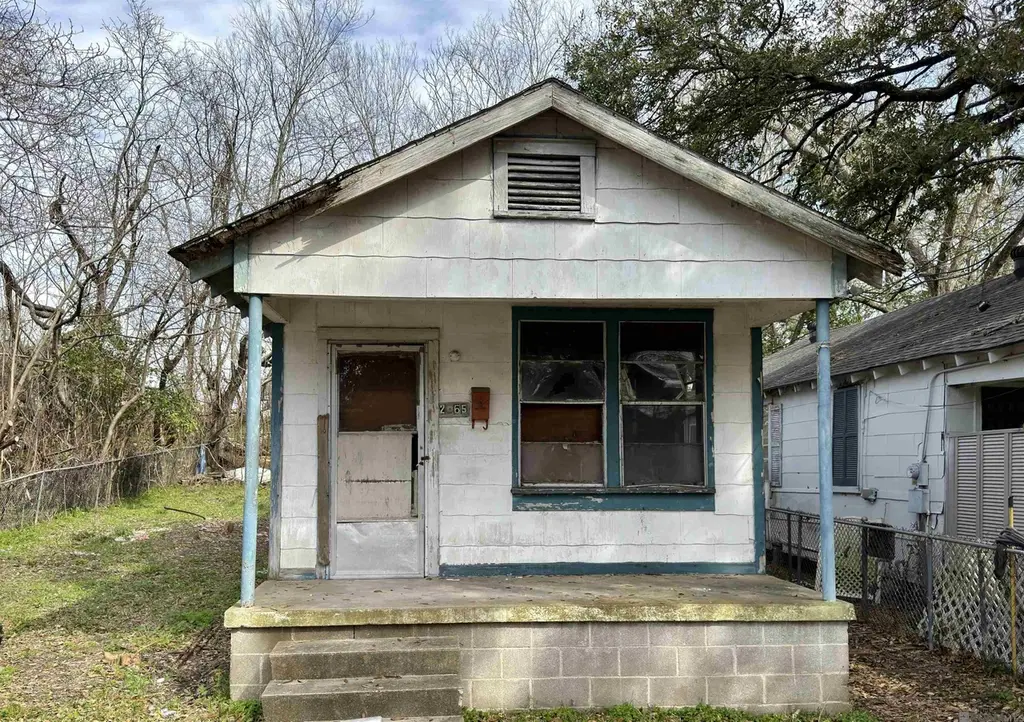
2065 Missouri St · Baton Rouge, LA
Flood risk 6/10 · Moderate
- FEMA flood zone
- X
- Chance of flooding over 30 yrs
- 0.74%
- Est. flood insurance / yr
- $507 – $1,088
Fire risk 1/10 · Minimal
- Est. fire insurance / yr
- $1,269 – $2,357
Heat risk 8/10 · Major
- Hot days now (above 108°F)
- 7 days/yr
- Hot days in 30 yrs
- 19 days/yr
Wind risk 9/10 · Severe
- Chance of severe wind over 30 yrs
- 99.0%
Air-quality risk 2/10 · Minimal
- Unhealthy air days now
- 1 days/yr
- Unhealthy air days in 30 yrs
- 1 days/yr
Risk factors via First Street. Map © Google.
Why this score? — see what drove the D+ grade
The composite is a weighted blend of 9 inputs, each scored 0–100. Each bar is that input's sub-score; the figure is the points it added to the 100-point composite (weight × sub-score).
- Cash flow +15.0/30.0
- ARV discount +7.5/15.0
- 1% rule +5.0/10.0
- DSCR +5.0/10.0
- Rent growth +4.1/5.0
- Livability +3.7/5.0
- Condition / age +2.5/5.0
- Schools +2.4/10.0
- Appreciation +0.0/10.0
$13,900
🖨 Deal sheet 📄 Offer letter ✓ Due diligence
Listing remarks MLS
Motivated Seller ! Great Opportunity for INVESTORS, minutes from the LSU area. Come put your touch on this home and watch your investment grow. Bring your offers. Property is Sold As-is.
Key facts
- 3,920 sq ft lot
- Built 1950
- Listed 58 days
Neighborhood map
What this means for you Summary
Snapshot
- This is a 1-bed/1.0-bath single-family listed at $14k.
Deal economics
- At list price, monthly cash flow is $739 ($9k/yr) — positive.
- The deal already cash-flows at list — no discount required.
- Meets the 1% rule at list price ($1k rent vs $14k).
- Recommended offer: $13k (3.0% below list) — sets the bar for market timing.
- Cap rate 70.1% vs local median 4.3% in Baton Rouge — top-decile yield for the area; either an underpriced asset or a hidden risk that comps aren't pricing in. Stress-test before assuming the spread holds.
Location & tenants
- Location reads 74/100 on livability (#24 in LA, #4,535 nationally) — a middle-class / working-renter tenant base. Strengths: commute A+, cost of living A+, health & safety A+; Watch: amenities D, crime F, employment D-.
- East Baton Rouge Parish (urban): math 22% / reading 34% proficiency, ranked #47 of 98 in LA (top 48%) — low school quality limits family demand, transient renter base, plan for 1-2y turnover; 77% free/reduced lunch — lower-income household profile, screen leases tightly.
- Market conditions: Rents rising fast (+6.6%/yr); 188 active listings in the ZIP; 34 comparable units currently listed for rent nearby; rentals at typical pace (median 24d on market — plan ~3-4 weeks tenant-placement turnaround); 44% of comp listings sitting > 30 days — soft ceiling on asking rent; lower-income renter base — watch delinquency; 2,252 units permitted in East Baton Rouge Parish in 2024 (440 in 5+ unit buildings).
- This rent runs 37% of the median local income ($34k/yr) — at the standard rent-burdened threshold; future hikes will face affordability resistance.
Forward outlook
- Local home prices are declining (-3.0%/yr); year-one equity from $96 of loan paydown is wiped out by about $417 of value loss. Plan a longer hold.
- East Baton Rouge County population projected at +4% by 2050 — modest demand growth; plan on rents tracking national, not racing it.
- At projected returns (-3.0% appreciation + 6.6% rent growth), your $4k cash investment doubles in ~1 year — after that, you're playing with house money.
Negotiation context
- It's been on market 58 days — a 3% lower offer ($13k) is reasonable based on typical stale-listing flexibility.
- 4 sale attempts; this cycle's ask has dropped $6k (30%) from the opening price — seller is motivated, your offer sets the floor, not the list.
Risks & watch-outs
- Watch-outs: built in 1950 — expect roof / HVAC / electrical / plumbing capex.
- Climate carrying-cost: major flood risk; severe wind risk, 99% chance of damaging wind over 30y; extreme-heat days projected 7→19/yr by 2055 (HVAC capex compounding) — expect insurance premiums to compound above CPI over the hold.
Questions for the listing agent
- It's been on market 58 days. Have you received any prior offers? Is the seller open to a 3% concession, seller financing, or rate buy-down credit?
- Built in 1950 — when were the roof, HVAC, electrical panel, plumbing, and water heater last replaced?
- Is there a deadline driving the sale (1031 exchange, divorce, estate, relocation)? That informs how much negotiation room exists.
- Crime grade is F in this area — have there been break-ins, vandalism, or insurance claims at this property in the last 3 years? What carrier currently insures it and at what premium?
- The area grade is low — what's the realistic commute time and amenity access for the typical tenant pool here? Any planned neighborhood developments (good or bad) we should know about?
- What's the average days-on-market for RENTAL listings here right now (not sales)? A rising rental-DOM trend means longer vacancies and softer asking-rent achievability than the comps imply.
- What's the recent tenant-quality profile in this submarket — average credit score on applications, eviction rate, late-payment / NSF rate, and stable-employment percentage? A property-management company in the area should have these aggregated.
- How much new for-sale + rental construction is in the pipeline within 1–3 miles? Heavy new supply typically softens prices + rents 12–24 months out; constrained supply supports both.
Investment metrics
- 1% rule
- 7.57% ✓
- Cap rate
- 70.09%
- Cash-on-cash
- 227.84%
- DSCR
- 11.14
- GRM
- 1.1
CMA / ARV
- ARV (median comp)
- $46,347
- List price
- $13,900
- Delta
- -70.01%
- Verdict
- UNDERPRICED
- Comps
- 20 within 1.0 mi
Show comp detail 8 sales within ~0.75 mi
| Address | Dist | Beds/Ba | Sqft | Sold | Price | $/sf | Match |
|---|---|---|---|---|---|---|---|
| 2056 Ovid St | 0.53mi | 2/1.0 (+1) | 1,047 (-4%) | 5mo | $250,000 | $239 | 59 |
| 1950 Georgia St | 0.22mi | 2/1.0 (+1) | 1,200 (+10%) | 16mo | $25,000 | $21 | 54 |
| 1265 Swart St | 0.55mi | 2/1.0 (+1) | 1,057 (-3%) | 14mo | $37,000 | $35 | 53 |
| 1112 Julia St | 0.68mi | 2/1.0 (+1) | 1,100 (+1%) | 13mo | $99,000 | $90 | 51 |
| 2412 Horace St | 0.61mi | 2/1.0 (+1) | 1,031 (-5%) | 9mo | $187,000 | $181 | 50 |
| 1855 Kansas St | 0.40mi | 2/1.0 (+1) | 936 (-14%) | 10mo | $25,000 | $27 | 45 |
| 1946 Pericles St | 0.58mi | 2/1.0 (+1) | 1,243 (+14%) | 1mo | $319,900 | $257 | 44 |
| 657 Lettsworth St | 0.50mi | 2/1.0 (+1) | 932 (-14%) | 17mo | $100,000 | $107 | 33 |
Match score weights: distance 35% · size 25% · config 20% · recency 20%. Top-matched comps best support the ARV.
Projected returns pro-forma
-3.0% appreciation · 6.59% rent growth · sell at horizon
- IRR
- —
- Equity multiple
- 13.53×
- Total profit
- $48,766
- Equity at exit
- $2,073
- IRR
- —
- Equity multiple
- 31.97×
- Total profit
- $120,532
- Equity at exit
- $1,202
Cash invested: $3,892 (down + closing). Projections, not guarantees.
Landlord ↔ Tenant lean methodology
- Overall (STATE)
- 90 Strongly Landlord-Friendly
- State Louisiana
- 90 Strongly Landlord-Friendly · R+12
- County
- — inherits STATE
- City
- — inherits STATE
ZIP-level market 70802
- Rents YoY
- 6.6%
- Active inventory
- 188
- Price-to-rent
- 1.1×
Monthly cashflow live
- Estimated rent
- $1,053 high interval (Pro) →
- Mortgage (P&I)
- −$73
- Tax from tax record
- −$14 /mo · $169/yr
- Insurance
- −$6
- HOA
- −$0
- Vacancy / Maint / Mgmt
- −$221
- Net cashflow
- $739
Break-even live
UW: 25.0% down · 7.5% · 30yr · 1.5% tax · 5.0% vac · 8.0% maint · 8.0% mgmt
Financing live
Cash to close
- Down payment
- $3,475
- Closing costs
- $417
- Reserves months
- —
- Total cash needed
- —
Loan-product check · same deal, 3 products live
Conventional
25% down · 7.5% · 30yr
- Down + closing
- —
- Monthly P&I
- —
- Monthly cashflow
- —
- DSCR
- —
- Eligible?
- —
Personal DTI + credit; lowest rate.
DSCR
20% down · 8.5% · 30yr
- Down + closing
- —
- Monthly P&I
- —
- Monthly cashflow
- —
- DSCR
- —
- Eligible?
- —
No personal income docs; deal must DSCR.
Hard money
10% down · 12.0% · 12mo
- Down + closing
- —
- Monthly P&I
- —
- Monthly cashflow
- —
- DSCR
- —
- Eligible?
- —
Short-term bridge; refi at stabilization.
Rent comps 34 comps
| Address | Beds | Baths | Sqft | Rent | $/sqft | DOM | Units | Dist |
|---|---|---|---|---|---|---|---|---|
| 1104 E Harrison St Unit A Baton Rouge, LA | 2.0 | 2.0 | 1100 | $975 | $0.89 | 43d | 1 | 0.12mi |
| 2030 Colorado St Baton Rouge, LA | 1.0 | 1.0 | 900 | $700 | $0.78 | 43d | 1 | 0.44mi |
| 3005 Highland Rd Unit 5A Baton Rouge, LA | 2.0 | 1.0 | 810 | $850 | $1.05 | 43d | 1 | 0.56mi |
| 1327 S 17th St Baton Rouge, LA | 2.0 | 1.0 | 955 | $950 | $0.99 | 23d | 1 | 0.57mi |
| 3101 Highland Rd Baton Rouge, LA | 2.0 | 1.0 | 955 | $1,038 | $1.09 | 14d | 2 | 0.58mi |
| 417 E State St Baton Rouge, LA | 3.0 | 1.0–2.0 | 849 | $1,053 | $1.24 | 14d | 26 | 0.60mi |
| 416 E State St Unit B Baton Rouge, LA | 1.0 | 1.0 | 700 | $1,200 | $1.71 | 43d | 1 | 0.62mi |
| 1241 S 18th St Baton Rouge, LA | 1.0 | 1.0 | 700 | $1,000 | $1.43 | 14d | 1 | 0.62mi |
| 408 E State St Unit B Baton Rouge, LA | 2.0 | 2.0 | 1258 | $1,100 | $0.87 | 43d | 1 | 0.63mi |
| 1805 Perkins Rd Unit 1805 Baton Rouge, LA | 1.0 | 1.0 | 1000 | $1,500 | $1.50 | 14d | 1 | 0.65mi |
| 1917 Minnesota St Unit A Baton Rouge, LA | 2.0 | 2.0 | 917 | $1,350 | $1.47 | 23d | 1 | 0.67mi |
| 1917 Minnesota St Unit A Baton Rouge, LA | 2.0 | 2.0 | 917 | $1,350 | $1.47 | 43d | 1 | 0.67mi |
| 157 E State St Baton Rouge, LA | — | 1.0 | 800 | $750 | $0.94 | 23d | 1 | 0.67mi |
| 279 Chatsworth St Baton Rouge, LA | 2.0 | 2.0 | 840 | $1,250 | $1.49 | 43d | 1 | 0.92mi |
| 281 Chatsworth St Baton Rouge, LA | 2.0 | 1.0 | 700 | $1,250 | $1.79 | 14d | 1 | 0.92mi |
| 718 Park Blvd Unit 1 Baton Rouge, LA | 2.0 | 1.0 | 1189 | $1,500 | $1.26 | 23d | 1 | 0.96mi |
| 710 Park Blvd #6 Baton Rouge, LA | 2.0 | 1.0 | 1111 | $1,800 | $1.62 | 14d | 1 | 0.97mi |
| 2500 McGrath Ave Unit 2 Baton Rouge, LA | 1.0 | 1.0 | 750 | $1,000 | $1.33 | 43d | 1 | 1.02mi |
| 101 Baton Rouge, LA | 1.0–2.0 | 1.0–2.0 | 803 | $1,254 | $1.56 | 14d | 28 | 1.04mi |
| 101 River House Pl Unit 1D Baton Rouge, LA | 1.0 | 1.0 | 703 | $1,391 | $1.98 | 23d | 1 | 1.09mi |
| 756 Europe St Baton Rouge, LA | 1.0 | 1.0 | 1050 | $1,175 | $1.12 | 14d | 1 | 1.14mi |
| 3132 Wyoming St Unit 1 Baton Rouge, LA | 1.0 | 1.0 | 700 | $650 | $0.93 | 43d | 1 | 1.15mi |
| 866 Arlington Ave Unit 206 Baton Rouge, LA | 2.0 | 1.0 | 950 | $895 | $0.94 | 43d | 1 | 1.15mi |
| 2361 Wisteria St Unit B Baton Rouge, LA | 1.0 | 1.0 | 700 | $1,200 | $1.71 | 43d | 1 | 1.19mi |
| 1136 Aster St Baton Rouge, LA | 2.0 | 1.0 | 700 | $695 | $0.99 | 43d | 1 | 1.19mi |
| 878 Kenmore Ave Unit C Baton Rouge, LA | 2.0 | 1.0 | 1100 | $1,000 | $0.91 | 21d | 1 | 1.20mi |
| 1212 Aster St Unit 1132 Baton Rouge, LA | 2.0 | 1.0 | 700 | $695 | $0.99 | 43d | 1 | 1.20mi |
| 1212 Aster St Unit 1136 Baton Rouge, LA | 2.0 | 1.0 | 700 | $695 | $0.99 | 23d | 1 | 1.20mi |
| 636 Napoleon St Baton Rouge, LA | 2.0 | 1.0 | 1065 | $1,650 | $1.55 | 14d | 1 | 1.21mi |
| 623 S Eugene St Unit 1 Baton Rouge, LA | 2.0 | 1.0 | 980 | $1,400 | $1.43 | 43d | 1 | 1.27mi |
| 648 Penalver St Unit 2 Baton Rouge, LA | 2.0 | 1.0 | 1000 | $1,200 | $1.20 | 14d | 1 | 1.28mi |
| 3003 River Rd Baton Rouge, LA | 1.0–2.0 | 1.0 | 670 | $799 | $1.19 | 14d | 18 | 1.40mi |
| 814 North Blvd Unit 814 Baton Rouge, LA | 1.0 | 1.0 | 800 | $800 | $1.00 | 43d | 1 | 1.44mi |
| 725 Carol Marie Dr Unit 4 Baton Rouge, LA | 1.0 | 1.0 | 870 | $900 | $1.03 | 14d | 1 | 1.44mi |
Listing history 26 events
-
2026-06-18days on market $13,900 Active 58 DOM
-
2026-06-17days on market $13,900 Active 57 DOM
-
2026-06-16days on market $13,900 Active 56 DOM
-
2026-06-15days on market $13,900 Active 55 DOM
-
2026-06-14days on market $13,900 Active 53 DOM
-
2026-06-10days on market $13,900 Active 50 DOM
-
2026-06-09days on market $13,900 Active 49 DOM
-
2026-06-08days on market $13,900 Active 48 DOM
-
2026-06-07days on market $13,900 Active 47 DOM
-
2026-06-05days on market $13,900 Active 44 DOM
-
2026-06-03days on market $13,900 Active 43 DOM
-
2026-06-02days on market $13,900 Active 42 DOM
-
2026-06-01days on market $13,900 Active 41 DOM
-
2026-05-31days on market $13,900 Active 40 DOM
-
2026-05-31days on market $13,900 Active 39 DOM
-
2026-05-06price $16,900 186-char remark
Show marketing remark (186 chars)
Motivated Seller ! Great Opportunity for INVESTORS, minutes from the LSU area. Come put your touch on this home and watch your investment grow. Bring your offers. Property is Sold As-is.
-
2026-05-06price $16,900 186-char remark
Show marketing remark (186 chars)
Motivated Seller ! Great Opportunity for INVESTORS, minutes from the LSU area. Come put your touch on this home and watch your investment grow. Bring your offers. Property is Sold As-is.
-
2026-04-21$19,900 Active 186-char remark
Show marketing remark (186 chars)
Motivated Seller ! Great Opportunity for INVESTORS, minutes from the LSU area. Come put your touch on this home and watch your investment grow. Bring your offers. Property is Sold As-is.
-
2026-04-21$19,900 Active 186-char remark
Show marketing remark (186 chars)
Motivated Seller ! Great Opportunity for INVESTORS, minutes from the LSU area. Come put your touch on this home and watch your investment grow. Bring your offers. Property is Sold As-is.
-
2025-03-19price $18,000
-
2025-03-19price $18,000
-
2025-03-10price $18,500
-
2025-03-01price $18,500
-
2025-02-18$25,000 Active
-
2025-02-18$25,000 Active
-
1981-09-15soldstatus
ⓘ Source: listings_history table (triggers on properties + properties_extension) + one-shot
backfill from property_details.listing_events for pre-trigger history.
Tax reassessment forecast LA · Resets to sale price
- Current annual tax
- $169 · $14/mo
- Projected year-2 tax
- $169 · $14/mo
- Expected delta
- $0/yr ($0/mo · 0.0%)
ⓘ Screening estimate from a state-policy table — verify with the county assessor before closing.
Climate risk First Street
- Flood 6/10 Major FEMA zone X · 74% chance over 30 yrs
- Wildfire 1/10 Low
- Heat 8/10 Severe 7 d/yr ≥108°F today · 19 d/yr by 30 yrs out
- Wind 9/10 Extreme 99% chance of damaging wind over 30 yrs
- Air quality 2/10 Low 1 unhealthy d/yr today · 1 by 30 yrs out
Nearby sold comps map
Loading sold comps map…
Walkable amenities ~0.75 mi
Loading nearby amenities…
Taxation est. · year 1
- Rental income
- $12,634
- − Mortgage interest
- −$779
- − Property taxes
- −$169
- − Insurance
- −$70
- − Repairs & maintenance
- −$1,011
- − Management
- −$1,011
- − Depreciation
- −$404
- Taxable income
- $9,191
- Est. tax owed @ 24.0%
- −$2,206
- After-tax cash flow
- $6,662/yr
For passive investors: Depreciation is non-cash, so a rental often shows a tax loss while cash-flowing — sheltering income. Rental losses are passive: they offset passive income freely, and up to $25,000/yr can offset ordinary (W-2) income if you actively participate and your MAGI is under $100k (phasing out to $0 by $150k); unused losses carry forward. On sale, claimed depreciation is recaptured at up to 25%, and gains may owe capital-gains tax (a 1031 exchange can defer both). Figures are a year-1 estimate at your 24.0% rate — not tax advice; consult a CPA.
Schools (NCES district)
- District
- East Baton Rouge Parish
- NCES district ID
- 2200540
- Math proficiency
- 22% ▼ -36.00%
- Reading proficiency
- 34% ▼ -31.00%
- Median HH income
- $46,263
- Composite
- 24.14/100
- National rank
- #7745
- State rank
- #47 of 98 in LA
Livability — Baton Rouge
- Score
- 74/100
- State rank
- #24
- US rank
- #4535
Category grades
Schools grade is shown separately in the Schools card above.
Census & demographics
- Census place
- Baton Rouge, LA
- County
- East Baton Rouge Parish · 399,686 people
- City population
- 351,868
- Metro
- Baton Rouge, LA
- Population (ZIP)
- 25,118
- Household income
- $34,458
- Rent vs Own
- Severe rent burden
- 1831.0
Population outlook (East Baton Rouge County) Hauer SSP2
- Today (2025)
- 464,810 people
- By 2030
- 472,137 · +1.6%
- By 2040
- 480,243 · +3.3%
- By 2050
- 484,422 · +4.2%
- By 2075
- 492,069 · +5.9%
- By 2100
- 476,347 · +2.5%
Race, ethnicity, and origin ACS 2023
- Neighborhood character
- Predominantly Black (69%)
- Race & ethnicity
- Black 69% White 20% Two or more races 5% Hispanic / Latino 5% Asian 3%
- Common ancestry
- Lithuanian 2% Italian 1% Iranian 0%
- Foreign-born
- 6% · Canada, Vietnam
- Languages at home
- 91% English-only · Spanish 3% Tagalog/Filipino 1% Other Indo-European 1%
Political lean MEDSL · East Baton Rouge
- 2024 margin
- D (+11.1) · D 54.5% · R 43.4% · Other 2.1%
- 2008→2024 swing
- +8.9pp toward D · 2008: 2.2pp · 2024: 11.1pp
- All cycles
- 2024: D+11.1 2020: D+13.1 2016: D+9.2 2012: D+5.2 2008: D+2.2
Not yet ingested
- Civics
- —
Market trends
- HPI YoY
- ▼ -137.02%
- Current HPI
- 47.7285
- Rent YoY
- ▲ 6.59%
- Metro
- Baton Rouge, LA
- State GDP YoY
- ▲ 3.29%
- F500 in state
- 10
Industry mix (Fortune 500 HQ in LA)
| Industry | F500 HQs | Revenue |
|---|---|---|
| Telecommunications | 2 | $23B |
|
||
| Utilities | 1 | $12B |
|
||
| Wholesale / Distribution | 1 | $5B |
|
||
| Advertising | 1 | $2B |
|
||
Price history
-32.4% since first listed11 events — show timeline
- 2026-05-06 Price Changed $16,900 AcadianaMLS
- 2026-05-06 Price Changed $16,900 GBRMLS
- 2026-04-21 Listed $19,900 GBRMLS
- 2026-04-21 Listed $19,900 AcadianaMLS
- 2025-03-19 Price Changed $18,000 AcadianaMLS
- 2025-03-19 Price Changed $18,000 GBRMLS
- 2025-03-10 Price Changed $18,500 AcadianaMLS
- 2025-03-01 Price Changed $18,500 GBRMLS
- 2025-02-18 Listed $25,000 GBRMLS
- 2025-02-18 Listed $25,000 AcadianaMLS
- 1981-09-15 Sold (Public Records) — Public Records
Property tax history
+1.3%/yrLatest (2025): $169 · +4.7% YoY. Source: county tax records.
Cash-flow waterfall
monthlySold comps — $/sqft
last 12 mo · ≤1 miLoading sold comps…