208 Beaver Rd · Kirbyville, MO
Flood risk 1/10 · Minimal
- FEMA flood zone
- X (unshaded)
- Chance of flooding over 30 yrs
- 0.0%
- Est. flood insurance / yr
- $473 – $860
Fire risk 2/10 · Minimal
- Est. fire insurance / yr
- $1,054 – $1,958
Heat risk 4/10 · Minor
- Hot days now (above 106°F)
- 7 days/yr
- Hot days in 30 yrs
- 20 days/yr
Wind risk 2/10 · Minimal
- Chance of severe wind over 30 yrs
- 1.0%
Air-quality risk 2/10 · Minimal
- Unhealthy air days now
- 0 days/yr
- Unhealthy air days in 30 yrs
- 1 days/yr
Risk factors via First Street. Map © Google.
Why this score? — see what drove the B- grade
The composite is a weighted blend of 9 inputs, each scored 0–100. Each bar is that input's sub-score; the figure is the points it added to the 100-point composite (weight × sub-score).
- Cash flow +30.0/30.0
- 1% rule +10.0/10.0
- DSCR +10.0/10.0
- ARV discount +7.5/15.0
- Schools +4.2/10.0
- Rent growth +3.2/5.0
- Livability +3.0/5.0
- Condition / age +1.0/5.0
- Appreciation +0.0/10.0
$55,000
🖨 Deal sheet 📄 Offer letter ✓ Due diligence
Listing remarks MLS
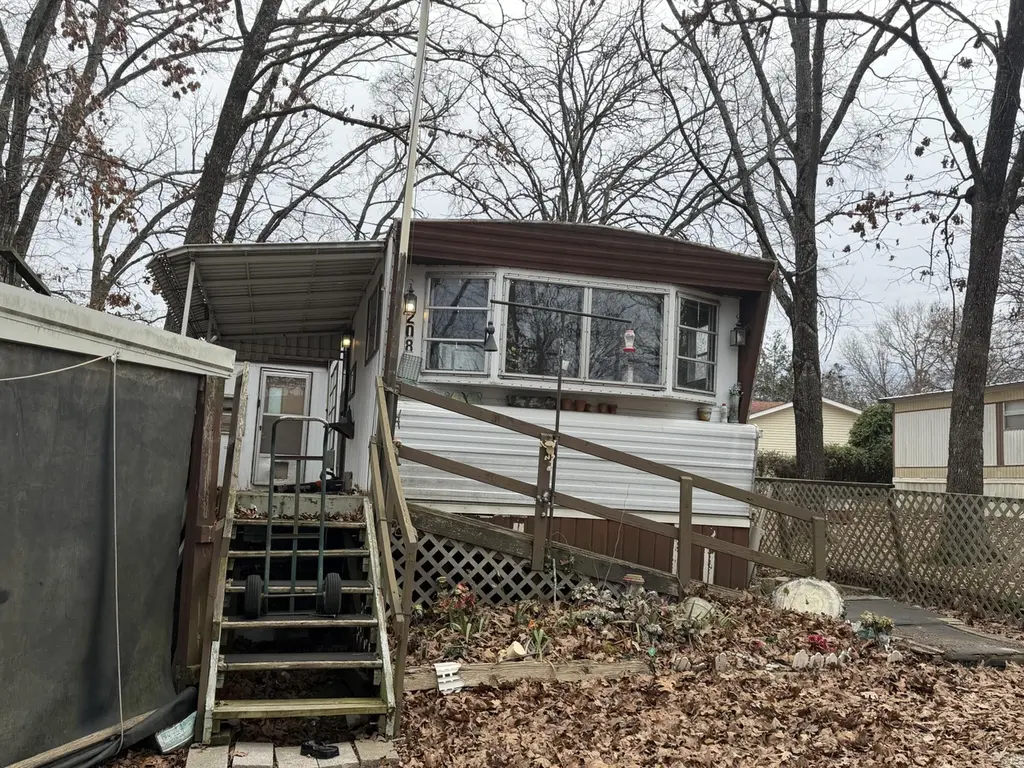
Affordable opportunity in the Lake Taneycomo Woods subdivision! This property features an older single-wide mobile home situated on two lots in a quiet, natural setting. The home is being sold as-is and offers potential for renovation or replacement.
Key facts
- Two lots
- 5,227 sq ft lot
- Garage
Tags
Neighborhood map
What this means for you Summary
Snapshot
- This is a 2-bed/1.5-bath manufactured listed at $55k. Condition is rated poor.
Deal economics
- At list price, monthly cash flow is $559 ($7k/yr) — positive.
- The deal already cash-flows at list — no discount required.
- Meets the 1% rule at list price ($1k rent vs $55k).
- Recommended offer: $48k (12.0% below list) — sets the bar for market timing.
- Cap rate 18.5% vs local median 3.4% in Kirbyville — top-decile yield for the area; either an underpriced asset or a hidden risk that comps aren't pricing in. Stress-test before assuming the spread holds.
Location & tenants
- Location reads 60/100 on livability (#494 in MO) — a middle-class / working-renter tenant base. Strengths: cost of living A+, housing B+; Watch: health & safety C-, schools D+, employment D.
- Branson R-IV (rural): math 48% / reading 52% proficiency, ranked #44 of 324 in MO (top 14%) — acceptable for families but not a draw, mixed tenant base, ~2y average lease.
- Market conditions: Rents rising (+2.9%/yr); 1048 active listings in the ZIP; 331 units permitted in Taney County in 2024 (50 in 5+ unit buildings).
Forward outlook
- Local home prices are declining (-3.0%/yr); year-one equity from $380 of loan paydown is wiped out by about $2k of value loss. Plan a longer hold.
- Taney County population projected at +17% by 2050 — long-run rental-demand tailwind backs the buy-and-hold thesis.
- At projected returns (-3.0% appreciation + 2.9% rent growth), your $15k cash investment doubles in ~3 years — after that, you're playing with house money.
Negotiation context
- It's been on market 146 days — a 12% lower offer ($48k) is reasonable based on typical stale-listing flexibility.
Questions for the listing agent
- It's been on market 146 days. Have you received any prior offers? Is the seller open to a 12% concession, seller financing, or rate buy-down credit?
- Have any recent inspections been done? Can we get a copy of the seller's disclosures and any deferred-maintenance estimates?
- Built in 1979 — when were the roof, HVAC, electrical panel, plumbing, and water heater last replaced?
- What does the HOA fee cover, when was the last increase, and are there any pending special assessments or reserve-fund shortfalls?
- Why hasn't it sold? Are there any deal-killer items the seller is aware of (foundation, flood, title, zoning, code violations)?
- Is there a deadline driving the sale (1031 exchange, divorce, estate, relocation)? That informs how much negotiation room exists.
- Schools are D-rated, which usually means shorter tenancies and higher turnover. Who's the typical renter profile here, and what's been the actual vacancy rate?
- Crime grade is F in this area — have there been break-ins, vandalism, or insurance claims at this property in the last 3 years? What carrier currently insures it and at what premium?
- What's the average days-on-market for RENTAL listings here right now (not sales)? A rising rental-DOM trend means longer vacancies and softer asking-rent achievability than the comps imply.
- What's the recent tenant-quality profile in this submarket — average credit score on applications, eviction rate, late-payment / NSF rate, and stable-employment percentage? A property-management company in the area should have these aggregated.
- How much new for-sale + rental construction is in the pipeline within 1–3 miles? Heavy new supply typically softens prices + rents 12–24 months out; constrained supply supports both.
Investment metrics
- 1% rule
- 2.18% ✓
- Cap rate
- 18.49%
- Cash-on-cash
- 43.57%
- DSCR
- 2.94
- GRM
- 3.8
CMA / ARV
- ARV (median comp)
- $36,000
- List price
- $55,000
- Delta
- 52.78%
- Verdict
- OVERPRICED
- Comps
- 1 within 2.0 mi
Projected returns pro-forma
-3.0% appreciation · 2.9% rent growth · sell at horizon
- IRR
- 40.4%
- Equity multiple
- 2.73×
- Total profit
- $26,605
- Equity at exit
- $8,201
- IRR
- 46.6%
- Equity multiple
- 5.46×
- Total profit
- $68,630
- Equity at exit
- $4,755
Cash invested: $15,400 (down + closing). Projections, not guarantees.
Landlord ↔ Tenant lean methodology
- Overall (STATE)
- 81 Strongly Landlord-Friendly
- State Missouri
- 81 Strongly Landlord-Friendly · R+10
- County
- — inherits STATE
- City
- — inherits STATE
ZIP-level market 65616
- Home prices YoY
- -24.3%
- Rents YoY
- 2.9%
- Active inventory
- 1048
- Price-to-rent
- 3.8×
Monthly cashflow live
- Estimated rent
- $1,202 medium interval (Pro) →
- Mortgage (P&I)
- −$288
- Tax est. 1.5%
- −$69 /mo · $825/yr
- Insurance
- −$23
- HOA
- −$10
- Vacancy / Maint / Mgmt
- −$252
- Net cashflow
- $559
Break-even live
UW: 25.0% down · 7.5% · 30yr · 1.5% tax · 5.0% vac · 8.0% maint · 8.0% mgmt
Financing live
Cash to close
- Down payment
- $13,750
- Closing costs
- $1,650
- Reserves months
- —
- Total cash needed
- —
Loan-product check · same deal, 3 products live
Conventional
25% down · 7.5% · 30yr
- Down + closing
- —
- Monthly P&I
- —
- Monthly cashflow
- —
- DSCR
- —
- Eligible?
- —
Personal DTI + credit; lowest rate.
DSCR
20% down · 8.5% · 30yr
- Down + closing
- —
- Monthly P&I
- —
- Monthly cashflow
- —
- DSCR
- —
- Eligible?
- —
No personal income docs; deal must DSCR.
Hard money
10% down · 12.0% · 12mo
- Down + closing
- —
- Monthly P&I
- —
- Monthly cashflow
- —
- DSCR
- —
- Eligible?
- —
Short-term bridge; refi at stabilization.
HOA detail
- Monthly dues
- $10 · $120/yr
Listing history 17 events
-
2026-06-19days on market $55,000 Active 146 DOM
-
2026-06-18days on market $55,000 Active 145 DOM
-
2026-06-17days on market $55,000 Active 144 DOM
-
2026-06-16days on market $55,000 Active 143 DOM
-
2026-06-15days on market $55,000 Active 142 DOM
-
2026-06-14days on market $55,000 Active 140 DOM
-
2026-06-12days on market $55,000 Active 139 DOM
-
2026-06-09days on market $55,000 Active 136 DOM
-
2026-06-08days on market $55,000 Active 135 DOM
-
2026-06-07days on market $55,000 Active 134 DOM
-
2026-06-03days on market $55,000 Active 130 DOM
-
2026-06-02days on market $55,000 Active 129 DOM
-
2026-06-01days on market $55,000 Active 128 DOM
-
2026-05-31days on market $55,000 Active 127 DOM
-
2026-05-30days on market $55,000 Active 126 DOM
-
2026-04-06price $55,000 251-char remark
Show marketing remark (251 chars)
Affordable opportunity in the Lake Taneycomo Woods subdivision! This property features an older single-wide mobile home situated on two lots in a quiet, natural setting. The home is being sold as-is and offers potential for renovation or replacement.
-
2026-01-24$60,000 Active 251-char remark
Show marketing remark (251 chars)
Affordable opportunity in the Lake Taneycomo Woods subdivision! This property features an older single-wide mobile home situated on two lots in a quiet, natural setting. The home is being sold as-is and offers potential for renovation or replacement.
ⓘ Source: listings_history table (triggers on properties + properties_extension) + one-shot
backfill from property_details.listing_events for pre-trigger history.
Climate risk First Street
- Flood 1/10 Low FEMA zone X (unshaded) · 0% chance over 30 yrs
- Wildfire 2/10 Low
- Heat 4/10 Moderate 7 d/yr ≥106°F today · 20 d/yr by 30 yrs out
- Wind 2/10 Low 100% chance of damaging wind over 30 yrs
- Air quality 2/10 Low 0 unhealthy d/yr today · 1 by 30 yrs out
Nearby sold comps map
Loading sold comps map…
Walkable amenities ~0.75 mi
Loading nearby amenities…
Taxation est. · year 1
- Rental income
- $14,419
- − Mortgage interest
- −$3,081
- − Property taxes
- −$825
- − Insurance
- −$275
- − Repairs & maintenance
- −$1,154
- − Management
- −$1,154
- − HOA
- −$120
- − Depreciation
- −$1,600
- Taxable income
- $6,211
- Est. tax owed @ 24.0%
- −$1,491
- After-tax cash flow
- $5,219/yr
For passive investors: Depreciation is non-cash, so a rental often shows a tax loss while cash-flowing — sheltering income. Rental losses are passive: they offset passive income freely, and up to $25,000/yr can offset ordinary (W-2) income if you actively participate and your MAGI is under $100k (phasing out to $0 by $150k); unused losses carry forward. On sale, claimed depreciation is recaptured at up to 25%, and gains may owe capital-gains tax (a 1031 exchange can defer both). Figures are a year-1 estimate at your 24.0% rate — not tax advice; consult a CPA.
Condition & rehab AI · 6 photos
This mobile home is in poor condition and requires extensive repairs and updates to increase its resale and rental value.
Repairs flagged
- Major siding — Significant damage and wear
- Major roof — Significant damage and wear
- Major exterior — Significant damage and wear
Value-add opportunities
- Both landscaping and curb appeal — Improving the landscaping and curb appeal can attract more buyers and renters
- Both exterior repairs — Repairing the exterior will improve the home's appearance and increase its value
- Both interior updates — Updating the interior will make the home more attractive and increase its value
Renovation cost estimate screening
| Repair item | Severity | Est. cost |
|---|---|---|
| siding · Significant damage and wear | Major | $15,000–50,000 |
| roof · Significant damage and wear | Major | $15,000–50,000 |
| exterior · Significant damage and wear | Major | $15,000–50,000 |
| Total estimated repair cost · 3 items | $45,000–150,000 |
Value-add ROI direction
- Both landscaping and curb appeal — Improving the landscaping and curb appeal can attract more buyers and renters ↑
- Both exterior repairs — Repairing the exterior will improve the home's appearance and increase its value ↑
- Both interior updates — Updating the interior will make the home more attractive and increase its value ↑
ⓘ Cost ranges are severity-bucket heuristics (US national rule-of-thumb). Get contractor quotes + a written scope before underwriting a rehab budget.
Schools (NCES district)
- District
- Branson R-IV
- NCES district ID
- 2905760
- Math proficiency
- 48% ▼ -6.00%
- Reading proficiency
- 52% ▼ -3.00%
- Median HH income
- $41,473
- Composite
- 41.96/100
- National rank
- #3347
- State rank
- #44 of 324 in MO
Livability — Kirbyville
- Score
- 60/100
- State rank
- #494
- US rank
- #19167
Category grades
Schools grade is shown separately in the Schools card above.
Census & demographics
- County
- Taney County · 28,460 people
- Metro
- Branson, MO
- Population (ZIP)
- 28,460
- Household income
- $60,489
- Rent vs Own
- Severe rent burden
- 1065.0
Population outlook (Taney County) Hauer SSP2
- Today (2025)
- 59,017 people
- By 2030
- 61,235 · +3.8%
- By 2040
- 65,225 · +10.5%
- By 2050
- 68,842 · +16.6%
- By 2075
- 77,705 · +31.7%
- By 2100
- 82,002 · +38.9%
Race, ethnicity, and origin ACS 2023
- Neighborhood character
- Predominantly White (82%)
- Race & ethnicity
- White 82% Two or more races 10% Hispanic / Latino 10% Black 2% Asian 2%
- Hispanic origin (detail)
- Mexican 6% Puerto Rican 2%
- Common ancestry
- Italian 4% Lithuanian 3% Slovak 2%
- Foreign-born
- 5% · Canada
- Languages at home
- 89% English-only · Spanish 7% Other Indo-European 1% Russian/Polish/Slavic 1%
Political lean MEDSL · Taney
- 2024 margin
- Solid R (+59.3) · D 19.9% · R 79.2%
- 2008→2024 swing
- -22.2pp toward R · 2008: -37.2pp · 2024: -59.3pp
- All cycles
- 2024: R+59.3 2020: R+57.7 2016: R+59.3 2012: R+47.4 2008: R+37.2
Not yet ingested
- Civics
- —
Market trends
- HPI YoY
- ▼ -64.45%
- Current HPI
- 200.8392
- Rent YoY
- ▲ 2.90%
- Metro
- Branson, MO
- State GDP YoY
- ▲ 1.84%
- F500 in state
- 20
Industry mix (Fortune 500 HQ in MO)
| Industry | F500 HQs | Revenue |
|---|---|---|
| Healthcare | 1 | $163B |
|
||
| Insurance | 1 | $21B |
|
||
| Industrial Technology | 1 | $17B |
|
||
| Retail | 1 | $16B |
|
||
| Industrial Distribution | 1 | $10B |
|
||
| Utilities | 1 | $9B |
|
||
Price history
-8.3% since first listed2 events — show timeline
- 2026-04-06 Price Changed $55,000 SOMO
- 2026-01-24 Listed $60,000 SOMO
Cash-flow waterfall
monthlySold comps — $/sqft
last 12 mo · ≤1 miLoading sold comps…