5375 SE 188th Ct · Silver Springs Shores East, FL
Flood risk 1/10 · Minimal
- FEMA flood zone
- X (unshaded)
- Chance of flooding over 30 yrs
- 0.0%
- Est. flood insurance / yr
- $507 – $1,088
Fire risk 7/10 · Major
- Est. fire insurance / yr
- $947 – $1,759
Heat risk 8/10 · Major
- Hot days now (above 108°F)
- 7 days/yr
- Hot days in 30 yrs
- 22 days/yr
Wind risk 9/10 · Severe
- Chance of severe wind over 30 yrs
- 99.0%
Air-quality risk 3/10 · Minor
- Unhealthy air days now
- 2 days/yr
- Unhealthy air days in 30 yrs
- 2 days/yr
Risk factors via First Street. Map © Google.
Why this score? — see what drove the B- grade
The composite is a weighted blend of 9 inputs, each scored 0–100. Each bar is that input's sub-score; the figure is the points it added to the 100-point composite (weight × sub-score).
- Cash flow +26.5/30.0
- ARV discount +14.6/15.0
- DSCR +9.0/10.0
- 1% rule +6.5/10.0
- Schools +3.6/10.0
- Rent growth +2.5/5.0
- Livability +2.5/5.0
- Condition / age +2.5/5.0
- Appreciation +0.0/10.0
$149,000
🖨 Deal sheet (PDF) 📄 Offer letter ✓ Due diligence
Listing remarks
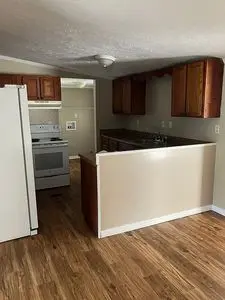
This is a 3 bedroom, 2 bath doublewide mobile located on a nice lot, in a paved road subdivision. Property is located about 17 miles east of Ocala Florida. And about 5 miles from grocery store, dollar store, auto parts, hardware store, etc. This home also has a step down addition which then leads to a screened room. Home has had some updating inside as seen in the pics. Has central heat and air with a heat pump. Only 3 years old. Side by side fridge with ice and water in the door. Has a shed on the property also. Has a privacy fenced back yard. Water is a public water supply but has a private septic. Possible owner financing with 20 percent down.
Key facts
- Doublewide mobile
- Screened room
- Side by side fridge
Tags
Neighborhood map
What this means for you Summary
Snapshot
- This is a 3-bed/2.0-bath manufactured listed at $149k.
Deal economics
- At list price, monthly cash flow is $394 ($5k/yr) — positive.
- The deal already cash-flows at list — no discount required.
- Meets the 1% rule at list price ($2k rent vs $149k).
- Recommended offer: $147k (1.5% below list) — sets the bar for market timing.
- Cap rate 9.5% vs local median 5.2% in Silver Springs Shores East — top-decile yield for the area; either an underpriced asset or a hidden risk that comps aren't pricing in. Stress-test before assuming the spread holds.
Location & tenants
- Location reads: area grade B — affects rentability + tenant quality, not the cash-flow math above.
- Marion (rural): math 42% / reading 43% proficiency, ranked #61 of 73 in FL (top 84%) — families likely to look elsewhere, expect single-tenant / working-renter base with shorter leases; 61% free/reduced lunch — lower-income household profile, screen leases tightly.
- Market conditions: 431 active listings in the ZIP; 7,071 units permitted in Marion County in 2024 (534 in 5+ unit buildings).
- This rent runs 44% of the median local income ($47k/yr) — at the standard rent-burdened threshold; future hikes will face affordability resistance.
Forward outlook
- Local home prices are declining (-3.0%/yr); year-one equity from $1k of loan paydown is wiped out by about $4k of value loss. Plan a longer hold.
- Marion County population projected at +13% by 2050 — modest demand growth; plan on rents tracking national, not racing it.
- At projected returns (-3.0% appreciation + 3.0% rent growth), your $42k cash investment doubles in ~10 years — after that, you're playing with house money.
Negotiation context
- It's been on market 27 days — a 2% lower offer ($147k) is reasonable based on typical stale-listing flexibility.
Risks & watch-outs
- Climate carrying-cost: severe wind risk, 99% chance of damaging wind over 30y; major wildfire risk; extreme-heat days projected 7→22/yr by 2055 (HVAC capex compounding) — expect insurance premiums to compound above CPI over the hold.
Questions for the listing agent
- Is there a deadline driving the sale (1031 exchange, divorce, estate, relocation)? That informs how much negotiation room exists.
- What's the average days-on-market for RENTAL listings here right now (not sales)? A rising rental-DOM trend means longer vacancies and softer asking-rent achievability than the comps imply.
- What's the recent tenant-quality profile in this submarket — average credit score on applications, eviction rate, late-payment / NSF rate, and stable-employment percentage? A property-management company in the area should have these aggregated.
- How much new for-sale + rental construction is in the pipeline within 1–3 miles? Heavy new supply typically softens prices + rents 12–24 months out; constrained supply supports both.
Investment metrics
- 1% rule
- 1.15% ✓
- Cap rate
- 9.46%
- Cash-on-cash
- 11.33%
- DSCR
- 1.50
- GRM
- 7.2
CMA / ARV
- ARV (on-the-fly)
- $177,100
- Comps found
- 2
Show comp detail 2 sales within ~0.75 mi
| Address | Dist | Beds/Ba | Sqft | Sold | Price | $/sf | Match |
|---|---|---|---|---|---|---|---|
| 5215 SE 184 TH Ter | 0.43mi | 3/2.0 | 980 (-3%) | 3mo | $70,000 | $71 | 72 |
| 5686 SE 184th Ter | 0.51mi | 2/2.0 (-1) | 944 (-7%) | 14mo | $165,000 | $175 | 48 |
Match score weights: distance 35% · size 25% · config 20% · recency 20%. Top-matched comps best support the ARV.
Projected returns pro-forma
-3.0% appreciation · 3.0% rent growth · sell at horizon
- IRR
- 0.6%
- Equity multiple
- 1.02×
- Total profit
- $921
- Equity at exit
- $22,216
- IRR
- 10.2%
- Equity multiple
- 1.79×
- Total profit
- $33,031
- Equity at exit
- $12,883
Cash invested: $41,720 (down + closing). Projections, not guarantees.
Landlord ↔ Tenant lean methodology
- Overall (STATE)
- 87 Strongly Landlord-Friendly
- State Florida
- 87 Strongly Landlord-Friendly · R+3
- County
- — inherits STATE
- City
- — inherits STATE
ZIP-level market 32179
- Home prices YoY
- -18.3%
- Active inventory
- 431
- Price-to-rent
- 7.2×
Monthly cashflow live
- Estimated rent
- $1,713 medium interval (Pro) →
- Mortgage (P&I)
- −$781
- Tax from tax record
- −$116 /mo · $1,396/yr
- Insurance
- −$62
- HOA
- −$0
- Vacancy / Maint / Mgmt
- −$360
- Net cashflow
- $394
Break-even live
Sensitivity live
| Price | -10% $478 | -5% $436 | +0% $394 | +5% $352 | +10% $309 |
|---|---|---|---|---|---|
| Rent | -10% $258 | -5% $326 | +0% $394 | +5% $462 | +10% $529 |
| Rate | -1.0pp $469 | -0.5pp $432 | base $394 | +0.5pp $355 | +1.0pp $316 |
UW: 25.0% down · 7.5% · 30yr · 1.5% tax · 5.0% vac · 8.0% maint · 8.0% mgmt
Financing live
Cash to close
- Down payment
- $37,250
- Closing costs
- $4,470
- Reserves months
- —
- Total cash needed
- —
Loan-product check · same deal, 3 products live
Conventional
25% down · 7.5% · 30yr
- Down + closing
- —
- Monthly P&I
- —
- Monthly cashflow
- —
- DSCR
- —
- Eligible?
- —
Personal DTI + credit; lowest rate.
DSCR
20% down · 8.5% · 30yr
- Down + closing
- —
- Monthly P&I
- —
- Monthly cashflow
- —
- DSCR
- —
- Eligible?
- —
No personal income docs; deal must DSCR.
Hard money
10% down · 12.0% · 12mo
- Down + closing
- —
- Monthly P&I
- —
- Monthly cashflow
- —
- DSCR
- —
- Eligible?
- —
Short-term bridge; refi at stabilization.
Listing history 12 events
-
2026-06-15days on market $149,000 Active 27 DOM
-
2026-06-14days on market $149,000 Active 25 DOM
-
2026-06-13days on market $149,000 Active 24 DOM
-
2026-06-10days on market $149,000 Active 22 DOM
-
2026-06-09days on market $149,000 Active 21 DOM
-
2026-06-08days on market $149,000 Active 20 DOM
-
2026-06-07days on market $149,000 Active 19 DOM
-
2026-06-03days on market $149,000 Active 15 DOM
-
2026-06-02days on market $149,000 Active 14 DOM
-
2026-05-31days on market $149,000 Active 12 DOM
-
2026-05-30days on market $149,000 Active 11 DOM
-
2026-05-19$149,000 Active
ⓘ Source: listings_history table (triggers on properties + properties_extension) + one-shot
backfill from property_details.listing_events for pre-trigger history.
Tax reassessment forecast FL · Resets to sale price
- Current annual tax
- $1,396 · $116/mo
- Projected year-2 tax
- $1,396 · $116/mo
- Expected delta
- $0/yr ($0/mo · 0.0%)
ⓘ Screening estimate from a state-policy table — verify with the county assessor before closing.
Climate risk First Street
- Flood 1/10 Low FEMA zone X (unshaded) · 0% chance over 30 yrs
- Wildfire 7/10 Severe
- Heat 8/10 Severe 7 d/yr ≥108°F today · 22 d/yr by 30 yrs out
- Wind 9/10 Extreme 99% chance of damaging wind over 30 yrs
- Air quality 3/10 Moderate 2 unhealthy d/yr today · 2 by 30 yrs out
Nearby sold comps map
Loading sold comps map…
Walkable amenities ~0.75 mi
Loading nearby amenities…
Taxation est. · year 1
- Rental income
- $20,561
- − Mortgage interest
- −$8,346
- − Property taxes
- −$1,396
- − Insurance
- −$745
- − Repairs & maintenance
- −$1,645
- − Management
- −$1,645
- − Depreciation
- −$4,335
- Taxable income
- $2,450
- Est. tax owed @ 24.0%
- −$588
- After-tax cash flow
- $4,138/yr
For passive investors: Depreciation is non-cash, so a rental often shows a tax loss while cash-flowing — sheltering income. Rental losses are passive: they offset passive income freely, and up to $25,000/yr can offset ordinary (W-2) income if you actively participate and your MAGI is under $100k (phasing out to $0 by $150k); unused losses carry forward. On sale, claimed depreciation is recaptured at up to 25%, and gains may owe capital-gains tax (a 1031 exchange can defer both). Figures are a year-1 estimate at your 24.0% rate — not tax advice; consult a CPA.
Schools (NCES district)
- District
- Marion
- NCES district ID
- 1201260
- Math proficiency
- 42% ▼ -7.00%
- Reading proficiency
- 43% ▼ -4.00%
- Median HH income
- $40,015
- Composite
- 35.61/100
- National rank
- #4890
- State rank
- #61 of 73 in FL
Livability — Silver Springs Shores East
No livability data for this city. (Only ~50 U.S. cities are tracked.)
Census & demographics
- County
- Marion County · 315,796 people
- Metro
- Ocala, FL
- Population (ZIP)
- 9,318
- Household income
- $46,512
- Rent vs Own
- Severe rent burden
- 303.0
Population outlook (Marion County) Hauer SSP2
- Today (2025)
- 365,905 people
- By 2030
- 376,768 · +3.0%
- By 2040
- 396,555 · +8.4%
- By 2050
- 412,723 · +12.8%
- By 2075
- 446,090 · +21.9%
- By 2100
- 436,193 · +19.2%
Race, ethnicity, and origin ACS 2023
- Neighborhood character
- Predominantly White (81%)
- Race & ethnicity
- White 81% Two or more races 12% Hispanic / Latino 11%
- Hispanic origin (detail)
- Mexican 5% Puerto Rican 3% Cuban 3%
- Common ancestry
- Slovak 4% Romanian 2% Lithuanian 2%
- Foreign-born
- 5% · Canada
- Languages at home
- 93% English-only · Spanish 7%
Political lean MEDSL · Marion
- 2024 margin
- Solid R (+31.6) · D 33.8% · R 65.5%
- 2008→2024 swing
- -20.0pp toward R · 2008: -11.6pp · 2024: -31.6pp
- All cycles
- 2024: R+31.6 2020: R+25.9 2016: R+26.2 2012: R+16.2 2008: R+11.6
Not yet ingested
- Civics
- —
Market trends
- HPI YoY
- ▼ -54.21%
- Current HPI
- 242.0408
- Rent YoY
- —
- Metro
- Ocala, FL
- State GDP YoY
- ▲ 3.28%
- F500 in state
- 36
Industry mix (Fortune 500 HQ in FL)
| Industry | F500 HQs | Revenue |
|---|---|---|
| Industrial Technology | 2 | $29B |
|
||
| Insurance | 2 | $17B |
|
||
| Retail | 1 | $60B |
|
||
| Technology Distribution | 1 | $58B |
|
||
| Homebuilding | 1 | $35B |
|
||
| Technology Manufacturing | 1 | $35B |
|
||
Property tax history
+7.6%/yrLatest (2025): $1,396 · +23.9% YoY. Source: county tax records.
Cash-flow waterfall
monthlySold comps — $/sqft
last 12 mo · ≤1 miLoading sold comps…