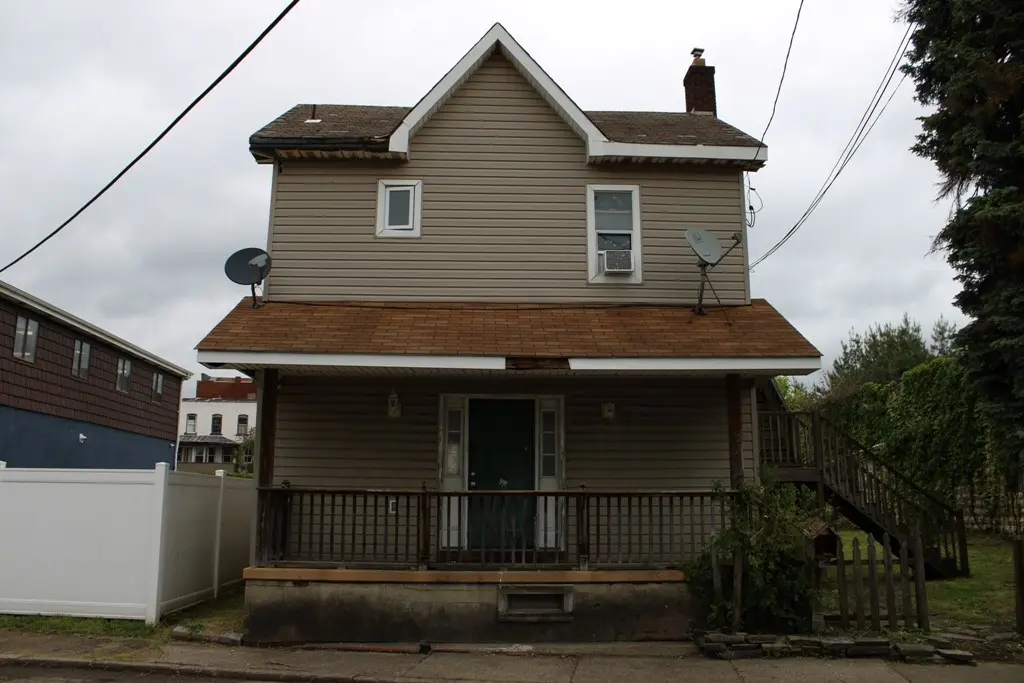
222 James E Wolfe St · Tarentum, PA
Flood risk 9/10 · Severe
- FEMA flood zone
- X (unshaded)
- Chance of flooding over 30 yrs
- 0.79%
- Est. flood insurance / yr
- $473 – $860
Fire risk 1/10 · Minimal
- Est. fire insurance / yr
- $511 – $949
Heat risk 5/10 · Moderate
- Hot days now (above 97°F)
- 8 days/yr
- Hot days in 30 yrs
- 20 days/yr
Wind risk 2/10 · Minimal
- Chance of severe wind over 30 yrs
- —
Air-quality risk 4/10 · Minor
- Unhealthy air days now
- 5 days/yr
- Unhealthy air days in 30 yrs
- 6 days/yr
Risk factors via First Street. Map © Google.
Why this score? — see what drove the B grade
The composite is a weighted blend of 9 inputs, each scored 0–100. Each bar is that input's sub-score; the figure is the points it added to the 100-point composite (weight × sub-score).
- Cash flow +30.0/30.0
- 1% rule +10.0/10.0
- DSCR +10.0/10.0
- ARV discount +7.5/15.0
- Appreciation +5.2/10.0
- Livability +4.0/5.0
- Schools +3.3/10.0
- Rent growth +2.5/5.0
- Condition / age +2.5/5.0
$49,900
🖨 Deal sheet 📄 Offer letter ✓ Due diligence
Listing remarks MLS
LG RMS, LOTS OF CLOSET SPACE, DECOR. FP IN LR, CA- 1YR, FNCD YD, FRNT & BCK PORCH EASY TO CONVRT TO APTS. AGENT
Key facts
- 5,257 sq ft lot
- 2 parking spots
- Built 1915
Property features AI
Finance
- HOA & community: Public transportation nearby
Exterior
- Parking: Assigned parking for 2 vehicles
- Utilities: Gas heating; Central air conditioning
- Home design: 2-story home; Frame construction; Asphalt roof; Resale property
- Construction: Frame construction; Asphalt roof
- Exterior features: Lot approximately 55 x 92; Public transportation access
Interior
- Kitchen: Kitchen (Lower) — 16x10
- Bedrooms: Bedroom 2 (Upper) — 12x11; Bedroom 3 (Upper) — 12x11; Additional bedroom-sized room (Upper) — 15x11; Bonus room (Lower) — 13x8
- Flooring: Hardwood; Vinyl
- Bathrooms: 1 full bathroom
- Heating & cooling: Forced air heating (gas); Central air conditioning
- Interior features: Hardwood and vinyl flooring; Unfinished basement
- Laundry & utility: Basement provides utility/unfinished space
Neighborhood map
What this means for you Summary
Snapshot
- This is a 3-bed/1.0-bath single-family listed at $50k.
Deal economics
- At list price, monthly cash flow is $534 ($6k/yr) — positive.
- The deal already cash-flows at list — no discount required.
- Meets the 1% rule at list price ($1k rent vs $50k).
- Cap rate 20.5% vs local median 9.6% in Tarentum — top-decile yield for the area; either an underpriced asset or a hidden risk that comps aren't pricing in. Stress-test before assuming the spread holds.
Location & tenants
- Location reads 79/100 on livability (#240 in PA, #2,066 nationally) — a middle-class / working-renter tenant base. Strengths: commute A+, cost of living A+, housing A+; Watch: schools C-, amenities F, employment F.
- Highlands SD (suburban): math 29% / reading 48% proficiency, ranked #376 of 539 in PA (top 70%) — families likely to look elsewhere, expect single-tenant / working-renter base with shorter leases.
- Market conditions: 39 active listings in the ZIP; 8 comparable units currently listed for rent nearby; rentals at typical pace (median 15d on market — plan ~3-4 weeks tenant-placement turnaround); 2,996 units permitted in Allegheny County in 2024 (1,588 in 5+ unit buildings).
Forward outlook
- In year one you build about $571 of equity ($345 loan paydown + $226 appreciation (0.5% local appreciation)).
- At projected returns (0.5% appreciation + 3.0% rent growth), your $14k cash investment doubles in ~2 years — after that, you're playing with house money.
Negotiation context
- Only 9 days on market — expect competitive offers; lowballing is unlikely to land.
- 2 sale attempts since 28y ago with the ask held roughly flat each time — persistent listings suggest the price (not the market) is what's stuck; bring a comps-based counter.
- Current owner paid $43k; 16% above their basis — modest negotiation headroom, anchor on the comps not their cost.
Risks & watch-outs
- Watch-outs: property tax is 3.2% of price; flood insurance adds $56/mo; built in 1915 — expect roof / HVAC / electrical / plumbing capex.
- Climate carrying-cost: severe flood risk; extreme-heat days projected 8→20/yr by 2055 (HVAC capex compounding) — expect insurance premiums to compound above CPI over the hold.
Questions for the listing agent
- Built in 1915 — when were the roof, HVAC, electrical panel, plumbing, and water heater last replaced?
- Property tax is high relative to price — has the assessment been appealed recently, and will the sale trigger a re-assessment?
- What's the actual annual flood-insurance premium (NFIP or private), and is the property in a SFHA with mandatory coverage?
- Is there a deadline driving the sale (1031 exchange, divorce, estate, relocation)? That informs how much negotiation room exists.
- What's the average days-on-market for RENTAL listings here right now (not sales)? A rising rental-DOM trend means longer vacancies and softer asking-rent achievability than the comps imply.
- What's the recent tenant-quality profile in this submarket — average credit score on applications, eviction rate, late-payment / NSF rate, and stable-employment percentage? A property-management company in the area should have these aggregated.
- How much new for-sale + rental construction is in the pipeline within 1–3 miles? Heavy new supply typically softens prices + rents 12–24 months out; constrained supply supports both.
Investment metrics
- 1% rule
- 2.55% ✓
- Cap rate
- 20.47%
- Cash-on-cash
- 50.64%
- DSCR
- 3.25
- GRM
- 3.3
CMA / ARV
- ARV (on-the-fly)
- $129,600
- Comps found
- 12
Show comp detail 12 sales within ~0.75 mi
| Address | Dist | Beds/Ba | Sqft | Sold | Price | $/sf | Match |
|---|---|---|---|---|---|---|---|
| 313 E 9th Ave | 0.25mi | 3/2.0 | 1,851 (+7%) | 3mo | $75,000 | $41 | 70 |
| 616 E 3rd Ave | 0.46mi | 3/2.0 | 1,694 (-2%) | 6mo | $125,000 | $74 | 66 |
| 439 E 7th Ave | 0.34mi | 4/1.5 (+1) | 1,648 (-5%) | 4mo | $26,000 | $16 | 66 |
| 410 W 8th Ave | 0.58mi | 3/2.0 | 1,691 (-2%) | 2mo | $62,500 | $37 | 64 |
| 422 W 8th Ave | 0.61mi | 3/1.5 | 1,690 (-2%) | 3mo | $151,000 | $89 | 64 |
| 218 W 10th Ave | 0.44mi | 3/1.0 | 1,598 (-8%) | 4mo | $162,500 | $102 | 63 |
| 417 W 8th Ave | 0.59mi | 3/2.0 | 1,760 (+2%) | 5mo | $43,000 | $24 | 61 |
| 109 E 10th Ave | 0.28mi | 4/1.5 (+1) | 1,536 (-11%) | 4mo | $115,000 | $75 | 58 |
| 270 Kentucky Dr | 0.68mi | 3/2.0 | 1,800 (+4%) | 2mo | $246,000 | $137 | 56 |
| 326 E 9th Ave | 0.27mi | 4/1.5 (+1) | 1,934 (+12%) | 6mo | $50,000 | $26 | 56 |
| 1317 Pitcairn St | 0.56mi | 3/3.0 | 1,554 (-10%) | 4mo | $160,000 | $103 | 46 |
| 637 E 10th Ave | 0.57mi | 4/2.0 (+1) | 1,980 (+15%) | 1mo | $192,500 | $97 | 40 |
Match score weights: distance 35% · size 25% · config 20% · recency 20%. Top-matched comps best support the ARV.
Projected returns pro-forma
0.45% appreciation · 3.0% rent growth · sell at horizon
- IRR
- 47.9%
- Equity multiple
- 3.41×
- Total profit
- $33,731
- Equity at exit
- $15,632
- IRR
- 50.1%
- Equity multiple
- 6.82×
- Total profit
- $81,359
- Equity at exit
- $19,728
Cash invested: $13,972 (down + closing). Projections, not guarantees.
Landlord ↔ Tenant lean methodology
- Overall (STATE)
- 62 Landlord-Friendly
- State Pennsylvania
- 62 Landlord-Friendly · EVEN
- County
- — inherits STATE
- City
- — inherits STATE
ZIP-level market 15084
- Home prices YoY
- 0.2%
- Active inventory
- 39
- Price-to-rent
- 3.3×
Monthly cashflow live
- Estimated rent
- $1,275 high interval (Pro) →
- Mortgage (P&I)
- −$262
- Tax from tax record
- −$135 /mo · $1,619/yr
- Insurance
- −$21
- Flood insurance flood zone
- −$56 /mo · $666/yr
- HOA
- −$0
- Vacancy / Maint / Mgmt
- −$268
- Net cashflow
- $534
Break-even live
UW: 25.0% down · 7.5% · 30yr · 1.5% tax · 5.0% vac · 8.0% maint · 8.0% mgmt
Financing live
Cash to close
- Down payment
- $12,475
- Closing costs
- $1,497
- Reserves months
- —
- Total cash needed
- —
Loan-product check · same deal, 3 products live
Conventional
25% down · 7.5% · 30yr
- Down + closing
- —
- Monthly P&I
- —
- Monthly cashflow
- —
- DSCR
- —
- Eligible?
- —
Personal DTI + credit; lowest rate.
DSCR
20% down · 8.5% · 30yr
- Down + closing
- —
- Monthly P&I
- —
- Monthly cashflow
- —
- DSCR
- —
- Eligible?
- —
No personal income docs; deal must DSCR.
Hard money
10% down · 12.0% · 12mo
- Down + closing
- —
- Monthly P&I
- —
- Monthly cashflow
- —
- DSCR
- —
- Eligible?
- —
Short-term bridge; refi at stabilization.
Rent comps 8 comps
| Address | Beds | Baths | Sqft | Rent | $/sqft | DOM | Units | Dist |
|---|---|---|---|---|---|---|---|---|
| 424 W 7th Ave Unit 1 Tarentum, PA | 2.0 | 1.0 | 1632 | $1,000 | $0.61 | 43d | 1 | 0.61mi |
| 424 W 7th Ave Unit 2 Tarentum, PA | 3.0 | 1.0 | 1632 | $1,250 | $0.77 | 43d | 1 | 0.61mi |
| 875 1st Ave Brackenridge, PA | 3.0 | 2.0 | 1440 | $1,399 | $0.97 | 14d | 1 | 0.76mi |
| 1067 Cleveland Ave Brackenridge, PA | 3.0 | 1.0 | 1096 | $1,500 | $1.37 | 43d | 1 | 1.03mi |
| 1067 Cleveland Ave Brackenridge, PA | 3.0 | 1.0 | 1096 | $1,350 | $1.23 | 1d | 1 | 1.03mi |
| 1079 9th Ave Brackenridge, PA | 2.0 | 1.0 | 1352 | $1,095 | $0.81 | 1d | 1 | 1.09mi |
| 300 Craigdell Rd New Kensington, PA | 3.0 | 2.0 | 1300 | $1,130 | $0.87 | 1d | 1 | 1.12mi |
| 1210 Minnesota Ave Natrona Heights, PA | 3.0 | 1.0 | 1224 | $1,980 | $1.62 | 1d | 1 | 1.36mi |
Listing history 8 events
-
2026-06-18days on market $49,900 Active 9 DOM
-
2026-06-17days on market $49,900 Active 8 DOM
-
2026-06-16days on market $49,900 Active 7 DOM
-
2026-06-15days on market $49,900 Active 6 DOM
-
2026-06-13days on market $49,900 Active 4 DOM
-
2026-06-13days on market $49,900 Active 3 DOM
-
2026-06-10remarks 693-char remark
-
2026-06-10$49,900 Active 1 DOM
ⓘ Source: listings_history table (triggers on properties + properties_extension) + one-shot
backfill from property_details.listing_events for pre-trigger history.
Tax reassessment forecast PA · Partial reset (capped growth)
- Current annual tax
- $1,619 · $135/mo
- Projected year-2 tax
- $1,619 · $135/mo
- Expected delta
- $0/yr ($0/mo · 0.0%)
ⓘ Screening estimate from a state-policy table — verify with the county assessor before closing.
Climate risk First Street
- Flood 9/10 Extreme FEMA zone X (unshaded) · 79% chance over 30 yrs
- Wildfire 1/10 Low
- Heat 5/10 Major 8 d/yr ≥97°F today · 20 d/yr by 30 yrs out
- Wind 2/10 Low
- Air quality 4/10 Moderate 5 unhealthy d/yr today · 6 by 30 yrs out
Nearby sold comps map
Loading sold comps map…
Walkable amenities ~0.75 mi
Loading nearby amenities…
Taxation est. · year 1
- Rental income
- $15,297
- − Mortgage interest
- −$2,795
- − Property taxes
- −$1,619
- − Insurance
- −$916
- − Repairs & maintenance
- −$1,224
- − Management
- −$1,224
- − Depreciation
- −$1,452
- Taxable income
- $6,068
- Est. tax owed @ 24.0%
- −$1,456
- After-tax cash flow
- $4,953/yr
For passive investors: Depreciation is non-cash, so a rental often shows a tax loss while cash-flowing — sheltering income. Rental losses are passive: they offset passive income freely, and up to $25,000/yr can offset ordinary (W-2) income if you actively participate and your MAGI is under $100k (phasing out to $0 by $150k); unused losses carry forward. On sale, claimed depreciation is recaptured at up to 25%, and gains may owe capital-gains tax (a 1031 exchange can defer both). Figures are a year-1 estimate at your 24.0% rate — not tax advice; consult a CPA.
Schools (NCES district)
- District
- Highlands SD
- NCES district ID
- 4211880
- Math proficiency
- 29% ▼ -9.00%
- Reading proficiency
- 48% ▼ -9.00%
- Median HH income
- $43,730
- Composite
- 32.58/100
- National rank
- #5679
- State rank
- #376 of 539 in PA
Livability — Tarentum
- Score
- 79/100
- State rank
- #240
- US rank
- #2066
Category grades
Schools grade is shown separately in the Schools card above.
Census & demographics
- Census place
- Tarentum, PA
- Population (ZIP)
- 9,884
Population outlook (Allegheny County) Hauer SSP2
- Today (2025)
- 1,250,282 people
- By 2030
- 1,256,482 · +0.5%
- By 2040
- 1,256,318 · +0.5%
- By 2050
- 1,244,169 · -0.5%
- By 2075
- 1,197,693 · -4.2%
- By 2100
- 1,093,187 · -12.6%
Race, ethnicity, and origin ACS 2023
- Neighborhood character
- Predominantly White (92%)
- Race & ethnicity
- White 92% Two or more races 4% Black 3% Hispanic / Latino 1%
- Common ancestry
- Romanian 14% Lithuanian 2% Serbian 2%
- Foreign-born
- 1%
- Languages at home
- 98% English-only · French/Haitian/Cajun 1%
Political lean MEDSL · Allegheny
- 2024 margin
- Strong D (+20.3) · D 59.7% · R 39.4%
- 2008→2024 swing
- +4.8pp toward D · 2008: 15.5pp · 2024: 20.3pp
- All cycles
- 2024: D+20.3 2020: D+20.4 2016: D+16.4 2012: D+14.4 2008: D+15.5
Not yet ingested
- Civics
- —
Market trends
- HPI YoY
- ▲ 0.45%
- Current HPI
- 230.7532
- Rent YoY
- —
- Metro
- —
- State GDP YoY
- ▲ 1.68%
- F500 in state
- 34
Industry mix (Fortune 500 HQ in PA)
| Industry | F500 HQs | Revenue |
|---|---|---|
| Healthcare | 2 | $309B |
|
||
| Insurance | 2 | $27B |
|
||
| Telecommunications / Media | 1 | $124B |
|
||
| Industrial Distribution | 1 | $22B |
|
||
| Financial Services | 1 | $20B |
|
||
| Chemicals / Materials | 1 | $18B |
|
||
Price history
+46.8% since first listed5 events — show timeline
- 2026-06-08 Listed $49,900 West Penn MLS
- 1998-06-30 Sold (Public Records) $43,000 Public Records
- 1998-06-24 Sold (MLS) $43,000 West Penn MLS
- 1998-01-06 Listed $45,900 West Penn MLS
- 1993-07-09 Sold (Public Records) $34,000 Public Records
Property tax history
+0.8%/yrLatest (2026): $1,619 · -1.3% YoY. Source: county tax records.
Cash-flow waterfall
monthlySold comps — $/sqft
last 12 mo · ≤1 miLoading sold comps…