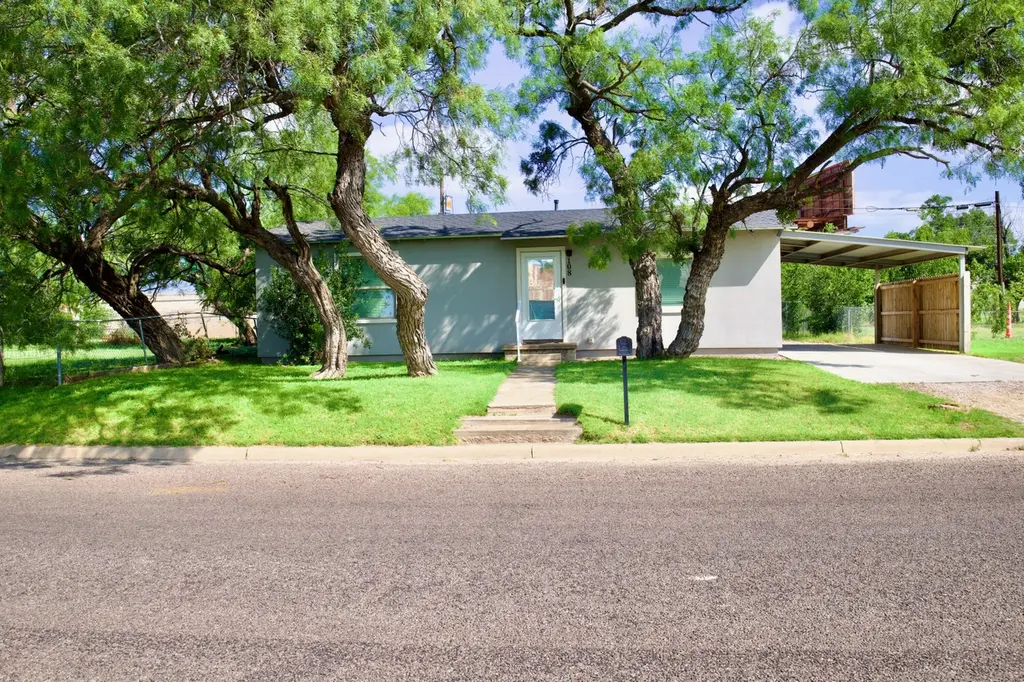
108 W 5th St · San Angelo, TX
Flood risk 1/10 · Minimal
- FEMA flood zone
- X (unshaded)
- Chance of flooding over 30 yrs
- 0.0%
- Est. flood insurance / yr
- $507 – $1,088
Fire risk 2/10 · Minimal
- Est. fire insurance / yr
- $1,222 – $2,270
Heat risk 7/10 · Major
- Hot days now (above 104°F)
- 7 days/yr
- Hot days in 30 yrs
- 23 days/yr
Wind risk 4/10 · Minor
- Chance of severe wind over 30 yrs
- 12.0%
Air-quality risk 1/10 · Minimal
- Unhealthy air days now
- 0 days/yr
- Unhealthy air days in 30 yrs
- 0 days/yr
Risk factors via First Street. Map © Google.
Why this score? — see what drove the D grade
The composite is a weighted blend of 9 inputs, each scored 0–100. Each bar is that input's sub-score; the figure is the points it added to the 100-point composite (weight × sub-score).
- Cash flow +13.9/30.0
- ARV discount +4.7/15.0
- Rent growth +4.6/5.0
- DSCR +4.2/10.0
- 1% rule +3.9/10.0
- Livability +3.7/5.0
- Schools +2.6/10.0
- Condition / age +2.5/5.0
- Appreciation +0.0/10.0
$130,000
🖨 Deal sheet (PDF) 📄 Offer letter ✓ Due diligence
Listing remarks
This charming home offers great updates and an exceptional value. Pride of ownership is evident throughout, featuring no carpet and beautiful hardwood flooring in several areas of the home. The kitchen comes equipped with an oven, microwave, washer, and dryer, making it move-in ready. Step outside to an entertainer's dream with a spacious covered deck and fenced backyard, perfect for relaxing or hosting family and friends. A storage shed provides plenty of space for lawn equipment and outdoor essentials. The property extends beyond the fenced area, offering additional room to enjoy. An adjoining lot is also available for purchase at an additional cost. Don't miss your opportunity to own thi
Key facts
- Hardwood flooring
- Covered deck
- Additional room
Tags
Property features AI
Exterior
- Parking: Carport with 2 spaces (detached/attached not specified)
- Security: Smoke detectors
- Utilities: Public water; Public sewer; Electricity connected; Water connected; Sewer connected
- Home design: Single-family residence; One story; Stucco exterior and other construction materials; Entry level not specified; Facing direction not specified
- Construction: Composition roof; Pillar/post/pier foundation; Built with stucco and other materials
- Exterior features: Full privacy fencing; Shed on property; Paved city street frontage; Interior lot
Interior
- Kitchen: Electric range; Microwave
- Bedrooms: Total of 5 rooms (bedroom count not specified)
- Flooring: Hardwood; Laminate; Vinyl
- Bathrooms: 1 full bathroom
- Heating & cooling: Central heating (electric); Central air conditioning (electric); Ceiling fans
- Interior features: Laminate countertops; Ceiling fans; Blinds; Double-pane windows; Electric water heater
- Laundry & utility: Washer hookup; Electric dryer hookup; Laundry located in kitchen
Neighborhood map
What this means for you Summary
Snapshot
- This is a 2-bed/1.0-bath single-family listed at $130k.
Deal economics
- At list price, monthly cash flow is $15 ($183/yr) — positive.
- The deal already cash-flows at list — no discount required.
- To meet the 1% rule (rent ≥ 1% of price), the offer needs to be $115k (11.4% below list).
- Recommended offer: $115k (11.4% below list) — sets the bar for 1% rule.
- Cap rate 6.4% vs local median 3.8% in San Angelo — top-decile yield for the area; either an underpriced asset or a hidden risk that comps aren't pricing in. Stress-test before assuming the spread holds.
Location & tenants
- Location reads 73/100 on livability (#199 in TX) — a middle-class / working-renter tenant base. Strengths: cost of living A+, housing A+, health & safety A+; Watch: employment C-, amenities F, commute F.
- San Angelo ISD (urban): math 27% / reading 33% proficiency, ranked #627 of 826 in TX (top 76%) — families likely to look elsewhere, expect single-tenant / working-renter base with shorter leases.
- Zoned schools: Reagan El (math 32% / reading 32%, grade F, #2,268 of 4,322 statewide, top 55%, 311 students, 88% FRL); Lone Star Middle (math 28% / reading 32%, grade F, #1,056 of 1,662 statewide, top 65%, 903 students, 63% FRL); Central H S (math 22% / reading 43%, grade F, #1,029 of 1,632 statewide, top 64%, 3,065 students, 48% FRL).
- Market conditions: Rents rising fast (+8.5%/yr); 229 active listings in the ZIP; 17 comparable units currently listed for rent nearby; rentals lingering (median 46d on market — plan ~5-8 weeks vacancy on turnover, expect pricing pressure); 76% of comp listings sitting > 30 days — soft ceiling on asking rent; 233 units permitted in Tom Green County in 2024 (0 in 5+ unit buildings).
Forward outlook
- Local home prices are declining (-3.0%/yr); year-one equity from $899 of loan paydown is wiped out by about $4k of value loss. Plan a longer hold.
- Tom Green County population projected at +35% by 2050 — long-run rental-demand tailwind backs the buy-and-hold thesis.
Negotiation context
- Only 12 days on market — expect competitive offers; lowballing is unlikely to land.
Risks & watch-outs
- Watch-outs: built in 1958 — expect roof / HVAC / electrical / plumbing capex.
- Climate carrying-cost: extreme-heat days projected 7→23/yr by 2055 (HVAC capex compounding) — expect insurance premiums to compound above CPI over the hold.
Questions for the listing agent
- Built in 1958 — when were the roof, HVAC, electrical panel, plumbing, and water heater last replaced?
- Is there a deadline driving the sale (1031 exchange, divorce, estate, relocation)? That informs how much negotiation room exists.
- Schools are F-rated, which usually means shorter tenancies and higher turnover. Who's the typical renter profile here, and what's been the actual vacancy rate?
- The area grade is low — what's the realistic commute time and amenity access for the typical tenant pool here? Any planned neighborhood developments (good or bad) we should know about?
- What's the average days-on-market for RENTAL listings here right now (not sales)? A rising rental-DOM trend means longer vacancies and softer asking-rent achievability than the comps imply.
- What's the recent tenant-quality profile in this submarket — average credit score on applications, eviction rate, late-payment / NSF rate, and stable-employment percentage? A property-management company in the area should have these aggregated.
- How much new for-sale + rental construction is in the pipeline within 1–3 miles? Heavy new supply typically softens prices + rents 12–24 months out; constrained supply supports both.
Investment metrics
- 1% rule
- 0.89% ✗
- Cap rate
- 6.43%
- Cash-on-cash
- 0.50%
- DSCR
- 1.02
- GRM
- 9.4
CMA / ARV
- ARV (on-the-fly)
- $122,400
- Comps found
- 3
Show comp detail 3 sales within ~0.75 mi
| Address | Dist | Beds/Ba | Sqft | Sold | Price | $/sf | Match |
|---|---|---|---|---|---|---|---|
| 203 E 11th St | 0.53mi | 2/1.0 | 816 (+2%) | 2mo | $125,000 | $153 | 70 |
| 20 W 10th St | 0.27mi | 1/1.0 (-1) | 868 (+8%) | 20mo | $49,500 | $57 | 52 |
| 231 E 3rd St | 0.51mi | 2/2.0 | 696 (-13%) | 18mo | $170,000 | $244 | 36 |
Match score weights: distance 35% · size 25% · config 20% · recency 20%. Top-matched comps best support the ARV.
Projected returns pro-forma
-3.0% appreciation · 8.0% rent growth · sell at horizon
- IRR
- -10.1%
- Equity multiple
- 0.62×
- Total profit
- $-13,995
- Equity at exit
- $19,383
- IRR
- 5.1%
- Equity multiple
- 1.46×
- Total profit
- $16,817
- Equity at exit
- $11,240
Cash invested: $36,400 (down + closing). Projections, not guarantees.
Landlord ↔ Tenant lean methodology
- Overall (STATE)
- 87 Strongly Landlord-Friendly
- State Texas
- 87 Strongly Landlord-Friendly · R+5
- County
- — inherits STATE
- City
- — inherits STATE
ZIP-level market 76903
- Rents YoY
- 8.5%
- Active inventory
- 229
- Price-to-rent
- 9.4×
Monthly cashflow live
- Estimated rent
- $1,151 high interval (Pro) →
- Mortgage (P&I)
- −$682
- Tax from tax record
- −$158 /mo · $1,900/yr
- Insurance
- −$54
- HOA
- −$0
- Vacancy / Maint / Mgmt
- −$242
- Net cashflow
- $15
Break-even live
Sensitivity live
| Price | -10% $89 | -5% $52 | +0% $15 | +5% $-22 | +10% $-58 |
|---|---|---|---|---|---|
| Rent | -10% $-76 | -5% $-30 | +0% $15 | +5% $61 | +10% $106 |
| Rate | -1.0pp $81 | -0.5pp $48 | base $15 | +0.5pp $-18 | +1.0pp $-53 |
UW: 25.0% down · 7.5% · 30yr · 1.5% tax · 5.0% vac · 8.0% maint · 8.0% mgmt
Financing live
Cash to close
- Down payment
- $32,500
- Closing costs
- $3,900
- Reserves months
- —
- Total cash needed
- —
Loan-product check · same deal, 3 products live
Conventional
25% down · 7.5% · 30yr
- Down + closing
- —
- Monthly P&I
- —
- Monthly cashflow
- —
- DSCR
- —
- Eligible?
- —
Personal DTI + credit; lowest rate.
DSCR
20% down · 8.5% · 30yr
- Down + closing
- —
- Monthly P&I
- —
- Monthly cashflow
- —
- DSCR
- —
- Eligible?
- —
No personal income docs; deal must DSCR.
Hard money
10% down · 12.0% · 12mo
- Down + closing
- —
- Monthly P&I
- —
- Monthly cashflow
- —
- DSCR
- —
- Eligible?
- —
Short-term bridge; refi at stabilization.
Rent comps 17 comps
| Address | Beds | Baths | Sqft | Rent | $/sqft | DOM | Units | Dist |
|---|---|---|---|---|---|---|---|---|
| 134 E 11th St San Angelo, TX | 3.0 | 2.0 | 872 | $1,025 | $1.18 | 45d | 1 | 0.52mi |
| 212 Koberlin St San Angelo, TX | 2.0 | 2.0 | 925 | $945 | $1.02 | 45d | 1 | 0.56mi |
| 540 W 16th St San Angelo, TX | 3.0 | 2.0 | 1090 | $1,364 | $1.25 | 45d | 1 | 0.70mi |
| 902 Shiloh St Unit RE-908-C San Angelo, TX | 2.0 | 1.5 | 925 | $1,175 | $1.27 | 45d | 1 | 0.71mi |
| 902 Shiloh St Unit RE-908-20 San Angelo, TX | 1.0 | 1.0 | 800 | $1,025 | $1.28 | 45d | 1 | 0.71mi |
| 902 Shiloh St Unit RE-908-16 San Angelo, TX | 2.0 | 1.0 | 875 | $1,125 | $1.29 | 45d | 1 | 0.71mi |
| 504 E 17th St San Angelo, TX | 1.0 | 1.0 | 810 | $875 | $1.08 | 45d | 1 | 0.85mi |
| 302 Allen St #18 San Angelo, TX | 2.0 | 1.0 | 780 | $2,000 | $2.56 | 23d | 1 | 0.96mi |
| 302 Allen St San Angelo, TX | 2.0 | 1.0 | 780 | $950 | $1.22 | 23d | 1 | 0.97mi |
| 209 West Avenue C Unit A San Angelo, TX | 2.0 | 2.0 | 1100 | $1,400 | $1.27 | 45d | 1 | 1.00mi |
| 810 W 19th St San Angelo, TX | 3.0 | 2.0 | 1090 | $1,249 | $1.15 | 23d | 1 | 1.04mi |
| 1222 S Abe St Unit CK-04 San Angelo, TX | 1.0 | 1.0 | 694 | $1,000 | $1.44 | 45d | 1 | 1.31mi |
| 1222 S Abe St Unit CK-03 San Angelo, TX | 2.0 | 1.5 | 1007 | $1,425 | $1.42 | 45d | 1 | 1.31mi |
| 1222 S Abe St Unit CK-02 San Angelo, TX | 2.0 | 1.5 | 837 | $1,200 | $1.43 | 45d | 1 | 1.31mi |
| 1222 S Abe St Unit CK-26 San Angelo, TX | 1.0 | 1.0 | 619 | $875 | $1.41 | 45d | 1 | 1.31mi |
| 121 N Van Buren St Unit A San Angelo, TX | 2.0 | 1.0 | 715 | $1,095 | $1.53 | 23d | 1 | 1.32mi |
| 2417 Oaklawn Blvd San Angelo, TX | 2.0 | 2.0 | 897 | $1,550 | $1.73 | 45d | 1 | 1.42mi |
Listing history 10 events
-
2026-06-22days on market $130,000 Active 12 DOM
-
2026-06-19days on market $130,000 Active 10 DOM
-
2026-06-18days on market $130,000 Active 9 DOM
-
2026-06-17days on market $130,000 Active 8 DOM
-
2026-06-16days on market $130,000 Active 7 DOM
-
2026-06-15days on market $130,000 Active 6 DOM
-
2026-06-14days on market $130,000 Active 4 DOM
-
2026-06-13days on market $130,000 Active 3 DOM
-
2026-06-10remarks 699-char remark
-
2026-06-10$130,000 Active 1 DOM
ⓘ Source: listings_history table (triggers on properties + properties_extension) + one-shot
backfill from property_details.listing_events for pre-trigger history.
Tax reassessment forecast TX · Resets to sale price
- Current annual tax
- $1,900 · $158/mo
- Projected year-2 tax
- $2,379 · $198/mo
- Expected delta
- +$479/yr (+$40/mo · 25.2%)
ⓘ Screening estimate from a state-policy table — verify with the county assessor before closing.
Climate risk First Street
- Flood 1/10 Low FEMA zone X (unshaded) · 0% chance over 30 yrs
- Wildfire 2/10 Low
- Heat 7/10 Severe 7 d/yr ≥104°F today · 23 d/yr by 30 yrs out
- Wind 4/10 Moderate 12% chance of damaging wind over 30 yrs
- Air quality 1/10 Low 0 unhealthy d/yr today · 0 by 30 yrs out
Nearby sold comps map
Loading sold comps map…
Walkable amenities ~0.75 mi
Loading nearby amenities…
Taxation est. · year 1
- Rental income
- $13,815
- − Mortgage interest
- −$7,282
- − Property taxes
- −$1,900
- − Insurance
- −$650
- − Repairs & maintenance
- −$1,105
- − Management
- −$1,105
- − Depreciation
- −$3,782
- Taxable loss
- −$2,009
- Est. tax savings @ 24.0%
- +$482
- After-tax cash flow
- $665/yr
For passive investors: Depreciation is non-cash, so a rental often shows a tax loss while cash-flowing — sheltering income. Rental losses are passive: they offset passive income freely, and up to $25,000/yr can offset ordinary (W-2) income if you actively participate and your MAGI is under $100k (phasing out to $0 by $150k); unused losses carry forward. On sale, claimed depreciation is recaptured at up to 25%, and gains may owe capital-gains tax (a 1031 exchange can defer both). Figures are a year-1 estimate at your 24.0% rate — not tax advice; consult a CPA.
Schools (NCES district)
- District
- San Angelo ISD
- NCES district ID
- 4838700
- Math proficiency
- 27% ▼ -9.00%
- Reading proficiency
- 33% ▼ -3.00%
- Median HH income
- $43,501
- Composite
- 25.56/100
- National rank
- #7427
- State rank
- #627 of 826 in TX
Livability — San Angelo
- Score
- 73/100
- State rank
- #199
- US rank
- #5030
Category grades
Schools grade is shown separately in the Schools card above.
Census & demographics
- Census place
- San Angelo, TX
- County
- Tom Green County · 113,188 people
- City population
- 81,357
- Metro
- San Angelo, TX
- Population (ZIP)
- 29,947
- Household income
- $49,498
- Rent vs Own
- Severe rent burden
- 1255.0
Population outlook (Tom Green County) Hauer SSP2
- Today (2025)
- 135,110 people
- By 2030
- 144,090 · +6.6%
- By 2040
- 162,561 · +20.3%
- By 2050
- 182,158 · +34.8%
- By 2075
- 232,274 · +71.9%
- By 2100
- 268,218 · +98.5%
Race, ethnicity, and origin ACS 2023
- Neighborhood character
- Diverse neighborhood (Simpson 0.56)
- Race & ethnicity
- Hispanic / Latino 56% White 36% Two or more races 26% Black 5%
- Hispanic origin (detail)
- Mexican 49% Puerto Rican 1%
- Common ancestry
- Italian 1% Serbian 1% Slovak 1%
- Foreign-born
- 10% · Canada
- Languages at home
- 66% English-only · Spanish 33%
Political lean MEDSL · Tom Green
- 2024 margin
- Solid R (+48.0) · D 25.5% · R 73.5% · Other 1.0%
- 2008→2024 swing
- -6.3pp toward R · 2008: -41.7pp · 2024: -48.0pp
- All cycles
- 2024: R+48.0 2020: R+44.4 2016: R+47.9 2012: R+47.9 2008: R+41.7
Not yet ingested
- Civics
- —
Market trends
- HPI YoY
- ▼ -164.90%
- Current HPI
- 217.0406
- Rent YoY
- ▲ 8.46%
- Metro
- San Angelo, TX
- State GDP YoY
- ▲ 3.95%
- F500 in state
- 110
Industry mix (Fortune 500 HQ in TX)
| Industry | F500 HQs | Revenue |
|---|---|---|
| Energy | 16 | $1,198B |
|
||
| Technology | 5 | $198B |
|
||
| Engineering / Construction | 4 | $72B |
|
||
| Energy Services | 3 | $60B |
|
||
| Utilities | 3 | $41B |
|
||
| Healthcare | 2 | $330B |
|
||
Price history
3 events — show timeline
- 2026-06-09 Listed $130,000 SAAR TX
- 2017-11-30 Sold (Public Records) — Public Records
- 2017-07-06 Sold (Public Records) — Public Records
Property tax history
+10.5%/yrLatest (2025): $1,900 · +12.7% YoY. Source: county tax records.
Cash-flow waterfall
monthlySold comps — $/sqft
last 12 mo · ≤1 miLoading sold comps…