2023 E Morrow Ave #46 · Kingman, AZ
Flood risk 4/10 · Minor
- FEMA flood zone
- X (shaded)
- Chance of flooding over 30 yrs
- 0.23%
- Est. flood insurance / yr
- $507 – $1,088
Fire risk 7/10 · Major
- Est. fire insurance / yr
- $610 – $1,132
Heat risk 6/10 · Moderate
- Hot days now (above 100°F)
- 8 days/yr
- Hot days in 30 yrs
- 20 days/yr
Wind risk 1/10 · Minimal
- Chance of severe wind over 30 yrs
- —
Air-quality risk 1/10 · Minimal
- Unhealthy air days now
- 0 days/yr
- Unhealthy air days in 30 yrs
- 0 days/yr
Risk factors via First Street. Map © Google.
Why this score? — see what drove the B- grade
The composite is a weighted blend of 9 inputs, each scored 0–100. Each bar is that input's sub-score; the figure is the points it added to the 100-point composite (weight × sub-score).
- Cash flow +30.0/30.0
- 1% rule +10.0/10.0
- DSCR +10.0/10.0
- ARV discount +7.5/15.0
- Livability +4.0/5.0
- Condition / age +2.8/5.0
- Rent growth +2.6/5.0
- Schools +1.8/10.0
- Appreciation +0.0/10.0
$50,000
🖨 Deal sheet 📄 Offer letter ✓ Due diligence
Listing remarks MLS
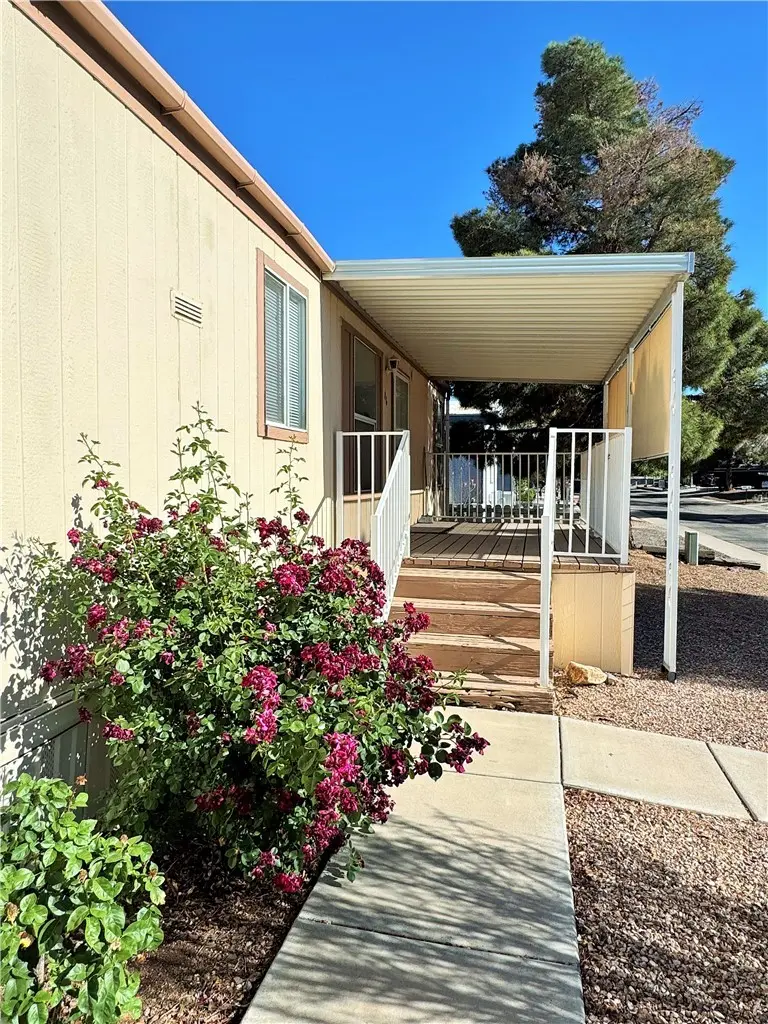
- Centrally located - Well kept park - Corner lot - Shaded parking - Fully landscaped - Deck with privacy screen - Shed -Move in ready
Key facts
- Shaded parking
- Centrally located
- Fully landscaped
Tags
Neighborhood map
What this means for you Summary
Snapshot
- This is a 3-bed/2.0-bath manufactured listed at $50k. Condition is rated average.
Deal economics
- At list price, monthly cash flow is $875 ($10k/yr) — positive.
- The deal already cash-flows at list — no discount required.
- Meets the 1% rule at list price ($2k rent vs $50k).
- Recommended offer: $44k (12.0% below list) — sets the bar for market timing.
- Cap rate 27.3% vs local median 3.6% in Kingman — top-decile yield for the area; either an underpriced asset or a hidden risk that comps aren't pricing in. Stress-test before assuming the spread holds.
Location & tenants
- Location reads 79/100 on livability (#5 in AZ, #2,014 nationally) — a middle-class / working-renter tenant base. Strengths: commute A+, cost of living A+, housing A+; Watch: crime C-, employment C-, schools D+.
- Kingman Unified School District (79598) (town): math 19% / reading 24% proficiency, ranked #179 of 249 in AZ (top 72%) — low school quality limits family demand, transient renter base, plan for 1-2y turnover.
- Market conditions: Rents flat; 643 active listings in the ZIP; 8 comparable units currently listed for rent nearby; rentals at typical pace (median 21d on market — plan ~3-4 weeks tenant-placement turnaround); 2,543 units permitted in Mohave County in 2024 (33 in 5+ unit buildings).
- This rent runs 36% of the median local income ($51k/yr) — at the standard rent-burdened threshold; future hikes will face affordability resistance.
Forward outlook
- Local home prices are declining (-3.0%/yr); year-one equity from $346 of loan paydown is wiped out by about $2k of value loss. Plan a longer hold.
- Mohave County population projected to shrink 6% by 2050 — rents likely to lag national; underwrite the cash flow, not the appreciation.
- At projected returns (-3.0% appreciation + 0.3% rent growth), your $14k cash investment doubles in ~2 years — after that, you're playing with house money.
Negotiation context
- It's been on market 395 days — a 12% lower offer ($44k) is reasonable based on typical stale-listing flexibility.
Risks & watch-outs
- Climate carrying-cost: major wildfire risk; extreme-heat days projected 8→20/yr by 2055 (HVAC capex compounding) — expect insurance premiums to compound above CPI over the hold.
Questions for the listing agent
- It's been on market 395 days. Have you received any prior offers? Is the seller open to a 12% concession, seller financing, or rate buy-down credit?
- Why hasn't it sold? Are there any deal-killer items the seller is aware of (foundation, flood, title, zoning, code violations)?
- Is there a deadline driving the sale (1031 exchange, divorce, estate, relocation)? That informs how much negotiation room exists.
- Schools are D-rated, which usually means shorter tenancies and higher turnover. Who's the typical renter profile here, and what's been the actual vacancy rate?
- What's the average days-on-market for RENTAL listings here right now (not sales)? A rising rental-DOM trend means longer vacancies and softer asking-rent achievability than the comps imply.
- What's the recent tenant-quality profile in this submarket — average credit score on applications, eviction rate, late-payment / NSF rate, and stable-employment percentage? A property-management company in the area should have these aggregated.
- How much new for-sale + rental construction is in the pipeline within 1–3 miles? Heavy new supply typically softens prices + rents 12–24 months out; constrained supply supports both.
Investment metrics
- 1% rule
- 3.09% ✓
- Cap rate
- 27.28%
- Cash-on-cash
- 74.96%
- DSCR
- 4.34
- GRM
- 2.7
CMA / ARV
- ARV (median comp)
- $133,377
- List price
- $50,000
- Delta
- -62.51%
- Verdict
- UNDERPRICED
- Comps
- 2 within 1.0 mi
Show comp detail 1 sale within ~0.75 mi
| Address | Dist | Beds/Ba | Sqft | Sold | Price | $/sf | Match |
|---|---|---|---|---|---|---|---|
| 2023 E Morrow Ave #29 | 0.00mi | 2/1.0 (-1) | 980 (+9%) | 16mo | $62,000 | $63 | 62 |
Match score weights: distance 35% · size 25% · config 20% · recency 20%. Top-matched comps best support the ARV.
Projected returns pro-forma
-3.0% appreciation · 0.33% rent growth · sell at horizon
- IRR
- 71.8%
- Equity multiple
- 4.11×
- Total profit
- $43,582
- Equity at exit
- $7,455
- IRR
- 74.9%
- Equity multiple
- 7.72×
- Total profit
- $94,050
- Equity at exit
- $4,323
Cash invested: $14,000 (down + closing). Projections, not guarantees.
Landlord ↔ Tenant lean methodology
- Overall (STATE)
- 87 Strongly Landlord-Friendly
- State Arizona
- 87 Strongly Landlord-Friendly · R+3
- County
- — inherits STATE
- City
- — inherits STATE
ZIP-level market 86409
- Rents YoY
- 0.3%
- Active inventory
- 643
- Price-to-rent
- 2.7×
Monthly cashflow live
- Estimated rent
- $1,544 high interval (Pro) →
- Mortgage (P&I)
- −$262
- Tax est. 1.5%
- −$62 /mo · $750/yr
- Insurance
- −$21
- HOA
- −$0
- Vacancy / Maint / Mgmt
- −$324
- Net cashflow
- $875
Break-even live
UW: 25.0% down · 7.5% · 30yr · 1.5% tax · 5.0% vac · 8.0% maint · 8.0% mgmt
Financing live
Cash to close
- Down payment
- $12,500
- Closing costs
- $1,500
- Reserves months
- —
- Total cash needed
- —
Loan-product check · same deal, 3 products live
Conventional
25% down · 7.5% · 30yr
- Down + closing
- —
- Monthly P&I
- —
- Monthly cashflow
- —
- DSCR
- —
- Eligible?
- —
Personal DTI + credit; lowest rate.
DSCR
20% down · 8.5% · 30yr
- Down + closing
- —
- Monthly P&I
- —
- Monthly cashflow
- —
- DSCR
- —
- Eligible?
- —
No personal income docs; deal must DSCR.
Hard money
10% down · 12.0% · 12mo
- Down + closing
- —
- Monthly P&I
- —
- Monthly cashflow
- —
- DSCR
- —
- Eligible?
- —
Short-term bridge; refi at stabilization.
Rent comps 8 comps
| Address | Beds | Baths | Sqft | Rent | $/sqft | DOM | Units | Dist |
|---|---|---|---|---|---|---|---|---|
| 3530 N Lomita St Unit C Kingman, AZ | 2.0 | 2.0 | 920 | $1,400 | $1.52 | 21d | 1 | 0.54mi |
| 3736 N Roosevelt St Kingman, AZ | 3.0 | 2.0 | 1093 | $1,425 | $1.30 | 43d | 1 | 0.68mi |
| 3849 N Roosevelt St Kingman, AZ | 2.0 | 1.0 | 856 | $950 | $1.11 | 21d | 1 | 0.68mi |
| 2469 Armour Ave Apt 2 Kingman, AZ | 2.0 | 2.0 | 830 | $1,224 | $1.47 | 21d | 1 | 0.83mi |
| 969 Kenwood Ave Kingman, AZ | 2.0 | 2.0 | 992 | $2,250 | $2.27 | 43d | 1 | 0.99mi |
| 980 Astor Ave Unit 2 Kingman, AZ | 2.0 | 2.0 | 1100 | $1,350 | $1.23 | 13d | 1 | 1.03mi |
| 936 Astor Ave Unit 1 Kingman, AZ | 2.0 | 2.0 | 1100 | $1,400 | $1.27 | 43d | 1 | 1.06mi |
| 924 Astor Ave Unit 2 Kingman, AZ | 2.0 | 2.0 | 1100 | $1,650 | $1.50 | 21d | 1 | 1.06mi |
Listing history 24 events
-
2026-06-18status $50,000 Pending 395 DOM
-
2026-06-18days on market $50,000 Active 395 DOM
-
2026-06-17days on market $50,000 Active 394 DOM
-
2026-06-16days on market $50,000 Active 393 DOM
-
2026-06-15days on market $50,000 Active 392 DOM
-
2026-06-14days on market $50,000 Active 390 DOM
-
2026-06-13days on market $50,000 Active 389 DOM
-
2026-06-10days on market $50,000 Active 387 DOM
-
2026-06-09days on market $50,000 Active 386 DOM
-
2026-06-08days on market $50,000 Active 385 DOM
-
2026-06-07days on market $50,000 Active 384 DOM
-
2026-06-05days on market $50,000 Active 381 DOM
-
2026-06-03days on market $50,000 Active 380 DOM
-
2026-06-02days on market $50,000 Active 379 DOM
-
2026-06-01days on market $50,000 Active 378 DOM
-
2026-05-31days on market $50,000 Active 377 DOM
-
2026-05-30days on market $50,000 Active 376 DOM
-
2026-05-05price $50,000 135-char remark
Show marketing remark (135 chars)
- Centrally located - Well kept park - Corner lot - Shaded parking - Fully landscaped - Deck with privacy screen - Shed -Move in ready
-
2026-03-05price $75,000 135-char remark
Show marketing remark (135 chars)
- Centrally located - Well kept park - Corner lot - Shaded parking - Fully landscaped - Deck with privacy screen - Shed -Move in ready
-
2025-09-23price $77,500 135-char remark
Show marketing remark (135 chars)
- Centrally located - Well kept park - Corner lot - Shaded parking - Fully landscaped - Deck with privacy screen - Shed -Move in ready
-
2025-08-01price $85,000 135-char remark
Show marketing remark (135 chars)
- Centrally located - Well kept park - Corner lot - Shaded parking - Fully landscaped - Deck with privacy screen - Shed -Move in ready
-
2025-06-24price $95,000 135-char remark
Show marketing remark (135 chars)
- Centrally located - Well kept park - Corner lot - Shaded parking - Fully landscaped - Deck with privacy screen - Shed -Move in ready
-
2025-06-02price $99,000 135-char remark
Show marketing remark (135 chars)
- Centrally located - Well kept park - Corner lot - Shaded parking - Fully landscaped - Deck with privacy screen - Shed -Move in ready
-
2025-05-20$105,000 Active 135-char remark
Show marketing remark (135 chars)
- Centrally located - Well kept park - Corner lot - Shaded parking - Fully landscaped - Deck with privacy screen - Shed -Move in ready
ⓘ Source: listings_history table (triggers on properties + properties_extension) + one-shot
backfill from property_details.listing_events for pre-trigger history.
Climate risk First Street
- Flood 4/10 Moderate FEMA zone X (shaded) · 23% chance over 30 yrs
- Wildfire 7/10 Severe
- Heat 6/10 Major 8 d/yr ≥100°F today · 20 d/yr by 30 yrs out
- Wind 1/10 Low
- Air quality 1/10 Low 0 unhealthy d/yr today · 0 by 30 yrs out
Nearby sold comps map
Loading sold comps map…
Walkable amenities ~0.75 mi
Loading nearby amenities…
Taxation est. · year 1
- Rental income
- $18,533
- − Mortgage interest
- −$2,801
- − Property taxes
- −$750
- − Insurance
- −$250
- − Repairs & maintenance
- −$1,483
- − Management
- −$1,483
- − Depreciation
- −$1,455
- Taxable income
- $10,313
- Est. tax owed @ 24.0%
- −$2,475
- After-tax cash flow
- $8,020/yr
For passive investors: Depreciation is non-cash, so a rental often shows a tax loss while cash-flowing — sheltering income. Rental losses are passive: they offset passive income freely, and up to $25,000/yr can offset ordinary (W-2) income if you actively participate and your MAGI is under $100k (phasing out to $0 by $150k); unused losses carry forward. On sale, claimed depreciation is recaptured at up to 25%, and gains may owe capital-gains tax (a 1031 exchange can defer both). Figures are a year-1 estimate at your 24.0% rate — not tax advice; consult a CPA.
Condition & rehab AI · 13 photos
This manufactured home is in average condition with cosmetic updates needed to enhance its resale and rental value.
Repairs flagged
- Minor kitchen cabinets — dated and could be replaced
- Minor bathroom fixtures — dated and could be updated
Value-add opportunities
- Both paint exterior — enhances curb appeal and value
- Both replace carpet — improves comfort and value
- Both update kitchen cabinets — modernizes and increases value
- Both update bathroom fixtures — modernizes and increases value
Renovation cost estimate screening
| Repair item | Severity | Est. cost |
|---|---|---|
| kitchen cabinets · dated and could be replaced | Minor | $500–3,000 |
| bathroom fixtures · dated and could be updated | Minor | $500–3,000 |
| Total estimated repair cost · 2 items | $1,000–6,000 |
Value-add ROI direction
- Both paint exterior — enhances curb appeal and value ↑
- Both replace carpet — improves comfort and value ↑
- Both update kitchen cabinets — modernizes and increases value ↑
- Both update bathroom fixtures — modernizes and increases value ↑
ⓘ Cost ranges are severity-bucket heuristics (US national rule-of-thumb). Get contractor quotes + a written scope before underwriting a rehab budget.
Schools (NCES district)
- District
- Kingman Unified School District (79598)
- NCES district ID
- 0400295
- Math proficiency
- 19% ▼ -11.00%
- Reading proficiency
- 24% ▼ -9.00%
- Median HH income
- $36,760
- Composite
- 17.87/100
- National rank
- #9002
- State rank
- #179 of 249 in AZ
Livability — Kingman
- Score
- 79/100
- State rank
- #5
- US rank
- #2014
Category grades
Schools grade is shown separately in the Schools card above.
Census & demographics
- Census place
- Kingman, AZ
- County
- Mohave County · 181,906 people
- City population
- 60,489
- Metro
- Lake Havasu City-Kingman, AZ
- Population (ZIP)
- 30,365
- Household income
- $50,852
- Rent vs Own
- Severe rent burden
- 688.0
Population outlook (Mohave County) Hauer SSP2
- Today (2025)
- 209,184 people
- By 2030
- 209,674 · +0.2%
- By 2040
- 205,897 · -1.6%
- By 2050
- 196,810 · -5.9%
- By 2075
- 169,454 · -19.0%
- By 2100
- 136,630 · -34.7%
Race, ethnicity, and origin ACS 2023
- Neighborhood character
- Predominantly White (76%)
- Race & ethnicity
- White 76% Hispanic / Latino 16% Two or more races 10% Native American 1%
- Hispanic origin (detail)
- Mexican 12%
- Common ancestry
- Lithuanian 3% Slovak 2% Portuguese 2%
- Foreign-born
- 6% · Canada
- Languages at home
- 92% English-only · Spanish 7%
Political lean MEDSL · Mohave
- 2024 margin
- Solid R (+55.8) · D 21.8% · R 77.6%
- 2008→2024 swing
- -22.9pp toward R · 2008: -32.9pp · 2024: -55.8pp
- All cycles
- 2024: R+55.8 2020: R+51.3 2016: R+51.5 2012: R+42.6 2008: R+32.9
Not yet ingested
- Civics
- —
Market trends
- HPI YoY
- ▼ -158.90%
- Current HPI
- 280.1884
- Rent YoY
- ▲ 0.33%
- Metro
- Lake Havasu City-Kingman, AZ
- State GDP YoY
- ▲ 4.54%
- F500 in state
- 20
Industry mix (Fortune 500 HQ in AZ)
| Industry | F500 HQs | Revenue |
|---|---|---|
| Technology | 2 | $13B |
|
||
| Mining / Metals | 1 | $23B |
|
||
| Environmental Services | 1 | $16B |
|
||
| Metals / Steel | 1 | $14B |
|
||
| Technology Distribution | 1 | $9B |
|
||
| Homebuilding | 1 | $8B |
|
||
Price history
-52.4% since first listed7 events — show timeline
- 2026-05-05 Price Changed $50,000 WARDEX
- 2026-03-05 Price Changed $75,000 WARDEX
- 2025-09-23 Price Changed $77,500 WARDEX
- 2025-08-01 Price Changed $85,000 WARDEX
- 2025-06-24 Price Changed $95,000 WARDEX
- 2025-06-02 Price Changed $99,000 WARDEX
- 2025-05-20 Listed $105,000 WARDEX
Cash-flow waterfall
monthlySold comps — $/sqft
last 12 mo · ≤1 miLoading sold comps…