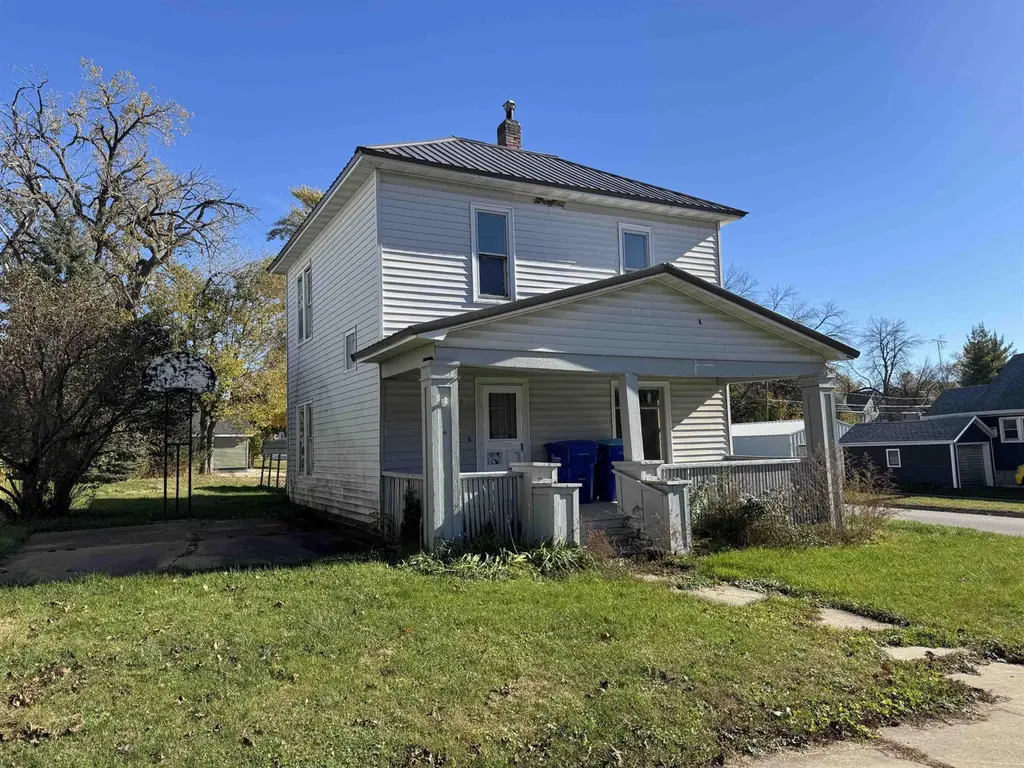
229 SE 4th Ave · Oelwein, IA
Flood risk 1/10 · Minimal
- FEMA flood zone
- X (unshaded)
- Chance of flooding over 30 yrs
- 0.0%
- Est. flood insurance / yr
- $473 – $860
Fire risk 4/10 · Minor
- Est. fire insurance / yr
- $902 – $1,676
Heat risk 2/10 · Minimal
- Hot days now (above 100°F)
- 7 days/yr
- Hot days in 30 yrs
- 15 days/yr
Wind risk 2/10 · Minimal
- Chance of severe wind over 30 yrs
- —
Air-quality risk 1/10 · Minimal
- Unhealthy air days now
- 0 days/yr
- Unhealthy air days in 30 yrs
- 0 days/yr
Risk factors via First Street. Map © Google.
Why this score? — see what drove the B grade
The composite is a weighted blend of 9 inputs, each scored 0–100. Each bar is that input's sub-score; the figure is the points it added to the 100-point composite (weight × sub-score).
- Cash flow +30.0/30.0
- 1% rule +10.0/10.0
- DSCR +10.0/10.0
- ARV discount +7.5/15.0
- Schools +4.3/10.0
- Livability +3.8/5.0
- Rent growth +2.5/5.0
- Condition / age +2.5/5.0
- Appreciation +0.0/10.0
$41,900
🖨 Deal sheet 📄 Offer letter ✓ Due diligence
Listing remarks
3 bedroom 1 1/2 bath, 1 stall garage. Great starter home or investment property. Selling AS IS. Square footages approximate. Call your favorite local agent for your personal showing today.
Key facts
- 6,500 sq ft lot
- Built 1910
- Listed 41 days
Property features AI
Finance
- Other: Annual tax amount listed ($748)
Exterior
- Parking: Carport
- Utilities: Public water; Public sewer
- Home design: Single-family residence; Residential property
- Construction: Vinyl siding construction; Asphalt roof
- Exterior features: Asphalt roof; Vinyl siding; Lot dimensions approximately 50 x 130; Lot about 0.15 acre; Road surface: Other; Zoned R-1
Interior
- Bathrooms: 1 full bathroom; 1 half bathroom
- Heating & cooling: Forced-air heating (natural gas); No cooling
- Interior features: Unfinished basement
Neighborhood map
What this means for you Summary
Snapshot
- This is a 3-bed/1.5-bath single-family listed at $42k.
Deal economics
- At list price, monthly cash flow is $300 ($4k/yr) — positive.
- The deal already cash-flows at list — no discount required.
- Meets the 1% rule at list price ($759 rent vs $42k).
- Recommended offer: $41k (3.0% below list) — sets the bar for market timing.
- Cap rate 14.9% vs local median 4.5% in Oelwein — top-decile yield for the area; either an underpriced asset or a hidden risk that comps aren't pricing in. Stress-test before assuming the spread holds.
Location & tenants
- Location reads 76/100 on livability (#186 in IA, #3,329 nationally) — a middle-class / working-renter tenant base. Strengths: cost of living A+, housing A+, health & safety A+; Watch: employment D, amenities F, commute F.
- Oelwein Community School District (town): math 47% / reading 55% proficiency, ranked #281 of 289 in IA (top 97%) — acceptable for families but not a draw, mixed tenant base, ~2y average lease.
- Zoned schools: Oelwein Middle School (math 44% / reading 54%, grade C-, #219 of 246 statewide, top 90%, 359 students, 60% FRL); Oelwein High School (math 46% / reading 62%, grade C-, #293 of 336 statewide, top 87%, 314 students, 46% FRL) — zoned schools at 53% FRL track the district average.
- Market conditions: 60 active listings in the ZIP; 2 comparable units currently listed for rent nearby; 8 units permitted in Fayette County in 2024 (0 in 5+ unit buildings).
Forward outlook
- Local home prices are declining (-3.0%/yr); year-one equity from $290 of loan paydown is wiped out by about $1k of value loss. Plan a longer hold.
- Fayette County population projected at -15% by 2050 — secular population decline; favor cash flow + early exit over multi-decade hold.
- At projected returns (-3.0% appreciation + 3.0% rent growth), your $12k cash investment doubles in ~4 years — after that, you're playing with house money.
Negotiation context
- It's been on market 41 days — a 3% lower offer ($41k) is reasonable based on typical stale-listing flexibility.
Risks & watch-outs
- Watch-outs: built in 1910 — expect roof / HVAC / electrical / plumbing capex.
Questions for the listing agent
- It's been on market 41 days. Have you received any prior offers? Is the seller open to a 3% concession, seller financing, or rate buy-down credit?
- Built in 1910 — when were the roof, HVAC, electrical panel, plumbing, and water heater last replaced?
- Is there a deadline driving the sale (1031 exchange, divorce, estate, relocation)? That informs how much negotiation room exists.
- What's the average days-on-market for RENTAL listings here right now (not sales)? A rising rental-DOM trend means longer vacancies and softer asking-rent achievability than the comps imply.
- What's the recent tenant-quality profile in this submarket — average credit score on applications, eviction rate, late-payment / NSF rate, and stable-employment percentage? A property-management company in the area should have these aggregated.
- How much new for-sale + rental construction is in the pipeline within 1–3 miles? Heavy new supply typically softens prices + rents 12–24 months out; constrained supply supports both.
Investment metrics
- 1% rule
- 1.81% ✓
- Cap rate
- 14.89%
- Cash-on-cash
- 30.70%
- DSCR
- 2.37
- GRM
- 4.6
CMA / ARV
- ARV (median comp)
- $86,660
- List price
- $41,900
- Delta
- -51.65%
- Verdict
- UNDERPRICED
- Comps
- 20 within 1.0 mi
Show comp detail 12 sales within ~0.75 mi
| Address | Dist | Beds/Ba | Sqft | Sold | Price | $/sf | Match |
|---|---|---|---|---|---|---|---|
| 309 3rd Ave Ave SE | 0.08mi | 3/2.0 | 1,399 (+4%) | 2mo | $120,000 | $86 | 86 |
| 309 SE 3rd Ave | 0.08mi | 3/2.5 | 1,400 (+4%) | 2mo | $120,000 | $86 | 83 |
| 513 SE 3rd Ave | 0.24mi | 2/1.0 (-1) | 1,324 (-2%) | 0mo | $68,000 | $51 | 79 |
| 33 5th Ave Ave SE | 0.23mi | 3/1.5 | 1,409 (+5%) | 7mo | $75,000 | $53 | 76 |
| 300 SE 6th Ave | 0.11mi | 2/1.0 (-1) | 1,286 (-4%) | 7mo | $97,900 | $76 | 75 |
| 413 4th Ave Ave NE | 0.67mi | 3/1.0 | 1,306 (-3%) | 2mo | $175,000 | $134 | 60 |
| 534 SE 4th Ave | 0.29mi | 3/1.5 | 1,152 (-14%) | 6mo | $91,000 | $79 | 57 |
| 205 NE 4th Ave | 0.50mi | 3/1.0 | 1,192 (-11%) | 0mo | $59,900 | $50 | 55 |
| 24 12th Ave Ave SE | 0.55mi | 3/2.0 | 1,220 (-9%) | 2mo | $149,000 | $122 | 55 |
| 1213 Elm Street St | 0.63mi | 3/2.0 | 1,220 (-9%) | 2mo | $195,000 | $160 | 51 |
| 23 4th St NW | 0.72mi | 4/1.5 (+1) | 1,234 (-8%) | 7mo | $98,000 | $79 | 42 |
| 1204 1st St St NE | 0.69mi | 3/2.0 | 1,144 (-15%) | 6mo | $165,000 | $144 | 36 |
Match score weights: distance 35% · size 25% · config 20% · recency 20%. Top-matched comps best support the ARV.
Projected returns pro-forma
-3.0% appreciation · 3.0% rent growth · sell at horizon
- IRR
- 25.4%
- Equity multiple
- 2.05×
- Total profit
- $12,346
- Equity at exit
- $6,247
- IRR
- 33.2%
- Equity multiple
- 4.02×
- Total profit
- $35,439
- Equity at exit
- $3,623
Cash invested: $11,732 (down + closing). Projections, not guarantees.
Landlord ↔ Tenant lean methodology
- Overall (STATE)
- 83 Strongly Landlord-Friendly
- State Iowa
- 83 Strongly Landlord-Friendly · R+6
- County
- — inherits STATE
- City
- — inherits STATE
ZIP-level market 50662
- Home prices YoY
- -21.7%
- Active inventory
- 60
- Price-to-rent
- 4.6×
Monthly cashflow live
- Estimated rent
- $759 medium interval (Pro) →
- Mortgage (P&I)
- −$220
- Tax from tax record
- −$62 /mo · $748/yr
- Insurance
- −$17
- HOA
- −$0
- Vacancy / Maint / Mgmt
- −$159
- Net cashflow
- $300
Break-even live
UW: 25.0% down · 7.5% · 30yr · 1.5% tax · 5.0% vac · 8.0% maint · 8.0% mgmt
Financing live
Cash to close
- Down payment
- $10,475
- Closing costs
- $1,257
- Reserves months
- —
- Total cash needed
- —
Loan-product check · same deal, 3 products live
Conventional
25% down · 7.5% · 30yr
- Down + closing
- —
- Monthly P&I
- —
- Monthly cashflow
- —
- DSCR
- —
- Eligible?
- —
Personal DTI + credit; lowest rate.
DSCR
20% down · 8.5% · 30yr
- Down + closing
- —
- Monthly P&I
- —
- Monthly cashflow
- —
- DSCR
- —
- Eligible?
- —
No personal income docs; deal must DSCR.
Hard money
10% down · 12.0% · 12mo
- Down + closing
- —
- Monthly P&I
- —
- Monthly cashflow
- —
- DSCR
- —
- Eligible?
- —
Short-term bridge; refi at stabilization.
Rent comps 2 comps
| Address | Beds | Baths | Sqft | Rent | $/sqft | DOM | Units | Dist |
|---|---|---|---|---|---|---|---|---|
| 9 N Frederick Ave Apt 1 Oelwein, IA | 2.0 | 1.0 | 1125 | $650 | $0.58 | 43d | 1 | 0.43mi |
| 1297 S Frederick Ave Unit 3 Oelwein, IA | 3.0 | 1.0 | 1500 | $1,000 | $0.67 | 20d | 1 | 1.01mi |
Listing history 19 events
-
2026-06-18days on market $41,900 Active 41 DOM
-
2026-06-17days on market $41,900 Active 40 DOM
-
2026-06-16days on market $41,900 Active 39 DOM
-
2026-06-15days on market $41,900 Active 38 DOM
-
2026-06-13days on market $41,900 Active 36 DOM
-
2026-06-12days on market $41,900 Active 35 DOM
-
2026-06-09days on market $41,900 Active 32 DOM
-
2026-06-08days on market $41,900 Active 31 DOM
-
2026-06-07days on market $41,900 Active 30 DOM
-
2026-06-07days on market $41,900 Active 29 DOM
-
2026-06-04days on market $41,900 Active 26 DOM
-
2026-06-02days on market $41,900 Active 25 DOM
-
2026-06-01days on market $41,900 Active 24 DOM
-
2026-05-31days on market $41,900 Active 23 DOM
-
2026-05-31days on market $41,900 Active 22 DOM
-
2026-05-08$41,900 Active 189-char remark
-
2026-01-31price $41,900
-
2025-12-25price $45,900
-
2024-03-15price $53,000
ⓘ Source: listings_history table (triggers on properties + properties_extension) + one-shot
backfill from property_details.listing_events for pre-trigger history.
Tax reassessment forecast IA · Partial reset (capped growth)
- Current annual tax
- $748 · $62/mo
- Projected year-2 tax
- $748 · $62/mo
- Expected delta
- $0/yr ($0/mo · 0.0%)
ⓘ Screening estimate from a state-policy table — verify with the county assessor before closing.
Climate risk First Street
- Flood 1/10 Low FEMA zone X (unshaded) · 0% chance over 30 yrs
- Wildfire 4/10 Moderate
- Heat 2/10 Low 7 d/yr ≥100°F today · 15 d/yr by 30 yrs out
- Wind 2/10 Low
- Air quality 1/10 Low 0 unhealthy d/yr today · 0 by 30 yrs out
Nearby sold comps map
Loading sold comps map…
Walkable amenities ~0.75 mi
Loading nearby amenities…
Taxation est. · year 1
- Rental income
- $9,109
- − Mortgage interest
- −$2,347
- − Property taxes
- −$748
- − Insurance
- −$210
- − Repairs & maintenance
- −$729
- − Management
- −$729
- − Depreciation
- −$1,219
- Taxable income
- $3,128
- Est. tax owed @ 24.0%
- −$751
- After-tax cash flow
- $2,851/yr
For passive investors: Depreciation is non-cash, so a rental often shows a tax loss while cash-flowing — sheltering income. Rental losses are passive: they offset passive income freely, and up to $25,000/yr can offset ordinary (W-2) income if you actively participate and your MAGI is under $100k (phasing out to $0 by $150k); unused losses carry forward. On sale, claimed depreciation is recaptured at up to 25%, and gains may owe capital-gains tax (a 1031 exchange can defer both). Figures are a year-1 estimate at your 24.0% rate — not tax advice; consult a CPA.
Schools (NCES district)
- District
- Oelwein Community School District
- NCES district ID
- 1921630
- Math proficiency
- 47% ▼ -5.00%
- Reading proficiency
- 55% ▲ 5.00%
- Median HH income
- $39,812
- Composite
- 42.61/100
- National rank
- #3189
- State rank
- #281 of 289 in IA
Livability — Oelwein
- Score
- 76/100
- State rank
- #186
- US rank
- #3329
Category grades
Schools grade is shown separately in the Schools card above.
Census & demographics
- Census place
- Oelwein, IA
- Population (ZIP)
- 6,497
Population outlook (Fayette County) Hauer SSP2
- Today (2025)
- 19,299 people
- By 2030
- 18,701 · -3.1%
- By 2040
- 17,469 · -9.5%
- By 2050
- 16,389 · -15.1%
- By 2075
- 15,156 · -21.5%
- By 2100
- 14,214 · -26.3%
Race, ethnicity, and origin ACS 2023
- Neighborhood character
- Predominantly White (90%)
- Race & ethnicity
- White 90% Two or more races 5% Hispanic / Latino 3% Native American 1%
- Common ancestry
- Italian 3% Portuguese 3% Lithuanian 2%
- Foreign-born
- 0%
- Languages at home
- 99% English-only · Spanish 1%
Political lean MEDSL · Fayette
- 2024 margin
- Solid R (+30.5) · D 34.0% · R 64.4% · Other 1.6%
- 2008→2024 swing
- -47.1pp toward R · 2008: 16.6pp · 2024: -30.5pp
- All cycles
- 2024: R+30.5 2020: R+22.7 2016: R+19.6 2012: D+11.9 2008: D+16.6
Not yet ingested
- Civics
- —
Market trends
- HPI YoY
- ▼ -49.26%
- Current HPI
- 177.9399
- Rent YoY
- —
- Metro
- —
- State GDP YoY
- ▲ 2.48%
- F500 in state
- 4
Industry mix (Fortune 500 HQ in IA)
| Industry | F500 HQs | Revenue |
|---|---|---|
| Financial Services | 1 | $16B |
|
||
| Retail / Convenience | 1 | $15B |
|
||
Price history
-20.9% since first listed4 events — show timeline
- 2026-05-08 Listed $41,900 NEIRBR as distributed by MLS GRID
- 2026-01-31 Price Changed $41,900 NEIRBR as distributed by MLS GRID
- 2025-12-25 Price Changed $45,900 NEIRBR as distributed by MLS GRID
- 2024-03-15 Price Changed $53,000 NEIRBR as distributed by MLS GRID
Property tax history
+7.8%/yrLatest (2025): $748 · +2.2% YoY. Source: county tax records.
Cash-flow waterfall
monthlySold comps — $/sqft
last 12 mo · ≤1 miLoading sold comps…