 Triplex
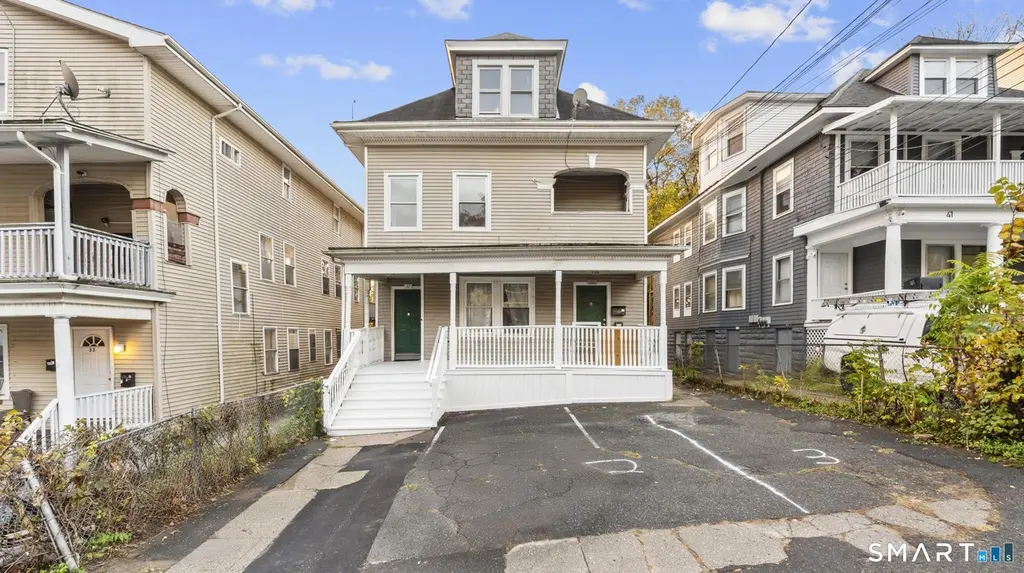
37 Plaza Ave · Waterbury, CT
Flood risk 1/10 · Minimal
- FEMA flood zone
- X (unshaded)
- Chance of flooding over 30 yrs
- 0.0%
- Est. flood insurance / yr
- $473 – $860
Fire risk 1/10 · Minimal
- Est. fire insurance / yr
- $829 – $1,539
Heat risk 5/10 · Moderate
- Hot days now (above 96°F)
- 7 days/yr
- Hot days in 30 yrs
- 15 days/yr
Wind risk 6/10 · Moderate
- Chance of severe wind over 30 yrs
- 27.0%
Air-quality risk 3/10 · Minor
- Unhealthy air days now
- 2 days/yr
- Unhealthy air days in 30 yrs
- 3 days/yr
Risk factors via First Street. Map © Google.
Why this score? — see what drove the C grade
The composite is a weighted blend of 9 inputs, each scored 0–100. Each bar is that input's sub-score; the figure is the points it added to the 100-point composite (weight × sub-score).
- Cash flow +30.0/30.0
- DSCR +10.0/10.0
- 1% rule +7.9/10.0
- Livability +4.0/5.0
- Condition / age +2.5/5.0
- Rent growth +2.4/5.0
- Schools +1.5/10.0
- ARV discount +0.0/15.0
- Appreciation +0.0/10.0
$429,900
🖨 Deal sheet 📄 Offer letter ✓ Due diligence
Multi-family units
County records classify this as Multi-Family (2-4 Unit). Listing-text estimate: 3 units. confirmed
Listing remarks
Owner-Occupants and Investors Take Notice! Excellent opportunity in the desirable Hillside neighborhood. This three-family property offers strong cash flow potential with two 3/4-bedroom, 1-bath units and one 2-bedroom, 1-bath unit. All utilities are separate and tenant-paid, including gas heat and hot water. Electrical has been updated to circuit breakers and is also tenant-paid. Exterior features include vinyl siding, replacement windows, and off-street parking for three vehicles. Great value-add opportunity for investors or owner-occupants looking to build equity and generate rental income. 8.5+% CAP at full occupancy.
Key facts
- Separate utilities
- Vinyl siding
- Off-street parking
Tags
Property features AI
Exterior
- Parking: Paved off-street parking; 3 parking spaces
- Utilities: Public water connected; Public sewer connected
- Home design: Multi-family property (3-family)
- Construction: Frame construction; Vinyl siding; Masonry and stone foundation; Asphalt shingle roof; Tan exterior color
- Exterior features: Sidewalk; Porch; Gutters; Exterior lighting; Level lot
Interior
- Bedrooms: 10 total bedrooms
- Bathrooms: 3 full bathrooms
- Heating & cooling: Hot air heating; Natural gas hot water; Natural gas heat fuel
- Interior features: 16 total rooms; Full unfinished basement; Window air conditioning units
Neighborhood map
What this means for you Summary
Snapshot
- This is a 3 × 3-bed/?-bath units multifamily listed at $430k.
Deal economics
- At list price, monthly cash flow is $2k ($19k/yr) — positive. Per door: $539/mo.
- The deal already cash-flows at list — no discount required.
- Meets the 1% rule at list price ($6k rent vs $430k).
- Recommended offer: $417k (3.0% below list) — sets the bar for market timing.
- Cap rate 10.8% vs local median 3.6% in Waterbury — top-decile yield for the area; either an underpriced asset or a hidden risk that comps aren't pricing in. Stress-test before assuming the spread holds.
Location & tenants
- Location reads 79/100 on livability (#32 in CT, #2,205 nationally) — a middle-class / working-renter tenant base. Strengths: commute A+, cost of living A+, housing A+; Watch: schools D+, crime D, employment D.
- Waterbury School District (suburban): math 12% / reading 23% proficiency, ranked #148 of 153 in CT (top 97%) — low school quality limits family demand, transient renter base, plan for 1-2y turnover; 73% free/reduced lunch — lower-income household profile, screen leases tightly.
- Market conditions: Rents soft (-0.4%/yr); 32 active listings in the ZIP; 1 comparable units currently listed for rent nearby; lower-income renter base — watch delinquency; 502 units permitted in Naugatuck Valley Planning Region in 2024 (171 in 5+ unit buildings).
- At $5,543/mo this rent would consume 179% of the median local household income ($37k/yr) (locally 856% of renters already pay >50% of income on rent) — very limited rent-growth headroom before tenants either downsize or default.
Forward outlook
- Local home prices are declining (-3.0%/yr); year-one equity from $3k of loan paydown is wiped out by about $13k of value loss. Plan a longer hold.
Negotiation context
- It's been on market 35 days — a 3% lower offer ($417k) is reasonable based on typical stale-listing flexibility.
- 9 sale attempts since 21y ago; this cycle's ask is 23% above the opening price — seller raised mid-cycle; expect resistance to lowballs.
- Current owner paid $18k; list at $430k implies a 2275% gain — meaningful room to come down on a strong offer.
Risks & watch-outs
- Watch-outs: built in 1907 — expect roof / HVAC / electrical / plumbing capex.
- Climate carrying-cost: major wind risk, 27% chance of damaging wind over 30y; extreme-heat days projected 7→15/yr by 2055 (HVAC capex compounding) — expect insurance premiums to compound above CPI over the hold.
Questions for the listing agent
- It's been on market 35 days. Have you received any prior offers? Is the seller open to a 3% concession, seller financing, or rate buy-down credit?
- Can we see the unit-by-unit rent roll, current vacancy, and any below-market leases? What's the average tenancy length?
- What capital expenditures (roof, boiler, parking lot, exteriors) have been made in the last 5 years, and what's planned in the next 2?
- Built in 1907 — when were the roof, HVAC, electrical panel, plumbing, and water heater last replaced?
- Is there a deadline driving the sale (1031 exchange, divorce, estate, relocation)? That informs how much negotiation room exists.
- Schools are D-rated, which usually means shorter tenancies and higher turnover. Who's the typical renter profile here, and what's been the actual vacancy rate?
- Crime grade is D in this area — have there been break-ins, vandalism, or insurance claims at this property in the last 3 years? What carrier currently insures it and at what premium?
- What's the average days-on-market for RENTAL listings here right now (not sales)? A rising rental-DOM trend means longer vacancies and softer asking-rent achievability than the comps imply.
- What's the recent tenant-quality profile in this submarket — average credit score on applications, eviction rate, late-payment / NSF rate, and stable-employment percentage? A property-management company in the area should have these aggregated.
- How much new apartment / multifamily construction is in the pipeline within 1–3 miles? Heavy new supply (>2% of stock underway) typically softens rents 12–24 months out; light construction supports rent growth.
Investment metrics
- 1% rule
- 1.29% ✓
- Cap rate
- 10.81%
- Cash-on-cash
- 16.13%
- DSCR
- 1.72
- GRM
- 6.5
CMA / ARV
- ARV (median comp)
- $343,468
- List price
- $429,900
- Delta
- 25.16%
- Verdict
- OVERPRICED
- Comps
- 20 within 1.0 mi
Show comp detail 12 sales within ~0.75 mi
| Address | Dist | Beds/Ba | Sqft | Sold | Price | $/sf | Match |
|---|---|---|---|---|---|---|---|
| 16 Plaza Ave | 0.04mi | 8/3.0 | 3,178 (-7%) | 1mo | $455,000 | $143 | 86 |
| 16 Arch St | 0.14mi | 9/3.0 (+1) | 3,282 (-4%) | 2mo | $495,000 | $151 | 80 |
| 50 Elmwood Ave | 0.11mi | 8/3.0 | 3,563 (+5%) | 10mo | $170,000 | $48 | 78 |
| 70 Elmwood Ave | 0.15mi | 8/3.0 | 3,175 (-7%) | 10mo | $452,000 | $142 | 74 |
| 35 Frederick St | 0.25mi | 8/3.0 | 3,088 (-9%) | 3mo | $255,000 | $83 | 70 |
| 156 Waterville St | 0.17mi | 8/3.0 | 3,732 (+10%) | 11mo | $540,000 | $145 | 67 |
| 50 Manhan St | 0.29mi | 8/3.0 | 3,100 (-9%) | 10mo | $400,000 | $129 | 63 |
| 127 Pearl St | 0.59mi | 9/3.0 (+1) | 3,636 (+7%) | 4mo | $397,800 | $109 | 53 |
| 6 Grove Ct | 0.51mi | 9/5.0 (+1) | 3,454 (+2%) | 12mo | $410,000 | $119 | 51 |
| 53 Hillside Ave | 0.52mi | 8/3.0 | 2,952 (-13%) | 5mo | $279,900 | $95 | 50 |
| 10 Pearl St | 0.73mi | 9/— (+1) | 3,211 (-6%) | 11mo | $380,000 | $118 | 43 |
| 32 Hawkins St | 0.74mi | 8/3.0 | 3,114 (-8%) | 12mo | $379,000 | $122 | 42 |
Match score weights: distance 35% · size 25% · config 20% · recency 20%. Top-matched comps best support the ARV.
Projected returns pro-forma
-3.0% appreciation · 0.0% rent growth · sell at horizon
- IRR
- 3.8%
- Equity multiple
- 1.14×
- Total profit
- $17,093
- Equity at exit
- $64,099
- IRR
- 10.4%
- Equity multiple
- 1.70×
- Total profit
- $84,609
- Equity at exit
- $37,170
Cash invested: $120,372 (down + closing). Projections, not guarantees.
Landlord ↔ Tenant lean methodology
- Overall (STATE)
- 27 Tenant-Leaning
- State Connecticut
- 27 Tenant-Leaning · D+7
- County
- — inherits STATE
- City
- — inherits STATE
ZIP-level market 06710
- Home prices YoY
- -8.1%
- Rents YoY
- -0.4%
- Active inventory
- 32
- Price-to-rent
- 19.4×
Monthly cashflow live
- Estimated rent
- $5,543 high interval (Pro) →
- Mortgage (P&I)
- −$2,254
- Tax from tax record
- −$328 /mo · $3,930/yr
- Insurance
- −$179
- HOA
- −$0
- Vacancy / Maint / Mgmt
- −$1,164
- Net cashflow
- $1,618
Break-even live
3-unit breakdown (identical units grouped — click to expand)
| Units | Beds | Baths | Est. rent |
|---|---|---|---|
| 3× units | 3 | — | $5,544 |
| #1 | 3 | — | $1,848 |
| #2 | 3 | — | $1,848 |
| #3 | 3 | — | $1,848 |
| Total (3 units) | $5,543 | ||
UW: 25.0% down · 7.5% · 30yr · 1.5% tax · 5.0% vac · 8.0% maint · 8.0% mgmt
Financing live
Cash to close
- Down payment
- $107,475
- Closing costs
- $12,897
- Reserves months
- —
- Total cash needed
- —
Loan-product check · same deal, 3 products live
Conventional
25% down · 7.5% · 30yr
- Down + closing
- —
- Monthly P&I
- —
- Monthly cashflow
- —
- DSCR
- —
- Eligible?
- —
Personal DTI + credit; lowest rate.
DSCR
20% down · 8.5% · 30yr
- Down + closing
- —
- Monthly P&I
- —
- Monthly cashflow
- —
- DSCR
- —
- Eligible?
- —
No personal income docs; deal must DSCR.
Hard money
10% down · 12.0% · 12mo
- Down + closing
- —
- Monthly P&I
- —
- Monthly cashflow
- —
- DSCR
- —
- Eligible?
- —
Short-term bridge; refi at stabilization.
Rent comps 1 comps
| Address | Beds | Baths | Sqft | Rent | $/sqft | DOM | Units | Dist |
|---|---|---|---|---|---|---|---|---|
| 20 Coe St Waterbury, CT | 9.0 | 3.0 | 3240 | $1,800 | $0.56 | 3d | 1 | 1.12mi |
Listing history 38 events
-
2026-06-18days on market $429,900 Active 35 DOM
-
2026-06-17days on market $429,900 Active 34 DOM
-
2026-06-16days on market $429,900 Active 33 DOM
-
2026-06-15days on market $429,900 Active 32 DOM
-
2026-06-14days on market $429,900 Active 30 DOM
-
2026-06-13days on market $429,900 Active 29 DOM
-
2026-06-10days on market $429,900 Active 27 DOM
-
2026-06-09days on market $429,900 Active 26 DOM
-
2026-06-08days on market $429,900 Active 25 DOM
-
2026-06-07days on market $429,900 Active 24 DOM
-
2026-06-05pricedays on market $429,900 Active 21 DOM
-
2026-06-03days on market $449,900 Active 20 DOM
-
2026-06-03days on market $449,900 Active 19 DOM
-
2026-06-01days on market $449,900 Active 18 DOM
-
2026-05-31days on market $449,900 Active 17 DOM
-
2026-05-15price $449,900 629-char remark
-
2026-05-14$349,900 Active 629-char remark
-
2026-04-10historical
-
2026-03-06status Under Contract
-
2026-02-09historical Under Contract - Continue to Show
-
2026-02-09status Under Contract
-
2026-02-09status Active
-
2026-02-08historical
-
2026-01-14price $399,900
-
2026-01-02$419,900 Active
-
2026-01-01historical
-
2025-12-17price $425,000
-
2025-12-02price $449,900
-
2025-10-31$459,900 Active
-
2021-01-09historical
-
2021-01-01$130,000 Active
-
2012-07-26soldstatus $18,100
-
2012-06-08$15,000
-
2011-05-10historical
-
2010-05-10$110,900
-
2006-03-08soldstatus $215,000
-
2006-01-20soldstatus $215,000
-
2005-08-19$219,900
ⓘ Source: listings_history table (triggers on properties + properties_extension) + one-shot
backfill from property_details.listing_events for pre-trigger history.
Tax reassessment forecast CT · Partial reset (capped growth)
- Current annual tax
- $3,930 · $328/mo
- Projected year-2 tax
- $6,565 · $547/mo
- Expected delta
- +$2,635/yr (+$220/mo · 67.0%)
ⓘ Screening estimate from a state-policy table — verify with the county assessor before closing.
Climate risk First Street
- Flood 1/10 Low FEMA zone X (unshaded) · 0% chance over 30 yrs
- Wildfire 1/10 Low
- Heat 5/10 Major 7 d/yr ≥96°F today · 15 d/yr by 30 yrs out
- Wind 6/10 Major 27% chance of damaging wind over 30 yrs
- Air quality 3/10 Moderate 2 unhealthy d/yr today · 3 by 30 yrs out
Nearby sold comps map
Loading sold comps map…
Walkable amenities ~0.75 mi
Loading nearby amenities…
Taxation est. · year 1
- Rental income
- $66,516
- − Mortgage interest
- −$24,081
- − Property taxes
- −$3,930
- − Insurance
- −$2,150
- − Repairs & maintenance
- −$5,321
- − Management
- −$5,321
- − Depreciation
- −$12,506
- Taxable income
- $13,207
- Est. tax owed @ 24.0%
- −$3,170
- After-tax cash flow
- $16,245/yr
For passive investors: Depreciation is non-cash, so a rental often shows a tax loss while cash-flowing — sheltering income. Rental losses are passive: they offset passive income freely, and up to $25,000/yr can offset ordinary (W-2) income if you actively participate and your MAGI is under $100k (phasing out to $0 by $150k); unused losses carry forward. On sale, claimed depreciation is recaptured at up to 25%, and gains may owe capital-gains tax (a 1031 exchange can defer both). Figures are a year-1 estimate at your 24.0% rate — not tax advice; consult a CPA.
Schools (NCES district)
- District
- Waterbury School District
- NCES district ID
- 0904830
- Math proficiency
- 12% ▼ -7.00%
- Reading proficiency
- 23% ▼ -8.00%
- Median HH income
- $40,040
- Composite
- 14.85/100
- National rank
- #9380
- State rank
- #148 of 153 in CT
Livability — Waterbury
- Score
- 79/100
- State rank
- #32
- US rank
- #2205
Category grades
Schools grade is shown separately in the Schools card above.
Census & demographics
- Census place
- Waterbury, CT
- County
- New Haven County · 688,236 people
- City population
- 115,012
- Metro
- New Haven-Milford, CT
- Population (ZIP)
- 9,942
- Household income
- $37,191
- Rent vs Own
- Severe rent burden
- 856.0
Population outlook (Naugatuck Valley County) Hauer SSP2
- By 2040
- 496,846
Race, ethnicity, and origin ACS 2023
- Neighborhood character
- Highly diverse neighborhood (Simpson 0.74)
- Race & ethnicity
- Hispanic / Latino 33% Black 29% White 26% Two or more races 16% Asian 2%
- Hispanic origin (detail)
- Mexican 2% Puerto Rican 17% Cuban 2% Dominican 9%
- Common ancestry
- Romanian 2% Italian 2% Estonian 2%
- Foreign-born
- 16% · Canada, Mexico
- Languages at home
- 67% English-only · Spanish 27% Other Indo-European 3% Russian/Polish/Slavic 1%
Political lean MEDSL · Naugatuck Valley
- 2024 margin
- Lean R (+7.4) · D 45.6% · R 53.0% · Other 1.4%
- All cycles
- 2024: R+7.4
Not yet ingested
- Civics
- —
Market trends
- HPI YoY
- ▼ -26.17%
- Current HPI
- 296.1252
- Rent YoY
- ▼ -0.39%
- Metro
- New Haven-Milford, CT
- State GDP YoY
- ▲ 1.06%
- F500 in state
- 38
Industry mix (Fortune 500 HQ in CT)
| Industry | F500 HQs | Revenue |
|---|---|---|
| Industrial Machinery | 4 | $38B |
|
||
| Insurance | 3 | $71B |
|
||
| Financial Services | 2 | $25B |
|
||
| Transportation / Logistics | 2 | $18B |
|
||
| Healthcare | 1 | $247B |
|
||
| Telecommunications | 1 | $55B |
|
||
Price history
+95.5% since first listed26 events — show timeline
- 2026-06-03 Price Changed $429,900 Smart MLS
- 2026-05-27 Relisted — Smart MLS
- 2026-05-26 Contingent — Smart MLS
- 2026-05-15 Price Changed $449,900 Smart MLS
- 2026-05-14 Listed $349,900 Smart MLS
- 2026-04-10 Listing Removed — Smart MLS
- 2026-03-06 Pending — Smart MLS
- 2026-02-09 Contingent — Smart MLS
- 2026-02-09 Pending — Smart MLS
- 2026-02-09 Relisted — Smart MLS
- 2026-02-08 Listing Removed — Smart MLS
- 2026-01-14 Price Changed $399,900 Smart MLS
- 2026-01-02 Listed $419,900 Smart MLS
- 2026-01-01 Listing Removed — Smart MLS
- 2025-12-17 Price Changed $425,000 Smart MLS
- 2025-12-02 Price Changed $449,900 Smart MLS
- 2025-10-31 Listed $459,900 Smart MLS
- 2021-01-09 Listing Removed — Smart MLS
- 2021-01-01 Listed $130,000 Smart MLS
- 2012-07-26 Sold (MLS) $18,100 Smart MLS
- 2012-06-08 Listed $15,000 Smart MLS
- 2011-05-10 Listing Removed — Smart MLS
- 2010-05-10 Listed $110,900 Smart MLS
- 2006-03-08 Sold (Public Records) $215,000 Public Records
- 2006-01-20 Sold (MLS) $215,000 Smart MLS
- 2005-08-19 Listed $219,900 Smart MLS
Property tax history
+5.0%/yrLatest (2023): $3,930 · +72.5% YoY. Source: county tax records.
Cash-flow waterfall
monthlySold comps — $/sqft
last 12 mo · ≤1 miLoading sold comps…