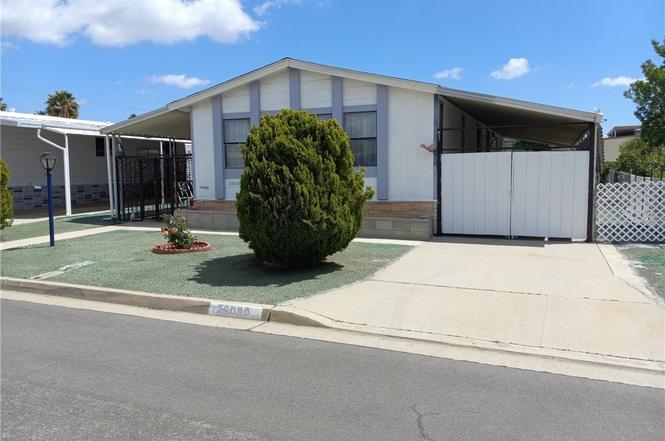
26090 Ivory Palm Dr · Homeland, CA
Flood risk 1/10 · Minimal
- FEMA flood zone
- X (unshaded)
- Chance of flooding over 30 yrs
- 0.0%
- Est. flood insurance / yr
- $507 – $1,088
Fire risk 8/10 · Major
- Est. fire insurance / yr
- $659 – $1,223
Heat risk 7/10 · Major
- Hot days now (above 103°F)
- 6 days/yr
- Hot days in 30 yrs
- 17 days/yr
Wind risk 1/10 · Minimal
- Chance of severe wind over 30 yrs
- —
Air-quality risk 6/10 · Moderate
- Unhealthy air days now
- 10 days/yr
- Unhealthy air days in 30 yrs
- 14 days/yr
Risk factors via First Street. Map © Google.
Why this score? — see what drove the B grade
The composite is a weighted blend of 9 inputs, each scored 0–100. Each bar is that input's sub-score; the figure is the points it added to the 100-point composite (weight × sub-score).
- Cash flow +26.5/30.0
- Appreciation +10.0/10.0
- DSCR +9.0/10.0
- 1% rule +7.0/10.0
- ARV discount +6.9/15.0
- Schools +3.7/10.0
- Rent growth +2.5/5.0
- Condition / age +2.5/5.0
- Livability +2.2/5.0
$249,000
🖨 Deal sheet 📄 Offer letter ✓ Due diligence
Listing remarks
* * Welcome to a great Manufactured Home + You own the land in the heart of Homeland, California! 26090 Ivory Palm is a great property that is located in a very low HOA. Located in the Highland Palms Senior Estates and Country Club gives you unlimited Gold and amenities! This community is located in a Senior Community (Age 54.5+) for adults. Your manufactured home will be certified 433A (permanent foundation) before appraisal. You have 2 spacious bedrooms including a primary suite with Closet, Private bathroom with soaking tub, stand-up shower and plenty of closet space. The home has 1,344 square feet of living space and was recently carpeted. Comes with a fully functional kitchen with Ga
Key facts
- Manufactured home
- Plenty of parking
- Own the land
Tags
Property features AI
Finance
- Other: Lease considered; Located in a community with golf course, park, and dog park nearby
- HOA & community: Part of Highland Palms association; Monthly association fee of $135; Senior community; Association amenities: spa, community pool, clubhouse, gym/exercise room, meeting/banquet facilities, barbecue, playground, dog park, tennis, paddle tennis, sport court, golf, billiard room, picnic area, onsite property management, recreational multipurpose room
Exterior
- Parking: Total of 3 parking spaces; 2 covered carport spaces (attached carport); 1 uncovered off-street private space
- Utilities: Public/district water; Public sewer; Standard electric service; electricity connected/available; Natural gas connected and available; Cable connected/available; Telephone in street; Sewer and water connected/available
- Home design: Single-story (one level); Entry at main level; No shared/common walls
- Construction: Concrete perimeter foundation with seismic tie-downs; Certified 433A
- Exterior features: Manufactured house; Covered, enclosed stone patio; Awning; TV antenna and satellite dish; Community/association pool
Interior
- Kitchen: Gas cooktop; Double oven (including gas oven); Laminate counters; Pots & pan drawers; Kitchen open to family room; Eating area in family room; Water heater unit
- Bedrooms: Primary bedroom with primary suite and primary bathroom; All bedrooms on the main floor
- Flooring: Vinyl flooring; Carpet
- Bathrooms: Two full baths; Soaking tub; Separate tub and walk-in shower; Bidet; Vanity area; Linen closet/storage; Formica counters in baths
- Heating & cooling: Central furnace heating; Central air conditioning and wall/window units
- Interior features: Ceiling fan; Formica counters; Drapes/Curtains, Custom window coverings and blinds; One-level home; Main-floor primary bedroom; Main floor bedrooms and bathrooms
- Laundry & utility: Washer and dryer included; Washer hookup and electric dryer hookup inside
Neighborhood map
What this means for you Summary
Snapshot
- This is a 2-bed/2.0-bath manufactured listed at $249k.
Deal economics
- At list price, monthly cash flow is $659 ($8k/yr) — positive.
- The deal already cash-flows at list — no discount required.
- Meets the 1% rule at list price ($3k rent vs $249k).
- Recommended offer: $219k (12.0% below list) — sets the bar for market timing.
- Cap rate 9.5% vs local median 5.9% in Homeland — top-decile yield for the area; either an underpriced asset or a hidden risk that comps aren't pricing in. Stress-test before assuming the spread holds.
Location & tenants
- Location reads 45/100 on livability (#1,297 in CA) — a working-class tenant base; expect higher turnover. Strengths: housing A+; Watch: cost of living C-, health & safety C-, employment D.
- Romoland Elementary (suburban): math 35% / reading 44% proficiency, ranked #699 of 1,400 in CA (top 50%) — families likely to look elsewhere, expect single-tenant / working-renter base with shorter leases.
- Market conditions: 53 active listings in the ZIP; 1 comparable units currently listed for rent nearby; 9,195 units permitted in Riverside County in 2024 (1,512 in 5+ unit buildings).
Forward outlook
- In year one you build about $27k of equity ($2k loan paydown + $25k appreciation (10.0% local appreciation)).
- Riverside County population projected at +22% by 2050 — long-run rental-demand tailwind backs the buy-and-hold thesis.
- At projected returns (10.0% appreciation + 3.0% rent growth), your $70k cash investment doubles in ~2 years — after that, you're playing with house money.
- By year 2, paydown + projected appreciation supports a ~$43k cash-out refi (75% LTV) — recoverable capital for the next deal without selling this one.
Negotiation context
- It's been on market 161 days — a 12% lower offer ($219k) is reasonable based on typical stale-listing flexibility.
- 7 sale attempts since 6y ago; this cycle's ask has dropped $16k (6%) from the opening price — seller is motivated, your offer sets the floor, not the list.
- Current owner paid $135k; list at $249k implies a 84% gain — meaningful room to come down on a strong offer.
Risks & watch-outs
- Climate carrying-cost: severe wildfire risk; extreme-heat days projected 6→17/yr by 2055 (HVAC capex compounding) — expect insurance premiums to compound above CPI over the hold.
Questions for the listing agent
- It's been on market 161 days. Have you received any prior offers? Is the seller open to a 12% concession, seller financing, or rate buy-down credit?
- What does the HOA fee cover, when was the last increase, and are there any pending special assessments or reserve-fund shortfalls?
- Why hasn't it sold? Are there any deal-killer items the seller is aware of (foundation, flood, title, zoning, code violations)?
- Is there a deadline driving the sale (1031 exchange, divorce, estate, relocation)? That informs how much negotiation room exists.
- Schools are F-rated, which usually means shorter tenancies and higher turnover. Who's the typical renter profile here, and what's been the actual vacancy rate?
- Crime grade is F in this area — have there been break-ins, vandalism, or insurance claims at this property in the last 3 years? What carrier currently insures it and at what premium?
- What's the average days-on-market for RENTAL listings here right now (not sales)? A rising rental-DOM trend means longer vacancies and softer asking-rent achievability than the comps imply.
- What's the recent tenant-quality profile in this submarket — average credit score on applications, eviction rate, late-payment / NSF rate, and stable-employment percentage? A property-management company in the area should have these aggregated.
- How much new for-sale + rental construction is in the pipeline within 1–3 miles? Heavy new supply typically softens prices + rents 12–24 months out; constrained supply supports both.
Investment metrics
- 1% rule
- 1.20% ✓
- Cap rate
- 9.47%
- Cash-on-cash
- 11.34%
- DSCR
- 1.50
- GRM
- 6.9
CMA / ARV
- ARV (on-the-fly)
- $245,952
- Comps found
- 12
Show comp detail 12 sales within ~0.75 mi
| Address | Dist | Beds/Ba | Sqft | Sold | Price | $/sf | Match |
|---|---|---|---|---|---|---|---|
| 30856 Palmetto Palm Ave | 0.10mi | 2/2.0 | 1,344 (0%) | 2mo | $165,000 | $123 | 94 |
| 30730 Palmetto Palm Ave | 0.17mi | 2/2.0 | 1,344 (0%) | 6mo | $210,000 | $156 | 87 |
| 26078 Sago Palm | 0.04mi | 2/2.0 | 1,248 (-7%) | 1mo | $239,900 | $192 | 85 |
| 26080 ivory Palm Dr | 0.01mi | 2/2.0 | 1,440 (+7%) | 6mo | $225,000 | $156 | 83 |
| 26082 Seaforthia Palm | 0.30mi | 2/2.0 | 1,344 (0%) | 4mo | $254,000 | $189 | 82 |
| 30857 Palmetto Palm | 0.12mi | 3/2.0 (+1) | 1,456 (+8%) | 0mo | $266,000 | $183 | 75 |
| 30861 Paradise Palm | 0.21mi | 2/2.0 | 1,464 (+9%) | 3mo | $255,000 | $174 | 73 |
| 31240 Fretwell | 0.39mi | 2/2.0 | 1,440 (+7%) | 2mo | $300,000 | $208 | 68 |
| 26068 Fountain Palm Dr | 0.22mi | 2/2.0 | 1,200 (-11%) | 9mo | $220,000 | $183 | 64 |
| 26076 Butterfly Palm Dr | 0.26mi | 2/2.0 | 1,152 (-14%) | 8mo | $233,000 | $202 | 58 |
| 25952 Homeland Ave | 0.52mi | 2/2.0 | 1,440 (+7%) | 9mo | $225,000 | $156 | 56 |
| 26276 Guthridge | 0.61mi | 3/2.0 (+1) | 1,440 (+7%) | 3mo | $460,000 | $319 | 52 |
Match score weights: distance 35% · size 25% · config 20% · recency 20%. Top-matched comps best support the ARV.
Projected returns pro-forma
10.0% appreciation · 3.0% rent growth · sell at horizon
- IRR
- 32.6%
- Equity multiple
- 3.55×
- Total profit
- $177,612
- Equity at exit
- $224,319
- IRR
- 28.1%
- Equity multiple
- 8.03×
- Total profit
- $490,112
- Equity at exit
- $483,752
Cash invested: $69,720 (down + closing). Projections, not guarantees.
Landlord ↔ Tenant lean methodology
- Overall (STATE)
- 18 Strongly Tenant-Friendly
- State California
- 18 Strongly Tenant-Friendly · D+13
- County
- — inherits STATE
- City
- — inherits STATE
ZIP-level market 92548
- Home prices YoY
- 16.7%
- Active inventory
- 53
- Price-to-rent
- 6.9×
Monthly cashflow live
- Estimated rent
- $2,995 medium interval (Pro) →
- Mortgage (P&I)
- −$1,306
- Tax from tax record
- −$163 /mo · $1,952/yr
- Insurance
- −$104
- HOA
- −$135
- Vacancy / Maint / Mgmt
- −$629
- Net cashflow
- $659
Break-even live
UW: 25.0% down · 7.5% · 30yr · 1.5% tax · 5.0% vac · 8.0% maint · 8.0% mgmt
Financing live
Cash to close
- Down payment
- $62,250
- Closing costs
- $7,470
- Reserves months
- —
- Total cash needed
- —
Loan-product check · same deal, 3 products live
Conventional
25% down · 7.5% · 30yr
- Down + closing
- —
- Monthly P&I
- —
- Monthly cashflow
- —
- DSCR
- —
- Eligible?
- —
Personal DTI + credit; lowest rate.
DSCR
20% down · 8.5% · 30yr
- Down + closing
- —
- Monthly P&I
- —
- Monthly cashflow
- —
- DSCR
- —
- Eligible?
- —
No personal income docs; deal must DSCR.
Hard money
10% down · 12.0% · 12mo
- Down + closing
- —
- Monthly P&I
- —
- Monthly cashflow
- —
- DSCR
- —
- Eligible?
- —
Short-term bridge; refi at stabilization.
Rent comps 1 comps
| Address | Beds | Baths | Sqft | Rent | $/sqft | DOM | Units | Dist |
|---|---|---|---|---|---|---|---|---|
| 25120 Charina Ln Homeland, CA | 3.0 | 2.0 | 1782 | $2,995 | $1.68 | 1d | 1 | 1.03mi |
HOA detail
- Monthly dues
- $135 · $1,620/yr
Listing history 34 events
-
2026-06-18days on market $249,000 Active 161 DOM
-
2026-06-17days on market $249,000 Active 160 DOM
-
2026-06-16days on market $249,000 Active 159 DOM
-
2026-06-15days on market $249,000 Active 158 DOM
-
2026-06-13days on market $249,000 Active 156 DOM
-
2026-06-09days on market $249,000 Active 152 DOM
-
2026-06-08days on market $249,000 Active 151 DOM
-
2026-06-07days on market $249,000 Active 150 DOM
-
2026-06-04days on market $249,000 Active 147 DOM
-
2026-06-03days on market $249,000 Active 146 DOM
-
2026-06-02days on market $249,000 Active 145 DOM
-
2026-06-01days on market $249,000 Active 144 DOM
-
2026-05-31days on market $249,000 Active 143 DOM
-
2026-03-14price $249,000
-
2026-01-18price $259,900
-
2026-01-08$264,900 Active
-
2025-12-31historical
-
2025-07-30$264,900 Active
-
2025-07-10historical
-
2025-06-27historical
-
2025-05-30price $270,900
-
2025-02-27$275,900 Active
-
2025-02-18historical
-
2025-02-13historical $1,800
-
2024-11-19$1,800
-
2024-11-18$279,900 Active
-
2024-02-08historical $1,800
-
2023-12-23$1,800
-
2020-12-07soldstatus $135,000 Closed Sale
-
2020-12-07soldstatus $135,000
-
2020-11-10status Pending Sale
-
2020-09-15$152,000 Active
-
2020-09-05historical $152,000
-
1985-09-20soldstatus $60,000
ⓘ Source: listings_history table (triggers on properties + properties_extension) + one-shot
backfill from property_details.listing_events for pre-trigger history.
Tax reassessment forecast CA · Resets to sale price
- Current annual tax
- $1,952 · $163/mo
- Projected year-2 tax
- $1,952 · $163/mo
- Expected delta
- $0/yr ($0/mo · 0.0%)
ⓘ Screening estimate from a state-policy table — verify with the county assessor before closing.
Climate risk First Street
- Flood 1/10 Low FEMA zone X (unshaded) · 0% chance over 30 yrs
- Wildfire 8/10 Severe
- Heat 7/10 Severe 6 d/yr ≥103°F today · 17 d/yr by 30 yrs out
- Wind 1/10 Low
- Air quality 6/10 Major 10 unhealthy d/yr today · 14 by 30 yrs out
Nearby sold comps map
Loading sold comps map…
Walkable amenities ~0.75 mi
Loading nearby amenities…
Taxation est. · year 1
- Rental income
- $35,940
- − Mortgage interest
- −$13,948
- − Property taxes
- −$1,952
- − Insurance
- −$1,245
- − Repairs & maintenance
- −$2,875
- − Management
- −$2,875
- − HOA
- −$1,620
- − Depreciation
- −$7,244
- Taxable income
- $4,181
- Est. tax owed @ 24.0%
- −$1,004
- After-tax cash flow
- $6,903/yr
For passive investors: Depreciation is non-cash, so a rental often shows a tax loss while cash-flowing — sheltering income. Rental losses are passive: they offset passive income freely, and up to $25,000/yr can offset ordinary (W-2) income if you actively participate and your MAGI is under $100k (phasing out to $0 by $150k); unused losses carry forward. On sale, claimed depreciation is recaptured at up to 25%, and gains may owe capital-gains tax (a 1031 exchange can defer both). Figures are a year-1 estimate at your 24.0% rate — not tax advice; consult a CPA.
Schools (NCES district)
- District
- Romoland Elementary
- NCES district ID
- 0633390
- Math proficiency
- 35% ▲ 2.00%
- Reading proficiency
- 44% ▲ 1.00%
- Median HH income
- $58,935
- Composite
- 37.36/100
- National rank
- #8931
- State rank
- #699 of 1400 in CA
Livability — Homeland
- Score
- 45/100
- State rank
- #1297
- US rank
- #26584
Category grades
Schools grade is shown separately in the Schools card above.
Census & demographics
- Census place
- Homeland, CA
- Population (ZIP)
- 6,435
Population outlook (Riverside County) Hauer SSP2
- Today (2025)
- 2,664,475 people
- By 2030
- 2,802,692 · +5.2%
- By 2040
- 3,050,904 · +14.5%
- By 2050
- 3,256,783 · +22.2%
- By 2075
- 3,655,058 · +37.2%
- By 2100
- 3,766,594 · +41.4%
Race, ethnicity, and origin ACS 2023
- Neighborhood character
- Predominantly Hispanic (65%)
- Race & ethnicity
- Hispanic / Latino 65% White 30% Two or more races 9% Native American 3% Asian 3%
- Hispanic origin (detail)
- Mexican 59% Puerto Rican 2%
- Common ancestry
- Italian 2% Lithuanian 1% Serbian 1%
- Foreign-born
- 20% · Canada, South Korea
- Languages at home
- 54% English-only · Spanish 44% Korean 1% Vietnamese 1%
Political lean MEDSL · Riverside
- 2024 margin
- Toss-up / Even · D 48.0% · R 49.3% · Other 2.6%
- 2008→2024 swing
- -3.6pp toward R · 2008: 2.3pp · 2024: -1.3pp
- All cycles
- 2024: R+1.3 2020: D+8.0 2016: D+4.3 2012: R+0.4 2008: D+2.3
Not yet ingested
- Civics
- —
Market trends
- HPI YoY
- ▲ 62.36%
- Current HPI
- 435.0222
- Rent YoY
- —
- Metro
- —
- State GDP YoY
- ▲ 3.21%
- F500 in state
- 116
Industry mix (Fortune 500 HQ in CA)
| Industry | F500 HQs | Revenue |
|---|---|---|
| Technology | 27 | $1,492B |
|
||
| Financial Services | 3 | $174B |
|
||
| Retail | 3 | $44B |
|
||
| Insurance | 3 | $26B |
|
||
| Media / Entertainment | 2 | $115B |
|
||
| Pharmaceuticals / Biotech | 2 | $62B |
|
||
Price history
+315.0% since first listed21 events — show timeline
- 2026-03-14 Price Changed $249,000 CRMLS
- 2026-01-18 Price Changed $259,900 CRMLS
- 2026-01-08 Listed $264,900 CRMLS
- 2025-12-31 Listing Removed — CRMLS
- 2025-07-30 Listed $264,900 CRMLS
- 2025-07-10 Coming Soon — CRMLS
- 2025-06-27 Listing Removed — CRMLS
- 2025-05-30 Price Changed $270,900 CRMLS
- 2025-02-27 Listed $275,900 CRMLS
- 2025-02-18 Listing Removed — CRMLS
- 2025-02-13 Rental Removed $1,800 CRMLS
- 2024-11-19 Listed for Rent $1,800 CRMLS
- 2024-11-18 Listed $279,900 CRMLS
- 2024-02-08 Rental Removed $1,800 CRMLS
- 2023-12-23 Listed for Rent $1,800 CRMLS
- 2020-12-07 Sold (Public Records) $135,000 Public Records
- 2020-12-07 Sold (MLS) $135,000 CRMLS
- 2020-11-10 Pending — CRMLS
- 2020-09-15 Listed $152,000 CRMLS
- 2020-09-05 Coming Soon $152,000 CRMLS
- 1985-09-20 Sold (Public Records) $60,000 Public Records
Property tax history
+3.5%/yrLatest (2025): $1,952 · +29.2% YoY. Source: county tax records.
Cash-flow waterfall
monthlySold comps — $/sqft
last 12 mo · ≤1 miLoading sold comps…