710 Shine Ln · Cadiz, KY
Flood risk 1/10 · Minimal
- FEMA flood zone
- X (unshaded)
- Chance of flooding over 30 yrs
- 0.0%
- Est. flood insurance / yr
- $507 – $1,088
Fire risk 3/10 · Minor
- Est. fire insurance / yr
- $839 – $1,559
Heat risk 5/10 · Moderate
- Hot days now (above 109°F)
- 7 days/yr
- Hot days in 30 yrs
- 20 days/yr
Wind risk 3/10 · Minor
- Chance of severe wind over 30 yrs
- 7.0%
Air-quality risk 1/10 · Minimal
- Unhealthy air days now
- 0 days/yr
- Unhealthy air days in 30 yrs
- 0 days/yr
Risk factors via First Street. Map © Google.
Why this score? — see what drove the D- grade
The composite is a weighted blend of 9 inputs, each scored 0–100. Each bar is that input's sub-score; the figure is the points it added to the 100-point composite (weight × sub-score).
- Cash flow +14.1/30.0
- ARV discount +7.5/15.0
- DSCR +4.3/10.0
- Livability +3.1/5.0
- Schools +2.7/10.0
- 1% rule +2.6/10.0
- Rent growth +2.5/5.0
- Condition / age +2.5/5.0
- Appreciation +0.0/10.0
$160,000
🖨 Deal sheet (PDF) 📄 Offer letter ✓ Due diligence
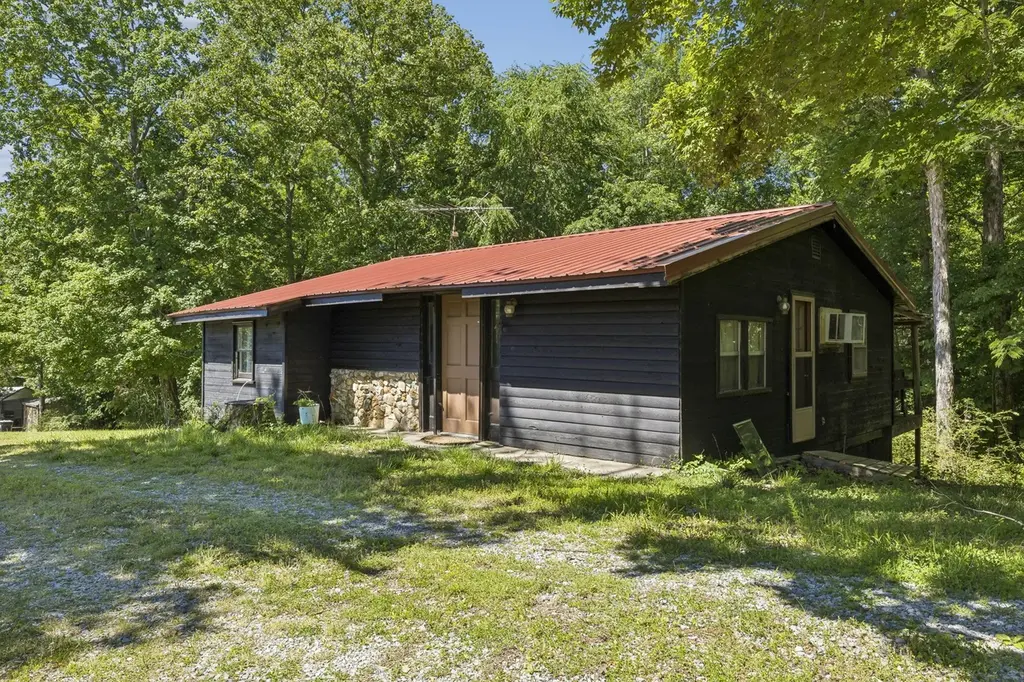
Listing remarks
Tucked away on 2 private acres near beautiful Lake Barkley, this cabin offers the perfect opportunity for a weekend getaway, investment property, or fixer-upper retreat. Located just 1.5 miles from the nearest boat dock and only minutes from local golf courses, this property is all about location and potential. The cabin is in need of repairs and updates, making it ideal for buyers looking to renovate and make it their own. Enjoy peaceful surroundings, room to spread out, and easy access to boating, fishing, and outdoor recreation. Home being sold AS-IS. Property will not qualify for VA or FHA financing. Cash or conventional financing only.
Key facts
- Private acres
- Outdoor recreation
- Boat dock
Tags
Property features AI
Finance
- Financial info: Annual tax amount reported
Exterior
- Parking: No covered parking; No off-street parking reported
- Utilities: Public water; Septic tank
- Home design: Single family residence; One story; Residential property
- Construction: Wood siding; Approximate year built
- Exterior features: 2-acre lot
Interior
- Kitchen: Electric oven; Refrigerator
- Bedrooms: 2 bedrooms (both on the main level); Bedroom 1 approximately 13 x 9; Bedroom 2 approximately 7 x 8
- Flooring: Carpet; Laminate
- Bathrooms: 1 full bathroom
- Heating & cooling: Baseboard heating; Other heating; Wall/window air conditioning unit(s)
- Interior features: No basement; Electric oven; Refrigerator
- Laundry & utility: Water available
Neighborhood map
What this means for you Summary
Snapshot
- This is a 1-bed/1.0-bath single-family listed at $160k.
Deal economics
- At list price, monthly cash flow is $24 ($292/yr) — positive.
- The deal already cash-flows at list — no discount required.
- To meet the 1% rule (rent ≥ 1% of price), the offer needs to be $122k (23.9% below list).
- Recommended offer: $122k (23.9% below list) — sets the bar for 1% rule.
- Cap rate 6.5% vs local median 3.6% in Cadiz — top-decile yield for the area; either an underpriced asset or a hidden risk that comps aren't pricing in. Stress-test before assuming the spread holds.
Location & tenants
- Location reads 62/100 on livability (#354 in KY) — a middle-class / working-renter tenant base. Strengths: crime A+, cost of living A+, housing A; Watch: amenities F, commute F, employment F.
- Trigg County (town): math 23% / reading 40% proficiency, ranked #90 of 165 in KY (top 54%) — families likely to look elsewhere, expect single-tenant / working-renter base with shorter leases.
- Zoned schools: Trigg County Intermediate School (math 24% / reading 38%, grade F, #378 of 676 statewide, top 57%, 384 students, 62% FRL); Trigg County Middle School (math 19% / reading 44%, grade F, #125 of 217 statewide, top 63%, 440 students, 60% FRL); Trigg County High School (math 32% / reading 32%, grade F, #97 of 254 statewide, top 46%, 617 students, 51% FRL).
- Market conditions: 302 active listings in the ZIP; 10 units permitted in Trigg County in 2024 (0 in 5+ unit buildings).
Forward outlook
- Local home prices are declining (-3.0%/yr); year-one equity from $1k of loan paydown is wiped out by about $5k of value loss. Plan a longer hold.
- Trigg County population projected to shrink 7% by 2050 — rents likely to lag national; underwrite the cash flow, not the appreciation.
Negotiation context
- It's been on market 37 days — a 3% lower offer ($155k) is reasonable based on typical stale-listing flexibility.
Risks & watch-outs
- Climate carrying-cost: extreme-heat days projected 7→20/yr by 2055 (HVAC capex compounding) — expect insurance premiums to compound above CPI over the hold.
Questions for the listing agent
- It's been on market 37 days. Have you received any prior offers? Is the seller open to a 24% concession, seller financing, or rate buy-down credit?
- Is there a deadline driving the sale (1031 exchange, divorce, estate, relocation)? That informs how much negotiation room exists.
- Schools are D-rated, which usually means shorter tenancies and higher turnover. Who's the typical renter profile here, and what's been the actual vacancy rate?
- The area grade is low — what's the realistic commute time and amenity access for the typical tenant pool here? Any planned neighborhood developments (good or bad) we should know about?
- What's the average days-on-market for RENTAL listings here right now (not sales)? A rising rental-DOM trend means longer vacancies and softer asking-rent achievability than the comps imply.
- What's the recent tenant-quality profile in this submarket — average credit score on applications, eviction rate, late-payment / NSF rate, and stable-employment percentage? A property-management company in the area should have these aggregated.
- How much new for-sale + rental construction is in the pipeline within 1–3 miles? Heavy new supply typically softens prices + rents 12–24 months out; constrained supply supports both.
Investment metrics
- 1% rule
- 0.76% ✗
- Cap rate
- 6.48%
- Cash-on-cash
- 0.65%
- DSCR
- 1.03
- GRM
- 11.0
CMA / ARV
No comps found within radius.
Projected returns pro-forma
-3.0% appreciation · 3.0% rent growth · sell at horizon
- IRR
- -15.3%
- Equity multiple
- 0.45×
- Total profit
- $-24,461
- Equity at exit
- $23,857
- IRR
- -6.9%
- Equity multiple
- 0.56×
- Total profit
- $-19,650
- Equity at exit
- $13,834
Cash invested: $44,800 (down + closing). Projections, not guarantees.
Landlord ↔ Tenant lean methodology
- Overall (STATE)
- 83 Strongly Landlord-Friendly
- State Kentucky
- 83 Strongly Landlord-Friendly · R+16
- County
- — inherits STATE
- City
- — inherits STATE
ZIP-level market 42211
- Active inventory
- 302
- Price-to-rent
- 11.0×
Monthly cashflow live
- Estimated rent
- $1,217 medium interval (Pro) →
- Mortgage (P&I)
- −$839
- Tax from tax record
- −$32 /mo · $378/yr
- Insurance
- −$67
- HOA
- −$0
- Vacancy / Maint / Mgmt
- −$256
- Net cashflow
- $24
Break-even live
Sensitivity live
| Price | -10% $115 | -5% $70 | +0% $24 | +5% $-21 | +10% $-66 |
|---|---|---|---|---|---|
| Rent | -10% $-72 | -5% $-24 | +0% $24 | +5% $72 | +10% $121 |
| Rate | -1.0pp $105 | -0.5pp $65 | base $24 | +0.5pp $-17 | +1.0pp $-59 |
UW: 25.0% down · 7.5% · 30yr · 1.5% tax · 5.0% vac · 8.0% maint · 8.0% mgmt
Financing live
Cash to close
- Down payment
- $40,000
- Closing costs
- $4,800
- Reserves months
- —
- Total cash needed
- —
Loan-product check · same deal, 3 products live
Conventional
25% down · 7.5% · 30yr
- Down + closing
- —
- Monthly P&I
- —
- Monthly cashflow
- —
- DSCR
- —
- Eligible?
- —
Personal DTI + credit; lowest rate.
DSCR
20% down · 8.5% · 30yr
- Down + closing
- —
- Monthly P&I
- —
- Monthly cashflow
- —
- DSCR
- —
- Eligible?
- —
No personal income docs; deal must DSCR.
Hard money
10% down · 12.0% · 12mo
- Down + closing
- —
- Monthly P&I
- —
- Monthly cashflow
- —
- DSCR
- —
- Eligible?
- —
Short-term bridge; refi at stabilization.
Listing history 18 events
-
2026-06-21days on market $160,000 Active 37 DOM
-
2026-06-19days on market $160,000 Active 35 DOM
-
2026-06-18days on market $160,000 Active 34 DOM
-
2026-06-17days on market $160,000 Active 33 DOM
-
2026-06-16days on market $160,000 Active 32 DOM
-
2026-06-15days on market $160,000 Active 31 DOM
-
2026-06-14days on market $160,000 Active 29 DOM
-
2026-06-12days on market $160,000 Active 28 DOM
-
2026-06-09days on market $160,000 Active 25 DOM
-
2026-06-08days on market $160,000 Active 24 DOM
-
2026-06-07days on market $160,000 Active 23 DOM
-
2026-06-05days on market $160,000 Active 20 DOM
-
2026-06-03days on market $160,000 Active 19 DOM
-
2026-06-03days on market $160,000 Active 18 DOM
-
2026-06-01days on market $160,000 Active 17 DOM
-
2026-05-31days on market $160,000 Active 16 DOM
-
2026-05-30days on market $160,000 Active 15 DOM
-
2026-05-16$160,000 Active 648-char remark
ⓘ Source: listings_history table (triggers on properties + properties_extension) + one-shot
backfill from property_details.listing_events for pre-trigger history.
Tax reassessment forecast KY · Resets to sale price
- Current annual tax
- $378 · $32/mo
- Projected year-2 tax
- $1,376 · $115/mo
- Expected delta
- +$998/yr (+$83/mo · 263.6%)
ⓘ Screening estimate from a state-policy table — verify with the county assessor before closing.
Climate risk First Street
- Flood 1/10 Low FEMA zone X (unshaded) · 0% chance over 30 yrs
- Wildfire 3/10 Moderate
- Heat 5/10 Major 7 d/yr ≥109°F today · 20 d/yr by 30 yrs out
- Wind 3/10 Moderate 7% chance of damaging wind over 30 yrs
- Air quality 1/10 Low 0 unhealthy d/yr today · 0 by 30 yrs out
Nearby sold comps map
Loading sold comps map…
Walkable amenities ~0.75 mi
Loading nearby amenities…
Taxation est. · year 1
- Rental income
- $14,607
- − Mortgage interest
- −$8,962
- − Property taxes
- −$378
- − Insurance
- −$800
- − Repairs & maintenance
- −$1,169
- − Management
- −$1,169
- − Depreciation
- −$4,655
- Taxable loss
- −$2,526
- Est. tax savings @ 24.0%
- +$606
- After-tax cash flow
- $898/yr
For passive investors: Depreciation is non-cash, so a rental often shows a tax loss while cash-flowing — sheltering income. Rental losses are passive: they offset passive income freely, and up to $25,000/yr can offset ordinary (W-2) income if you actively participate and your MAGI is under $100k (phasing out to $0 by $150k); unused losses carry forward. On sale, claimed depreciation is recaptured at up to 25%, and gains may owe capital-gains tax (a 1031 exchange can defer both). Figures are a year-1 estimate at your 24.0% rate — not tax advice; consult a CPA.
Schools (NCES district)
- District
- Trigg County
- NCES district ID
- 2105580
- Math proficiency
- 23% ▼ -20.00%
- Reading proficiency
- 40% ▼ -16.00%
- Median HH income
- $44,636
- Composite
- 26.87/100
- National rank
- #7100
- State rank
- #90 of 165 in KY
Livability — Cadiz
- Score
- 62/100
- State rank
- #354
- US rank
- #16772
Category grades
Schools grade is shown separately in the Schools card above.
Census & demographics
- Population (ZIP)
- 12,912
Population outlook (Trigg County) Hauer SSP2
- Today (2025)
- 14,071 people
- By 2030
- 13,950 · -0.9%
- By 2040
- 13,575 · -3.5%
- By 2050
- 13,065 · -7.1%
- By 2075
- 11,990 · -14.8%
- By 2100
- 10,802 · -23.2%
Race, ethnicity, and origin ACS 2023
- Neighborhood character
- Predominantly White (88%)
- Race & ethnicity
- White 88% Two or more races 6% Black 4% Hispanic / Latino 3%
- Common ancestry
- Italian 2% Slovak 2% Iranian 1%
- Foreign-born
- 2% · Canada
- Languages at home
- 91% English-only · German/W. Germanic 7% Spanish 2%
Political lean MEDSL · Trigg
- 2024 margin
- Solid R (+52.4) · D 23.2% · R 75.5% · Other 1.3%
- 2008→2024 swing
- -22.6pp toward R · 2008: -29.8pp · 2024: -52.4pp
- All cycles
- 2024: R+52.4 2020: R+50.1 2016: R+49.6 2012: R+35.7 2008: R+29.8
Not yet ingested
- Civics
- —
Market trends
- HPI YoY
- ▼ -86.15%
- Current HPI
- 130.8351
- Rent YoY
- —
- Metro
- —
- State GDP YoY
- ▲ 1.81%
- F500 in state
- 4
Industry mix (Fortune 500 HQ in KY)
| Industry | F500 HQs | Revenue |
|---|---|---|
| Healthcare | 1 | $118B |
|
||
| Food / Beverage | 1 | $7B |
|
||
Price history
1 event — show timeline
- 2026-05-16 Listed $160,000 REALTRACS as Distributed by MLS Grid
Property tax history
+3.0%/yrLatest (2025): $378 · -0.7% YoY. Source: county tax records.
Cash-flow waterfall
monthlySold comps — $/sqft
last 12 mo · ≤1 miLoading sold comps…