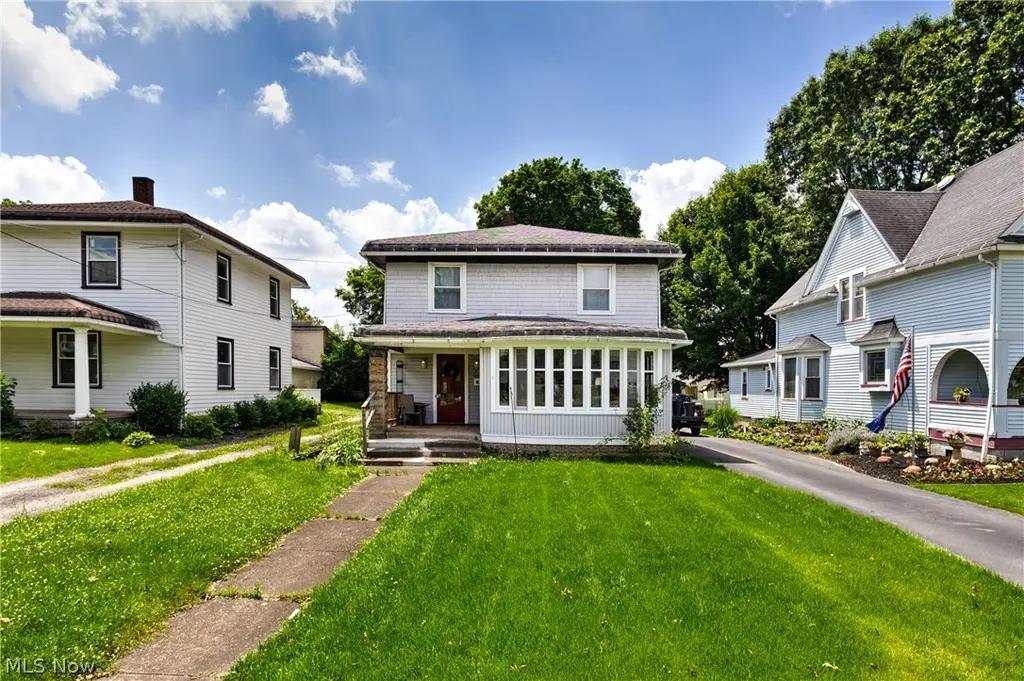
719 Robbins Ave · Niles, OH
Flood risk 1/10 · Minimal
- FEMA flood zone
- X (unshaded)
- Chance of flooding over 30 yrs
- 0.0%
- Est. flood insurance / yr
- $473 – $860
Fire risk 1/10 · Minimal
- Est. fire insurance / yr
- $713 – $1,323
Heat risk 3/10 · Minor
- Hot days now (above 97°F)
- 7 days/yr
- Hot days in 30 yrs
- 18 days/yr
Wind risk 1/10 · Minimal
- Chance of severe wind over 30 yrs
- —
Air-quality risk 3/10 · Minor
- Unhealthy air days now
- 1 days/yr
- Unhealthy air days in 30 yrs
- 4 days/yr
Risk factors via First Street. Map © Google.
Why this score? — see what drove the D grade
The composite is a weighted blend of 9 inputs, each scored 0–100. Each bar is that input's sub-score; the figure is the points it added to the 100-point composite (weight × sub-score).
- Cash flow +12.2/30.0
- ARV discount +10.3/15.0
- Schools +3.7/10.0
- DSCR +3.6/10.0
- Livability +3.4/5.0
- 1% rule +2.6/10.0
- Rent growth +2.5/5.0
- Condition / age +2.5/5.0
- Appreciation +0.0/10.0
$160,000
🖨 Deal sheet 📄 Offer letter ✓ Due diligence
Listing remarks MLS
Looking for a diamond in the rough? This gem is located on Niles' Robbins Avenue and has great big rooms and plenty of built-in cabinets and linen closets and a laundry chute. First floor features a sun room with a curved wall of windows and a fireplace with gas insert with two doors to the huge living room, nice sized dining room with glass doors between the living and dining rooms, and kitchen with a breakfast room. (A water pipe broke in the second floor bathroom and caused damage to the kitchen. ) Pretty woodwork on the staircase to the second floor. Three bedrooms and full bath. Full basement with high ceilings. Back yard with storage shed. Schedule a tour and make this the neighborhood gem you'll call home.
Key facts
- Updated appliances
- Original built-ins
- Soft close cabinetry
Tags
Property features AI
Exterior
- Parking: Gravel parking; Shared driveway
- Utilities: Public water; Public sewer
- Home design: 2-story vinyl-sided house; Facing north; Block foundation
- Construction: Vinyl siding exterior; Asphalt/fiberglass roof; Built according to public records; Has home warranty
- Exterior features: Front porch; Shed(s)
Interior
- Kitchen: Range; Dishwasher; Refrigerator
- Bathrooms: 1 full bathroom
- Heating & cooling: Forced air heating (gas); Central air conditioning
- Interior features: Decorative fireplace (1) with additional remarks; Full, unfinished basement
- Laundry & utility: Washer and Dryer located in the basement
Neighborhood map
What this means for you Summary
Snapshot
- This is a 3-bed/1.0-bath single-family listed at $160k.
Deal economics
- At list price, monthly cash flow is $-33 ($-400/yr) — negative.
- To cash-flow at today's rent, offer at most $154k (3.7% below list).
- To meet the 1% rule (rent ≥ 1% of price), the offer needs to be $121k (24.3% below list).
- Recommended offer: $121k (24.3% below list) — sets the bar for 1% rule.
Location & tenants
- Location reads 67/100 on livability (#628 in OH) — a middle-class / working-renter tenant base. Strengths: cost of living A+, housing A+; Watch: crime D+, employment D, amenities F.
- Niles City (suburban): math 37% / reading 52% proficiency, ranked #507 of 656 in OH (top 77%) — families likely to look elsewhere, expect single-tenant / working-renter base with shorter leases.
- Market conditions: 65 active listings in the ZIP; 2 comparable units currently listed for rent nearby; 129 units permitted in Trumbull County in 2024 (0 in 5+ unit buildings).
Forward outlook
- Local home prices are declining (-3.0%/yr); year-one equity from $1k of loan paydown is wiped out by about $5k of value loss. Plan a longer hold.
- Trumbull County population projected at -22% by 2050 — secular population decline; favor cash flow + early exit over multi-decade hold.
Negotiation context
- Only 10 days on market — expect competitive offers; lowballing is unlikely to land.
- 7 sale attempts since 21y ago with the ask held roughly flat each time — persistent listings suggest the price (not the market) is what's stuck; bring a comps-based counter.
Risks & watch-outs
- Watch-outs: built in 1916 — expect roof / HVAC / electrical / plumbing capex.
Questions for the listing agent
- What do current leases actually rent for vs. the listed asking? Can we see a recent rent roll and the last 12 months of T-12 income?
- Built in 1916 — when were the roof, HVAC, electrical panel, plumbing, and water heater last replaced?
- Is there a deadline driving the sale (1031 exchange, divorce, estate, relocation)? That informs how much negotiation room exists.
- Schools are B-rated — typically a magnet for longer-tenancy family renters. What's the average tenant stay here, and is there a school-zone premium baked into asking?
- Crime grade is D in this area — have there been break-ins, vandalism, or insurance claims at this property in the last 3 years? What carrier currently insures it and at what premium?
- The area grade is low — what's the realistic commute time and amenity access for the typical tenant pool here? Any planned neighborhood developments (good or bad) we should know about?
- What's the average days-on-market for RENTAL listings here right now (not sales)? A rising rental-DOM trend means longer vacancies and softer asking-rent achievability than the comps imply.
- What's the recent tenant-quality profile in this submarket — average credit score on applications, eviction rate, late-payment / NSF rate, and stable-employment percentage? A property-management company in the area should have these aggregated.
- How much new for-sale + rental construction is in the pipeline within 1–3 miles? Heavy new supply typically softens prices + rents 12–24 months out; constrained supply supports both.
Investment metrics
- 1% rule
- 0.76% ✗
- Cap rate
- 6.04%
- Cash-on-cash
- -0.89%
- DSCR
- 0.96
- GRM
- 11.0
CMA / ARV
- ARV (on-the-fly)
- $170,716
- Comps found
- 12
Show comp detail 12 sales within ~0.75 mi
| Address | Dist | Beds/Ba | Sqft | Sold | Price | $/sf | Match |
|---|---|---|---|---|---|---|---|
| 724 N Bentley Ave | 0.52mi | 3/1.5 | 1,890 (+1%) | 6mo | $225,000 | $119 | 67 |
| 331 Wood Ave | 0.35mi | 3/2.0 | 1,712 (-9%) | 1mo | $81,900 | $48 | 65 |
| 737 N Bentley Ave | 0.55mi | 3/2.5 | 1,928 (+3%) | 6mo | $246,000 | $128 | 59 |
| 850 Vienna Ave | 0.63mi | 3/2.0 | 1,952 (+4%) | 2mo | $177,400 | $91 | 59 |
| 45 Summit Ave | 0.44mi | 3/1.5 | 1,653 (-12%) | 0mo | $85,000 | $51 | 57 |
| 166 Oak Knl | 0.67mi | 4/1.0 (+1) | 1,829 (-2%) | 2mo | $75,000 | $41 | 57 |
| 30 Bond St | 0.52mi | 4/1.5 (+1) | 1,816 (-3%) | 11mo | $165,000 | $91 | 54 |
| 1354 Clark St | 0.54mi | 3/2.0 | 1,800 (-4%) | 17mo | $334,000 | $186 | 50 |
| 124 Morse Ave | 0.32mi | 3/2.0 | 1,642 (-12%) | 14mo | $120,000 | $73 | 48 |
| 855 Lincoln Ave | 0.66mi | 3/2.0 | 2,031 (+8%) | 8mo | $141,000 | $69 | 44 |
| 1415 Clark St | 0.61mi | 3/1.5 | 2,018 (+8%) | 16mo | $145,000 | $72 | 44 |
| 340 Mcevoy Ct | 0.66mi | 4/2.5 (+1) | 2,084 (+11%) | 2mo | $230,000 | $110 | 38 |
Match score weights: distance 35% · size 25% · config 20% · recency 20%. Top-matched comps best support the ARV.
Projected returns pro-forma
-3.0% appreciation · 3.0% rent growth · sell at horizon
- IRR
- -17.8%
- Equity multiple
- 0.37×
- Total profit
- $-28,102
- Equity at exit
- $23,857
- IRR
- -10.0%
- Equity multiple
- 0.39×
- Total profit
- $-27,417
- Equity at exit
- $13,834
Cash invested: $44,800 (down + closing). Projections, not guarantees.
Landlord ↔ Tenant lean methodology
- Overall (STATE)
- 73 Landlord-Friendly
- State Ohio
- 73 Landlord-Friendly · R+6
- County
- — inherits STATE
- City
- — inherits STATE
ZIP-level market 44446
- Home prices YoY
- -19.9%
- Active inventory
- 65
- Price-to-rent
- 11.0×
Monthly cashflow live
- Estimated rent
- $1,211 medium interval (Pro) →
- Mortgage (P&I)
- −$839
- Tax from tax record
- −$84 /mo · $1,013/yr
- Insurance
- −$67
- HOA
- −$0
- Vacancy / Maint / Mgmt
- −$254
- Net cashflow
- $-33
Break-even live
UW: 25.0% down · 7.5% · 30yr · 1.5% tax · 5.0% vac · 8.0% maint · 8.0% mgmt
Financing live
Cash to close
- Down payment
- $40,000
- Closing costs
- $4,800
- Reserves months
- —
- Total cash needed
- —
Loan-product check · same deal, 3 products live
Conventional
25% down · 7.5% · 30yr
- Down + closing
- —
- Monthly P&I
- —
- Monthly cashflow
- —
- DSCR
- —
- Eligible?
- —
Personal DTI + credit; lowest rate.
DSCR
20% down · 8.5% · 30yr
- Down + closing
- —
- Monthly P&I
- —
- Monthly cashflow
- —
- DSCR
- —
- Eligible?
- —
No personal income docs; deal must DSCR.
Hard money
10% down · 12.0% · 12mo
- Down + closing
- —
- Monthly P&I
- —
- Monthly cashflow
- —
- DSCR
- —
- Eligible?
- —
Short-term bridge; refi at stabilization.
Rent comps 2 comps
| Address | Beds | Baths | Sqft | Rent | $/sqft | DOM | Units | Dist |
|---|---|---|---|---|---|---|---|---|
| 35 Neil St #1 Niles, OH | 2.0 | 1.0 | 1264 | $950 | $0.75 | 13d | 1 | 0.87mi |
| 1916 Youll St Niles, OH | 1.0–3.0 | 1.0–1.5 | 1216 | $1,130 | $0.93 | 13d | 1 | 1.12mi |
Listing history 9 events
-
2026-06-19days on market $160,000 Active 10 DOM
-
2026-06-18days on market $160,000 Active 9 DOM
-
2026-06-17days on market $160,000 Active 8 DOM
-
2026-06-16days on market $160,000 Active 7 DOM
-
2026-06-15days on market $160,000 Active 6 DOM
-
2026-06-14days on market $160,000 Active 4 DOM
-
2026-06-13days on market $160,000 Active 3 DOM
-
2026-06-10remarks 695-char remark
-
2026-06-10$160,000 Active 1 DOM
ⓘ Source: listings_history table (triggers on properties + properties_extension) + one-shot
backfill from property_details.listing_events for pre-trigger history.
Tax reassessment forecast OH · Partial reset (capped growth)
- Current annual tax
- $1,013 · $84/mo
- Projected year-2 tax
- $1,755 · $146/mo
- Expected delta
- +$741/yr (+$62/mo · 73.2%)
ⓘ Screening estimate from a state-policy table — verify with the county assessor before closing.
Climate risk First Street
- Flood 1/10 Low FEMA zone X (unshaded) · 0% chance over 30 yrs
- Wildfire 1/10 Low
- Heat 3/10 Moderate 7 d/yr ≥97°F today · 18 d/yr by 30 yrs out
- Wind 1/10 Low
- Air quality 3/10 Moderate 1 unhealthy d/yr today · 4 by 30 yrs out
Nearby sold comps map
Loading sold comps map…
Walkable amenities ~0.75 mi
Loading nearby amenities…
Taxation est. · year 1
- Rental income
- $14,535
- − Mortgage interest
- −$8,962
- − Property taxes
- −$1,013
- − Insurance
- −$800
- − Repairs & maintenance
- −$1,163
- − Management
- −$1,163
- − Depreciation
- −$4,655
- Taxable loss
- −$3,221
- Est. tax savings @ 24.0%
- +$773
- After-tax cash flow
- $373/yr
For passive investors: Depreciation is non-cash, so a rental often shows a tax loss while cash-flowing — sheltering income. Rental losses are passive: they offset passive income freely, and up to $25,000/yr can offset ordinary (W-2) income if you actively participate and your MAGI is under $100k (phasing out to $0 by $150k); unused losses carry forward. On sale, claimed depreciation is recaptured at up to 25%, and gains may owe capital-gains tax (a 1031 exchange can defer both). Figures are a year-1 estimate at your 24.0% rate — not tax advice; consult a CPA.
Schools (NCES district)
- District
- Niles City
- NCES district ID
- 3904449
- Math proficiency
- 37% ▼ -22.00%
- Reading proficiency
- 52% ▼ -11.00%
- Median HH income
- $37,965
- Composite
- 37.02/100
- National rank
- #4517
- State rank
- #507 of 656 in OH
Livability — Niles
- Score
- 67/100
- State rank
- #628
- US rank
- #11037
Category grades
Schools grade is shown separately in the Schools card above.
Census & demographics
- Census place
- Niles, OH
- County
- Trumbull County · 61,158 people
- City population
- 20,060
- Metro
- Youngstown-Warren-Boardman, OH-PA
- Population (ZIP)
- 20,060
- Household income
- $50,468
- Rent vs Own
- Severe rent burden
- 820.0
Population outlook (Trumbull County) Hauer SSP2
- Today (2025)
- 191,696 people
- By 2030
- 184,015 · -4.0%
- By 2040
- 166,810 · -13.0%
- By 2050
- 149,857 · -21.8%
- By 2075
- 115,769 · -39.6%
- By 2100
- 83,617 · -56.4%
Race, ethnicity, and origin ACS 2023
- Neighborhood character
- Predominantly White (88%)
- Race & ethnicity
- White 88% Two or more races 6% Black 4% Hispanic / Latino 3%
- Common ancestry
- Romanian 2% Slovak 1% Subsaharan African 1%
- Foreign-born
- 1%
- Languages at home
- 98% English-only · Spanish 1%
Political lean MEDSL · Trumbull
- 2024 margin
- R (+16.8) · D 41.2% · R 58.0%
- 2008→2024 swing
- -39.2pp toward R · 2008: 22.4pp · 2024: -16.8pp
- All cycles
- 2024: R+16.8 2020: R+10.6 2016: R+6.4 2012: D+22.2 2008: D+22.4
Not yet ingested
- Civics
- —
Market trends
- HPI YoY
- ▼ -49.52%
- Current HPI
- 198.7738
- Rent YoY
- —
- Metro
- Youngstown-Warren-Boardman, OH-PA
- State GDP YoY
- ▲ 1.98%
- F500 in state
- 48
Industry mix (Fortune 500 HQ in OH)
| Industry | F500 HQs | Revenue |
|---|---|---|
| Insurance | 3 | $145B |
|
||
| Industrial Machinery | 3 | $49B |
|
||
| Financial Services | 3 | $24B |
|
||
| Consumer Goods | 2 | $93B |
|
||
| Aerospace / Defense | 2 | $47B |
|
||
| Utilities | 2 | $33B |
|
||
Price history
+185.7% since first listed27 events — show timeline
- 2026-06-09 Listed $160,000 MLSNOW
- 2026-02-04 Listing Removed — MLSNOW
- 2025-12-10 Price Changed $160,000 MLSNOW
- 2025-12-01 Price Changed $162,000 MLSNOW
- 2025-10-06 Price Changed $163,000 MLSNOW
- 2025-08-21 Price Changed $168,000 MLSNOW
- 2025-08-09 Price Changed $170,000 MLSNOW
- 2025-07-18 Price Changed $174,000 MLSNOW
- 2025-06-23 Listed $180,000 MLSNOW
- 2025-01-10 Sold (Public Records) $160,000 Public Records
- 2022-03-29 Sold (Public Records) $54,000 Public Records
- 2022-03-29 Sold (MLS) $54,000 MLSNOW
- 2022-03-19 Pending — MLSNOW
- 2022-02-12 Contingent — MLSNOW
- 2021-10-29 Listed $54,000 MLSNOW
- 2014-10-20 Sold (Public Records) $64,000 Public Records
- 2014-10-17 Sold (MLS) $64,000 MLSNOW
- 2014-09-04 Listing Removed — MLSNOW
- 2013-12-05 Listed $64,000 MLSNOW
- 2013-05-13 Listing Removed — MLSNOW
- 2013-05-07 Listed $69,900 MLSNOW
- 2006-07-31 Listing Removed — MLSNOW
- 2005-07-11 Listed $79,900 MLSNOW
- 2005-06-30 Listing Removed — MLSNOW
- 2005-01-14 Listed $87,900 MLSNOW
- 1994-06-07 Sold (Public Records) $45,227 Public Records
- 1994-06-07 Sold (Public Records) $56,000 Public Records
Property tax history
-0.6%/yrLatest (2025): $1,013 · +0.9% YoY. Source: county tax records.
Cash-flow waterfall
monthlySold comps — $/sqft
last 12 mo · ≤1 miLoading sold comps…