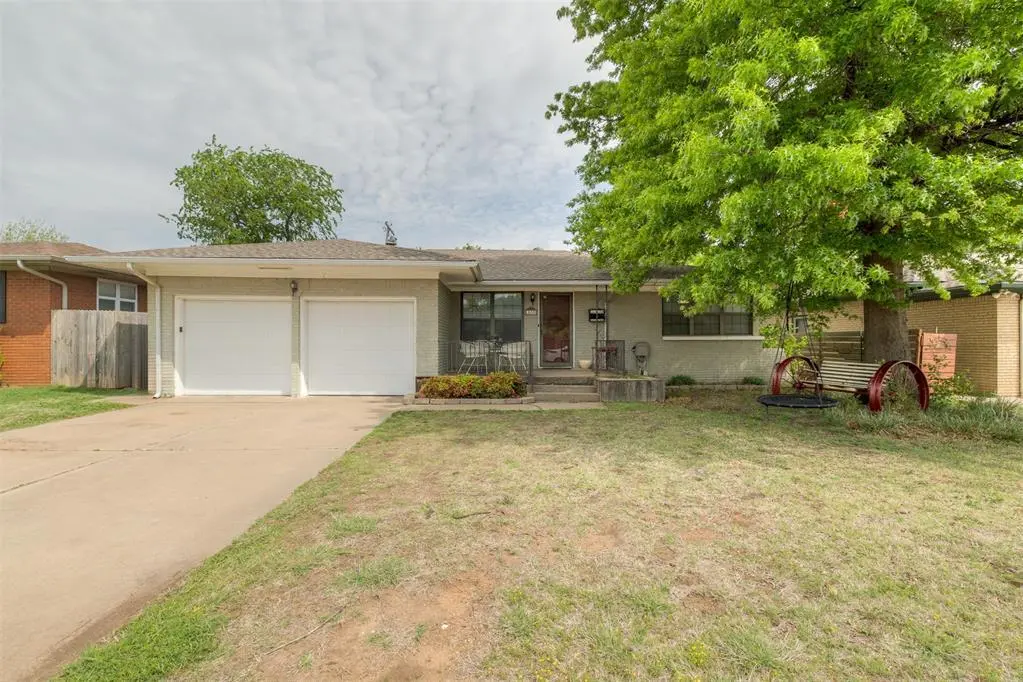
3221 NW 67th St · Oklahoma City, OK
Flood risk 1/10 · Minimal
- FEMA flood zone
- X (unshaded)
- Chance of flooding over 30 yrs
- 0.0%
- Est. flood insurance / yr
- $507 – $1,088
Fire risk 1/10 · Minimal
- Est. fire insurance / yr
- $2,463 – $4,575
Heat risk 6/10 · Moderate
- Hot days now (above 107°F)
- 7 days/yr
- Hot days in 30 yrs
- 19 days/yr
Wind risk 2/10 · Minimal
- Chance of severe wind over 30 yrs
- 2.0%
Air-quality risk 2/10 · Minimal
- Unhealthy air days now
- 1 days/yr
- Unhealthy air days in 30 yrs
- 2 days/yr
Risk factors via First Street. Map © Google.
Why this score? — see what drove the B- grade
The composite is a weighted blend of 9 inputs, each scored 0–100. Each bar is that input's sub-score; the figure is the points it added to the 100-point composite (weight × sub-score).
- Cash flow +25.8/30.0
- ARV discount +15.0/15.0
- DSCR +8.6/10.0
- 1% rule +6.8/10.0
- Livability +4.0/5.0
- Rent growth +3.6/5.0
- Condition / age +2.5/5.0
- Schools +0.7/10.0
- Appreciation +0.0/10.0
$150,000
🖨 Deal sheet 📄 Offer letter ✓ Due diligence
Listing remarks MLS
Beautiful home with lots of updates. Updates include: HVAC, windows, toilets, vanities, crown molding, paint, and flooring. Hardwood floors in the living and dining. Kitchen has updated tile floors, updated cabinets with a lazy susan, and updated countertops. Two of the bedrooms have closets with built in drawers and shelves. Laundry hookups are inside with room for a stackable washer and dryer. Outside features an open porch, a covered patio, and an open deck with a ramp.
Key facts
- 6,586 sq ft lot
- 2 garage spots
- Built 1953
Neighborhood map
What this means for you Summary
Snapshot
- This is a 3-bed/2.0-bath single-family listed at $150k.
Deal economics
- At list price, monthly cash flow is $362 ($4k/yr) — positive.
- The deal already cash-flows at list — no discount required.
- Meets the 1% rule at list price ($2k rent vs $150k).
- Cap rate 9.2% vs local median 3.7% in Oklahoma City — top-decile yield for the area; either an underpriced asset or a hidden risk that comps aren't pricing in. Stress-test before assuming the spread holds.
Location & tenants
- Location reads 80/100 on livability (#3 in OK, #1,635 nationally) — a professional / high-income tenant draw. Strengths: amenities A+, commute A+, cost of living A+; Watch: crime F.
- Oklahoma City (urban): math 7% / reading 10% proficiency, ranked #254 of 270 in OK (top 94%) — low school quality limits family demand, transient renter base, plan for 1-2y turnover; 82% free/reduced lunch — lower-income household profile, screen leases tightly.
- Zoned schools: Nichols Hills Es (math 17% / reading 17%, grade F, #540 of 845 statewide, top 68%, 494 students, 0% FRL); John Marshall Hs (math 2% / reading 8%, grade F, #430 of 447 statewide, top 99%, 829 students, 0% FRL) — zoned schools average 0% FRL vs 82% district-wide (82 pts lower); this property's tenant base skews higher-income than the district average.
- Market conditions: Rents rising fast (+4.3%/yr); 137 active listings in the ZIP; 27 comparable units currently listed for rent nearby; rentals at typical pace (median 24d on market — plan ~3-4 weeks tenant-placement turnaround); solid renter incomes; 5,365 units permitted in Oklahoma County in 2024 (569 in 5+ unit buildings).
Forward outlook
- Local home prices are declining (-3.0%/yr); year-one equity from $1k of loan paydown is wiped out by about $4k of value loss. Plan a longer hold.
- Oklahoma County population projected at +41% by 2050 — long-run rental-demand tailwind backs the buy-and-hold thesis.
- At projected returns (-3.0% appreciation + 4.3% rent growth), your $42k cash investment doubles in ~10 years — after that, you're playing with house money.
Negotiation context
- Only 1 days on market — expect competitive offers; lowballing is unlikely to land.
- 3 sale attempts since 25y ago with the ask held roughly flat each time — persistent listings suggest the price (not the market) is what's stuck; bring a comps-based counter.
Risks & watch-outs
- Watch-outs: built in 1953 — expect roof / HVAC / electrical / plumbing capex.
- Climate carrying-cost: extreme-heat days projected 7→19/yr by 2055 (HVAC capex compounding) — expect insurance premiums to compound above CPI over the hold.
Questions for the listing agent
- Built in 1953 — when were the roof, HVAC, electrical panel, plumbing, and water heater last replaced?
- Is there a deadline driving the sale (1031 exchange, divorce, estate, relocation)? That informs how much negotiation room exists.
- Schools are F-rated, which usually means shorter tenancies and higher turnover. Who's the typical renter profile here, and what's been the actual vacancy rate?
- Crime grade is F in this area — have there been break-ins, vandalism, or insurance claims at this property in the last 3 years? What carrier currently insures it and at what premium?
- What's the average days-on-market for RENTAL listings here right now (not sales)? A rising rental-DOM trend means longer vacancies and softer asking-rent achievability than the comps imply.
- What's the recent tenant-quality profile in this submarket — average credit score on applications, eviction rate, late-payment / NSF rate, and stable-employment percentage? A property-management company in the area should have these aggregated.
- How much new for-sale + rental construction is in the pipeline within 1–3 miles? Heavy new supply typically softens prices + rents 12–24 months out; constrained supply supports both.
Investment metrics
- 1% rule
- 1.18% ✓
- Cap rate
- 9.19%
- Cash-on-cash
- 10.35%
- DSCR
- 1.46
- GRM
- 7.1
CMA / ARV
- ARV (on-the-fly)
- $216,372
- Comps found
- 12
Show comp detail 12 sales within ~0.75 mi
| Address | Dist | Beds/Ba | Sqft | Sold | Price | $/sf | Match |
|---|---|---|---|---|---|---|---|
| 3221 NW 67th St | 0.00mi | 3/1.5 | 1,387 (0%) | 1mo | $170,000 | $123 | 97 |
| 3016 NW 70th St | 0.26mi | 3/1.5 | 1,338 (-4%) | 2mo | $185,000 | $138 | 78 |
| 3225 NW 68th St | 0.06mi | 3/1.0 | 1,305 (-6%) | 8mo | $200,000 | $153 | 77 |
| 3130 NW 73rd St | 0.30mi | 3/2.0 | 1,549 (+12%) | 2mo | $202,000 | $130 | 65 |
| 3100 Elmwood Ave | 0.59mi | 3/2.0 | 1,338 (-4%) | 5mo | $225,000 | $168 | 62 |
| 3113 NW 62nd St | 0.33mi | 3/2.0 | 1,573 (+13%) | 3mo | $245,000 | $156 | 60 |
| 3325 NW 65th St | 0.22mi | 4/2.0 (+1) | 1,571 (+13%) | 6mo | $245,000 | $156 | 58 |
| 3033 NW 71 St | 0.29mi | 2/1.0 (-1) | 1,251 (-10%) | 5mo | $199,777 | $160 | 57 |
| 3112 Elmwood Ave | 0.58mi | 2/2.0 (-1) | 1,291 (-7%) | 3mo | $256,000 | $198 | 54 |
| 3129 Elmwood Ave | 0.59mi | 3/2.0 | 1,496 (+8%) | 7mo | $286,000 | $191 | 54 |
| 2824 NW 67th St | 0.50mi | 2/1.0 (-1) | 1,224 (-12%) | 6mo | $136,500 | $112 | 44 |
| 2908 Somerset Pl | 0.68mi | 3/2.0 | 1,200 (-14%) | 8mo | $205,000 | $171 | 39 |
Match score weights: distance 35% · size 25% · config 20% · recency 20%. Top-matched comps best support the ARV.
Projected returns pro-forma
-3.0% appreciation · 4.27% rent growth · sell at horizon
- IRR
- 0.7%
- Equity multiple
- 1.03×
- Total profit
- $1,083
- Equity at exit
- $22,365
- IRR
- 11.6%
- Equity multiple
- 1.96×
- Total profit
- $40,391
- Equity at exit
- $12,969
Cash invested: $42,000 (down + closing). Projections, not guarantees.
Landlord ↔ Tenant lean methodology
- Overall (STATE)
- 83 Strongly Landlord-Friendly
- State Oklahoma
- 83 Strongly Landlord-Friendly · R+20
- County
- — inherits STATE
- City
- — inherits STATE
ZIP-level market 73116
- Rents YoY
- 4.3%
- Active inventory
- 137
- Price-to-rent
- 7.1×
Monthly cashflow live
- Estimated rent
- $1,767 high interval (Pro) →
- Mortgage (P&I)
- −$787
- Tax from tax record
- −$185 /mo · $2,217/yr
- Insurance
- −$62
- HOA
- −$0
- Vacancy / Maint / Mgmt
- −$371
- Net cashflow
- $362
Break-even live
UW: 25.0% down · 7.5% · 30yr · 1.5% tax · 5.0% vac · 8.0% maint · 8.0% mgmt
Financing live
Cash to close
- Down payment
- $37,500
- Closing costs
- $4,500
- Reserves months
- —
- Total cash needed
- —
Loan-product check · same deal, 3 products live
Conventional
25% down · 7.5% · 30yr
- Down + closing
- —
- Monthly P&I
- —
- Monthly cashflow
- —
- DSCR
- —
- Eligible?
- —
Personal DTI + credit; lowest rate.
DSCR
20% down · 8.5% · 30yr
- Down + closing
- —
- Monthly P&I
- —
- Monthly cashflow
- —
- DSCR
- —
- Eligible?
- —
No personal income docs; deal must DSCR.
Hard money
10% down · 12.0% · 12mo
- Down + closing
- —
- Monthly P&I
- —
- Monthly cashflow
- —
- DSCR
- —
- Eligible?
- —
Short-term bridge; refi at stabilization.
Rent comps 27 comps
| Address | Beds | Baths | Sqft | Rent | $/sqft | DOM | Units | Dist |
|---|---|---|---|---|---|---|---|---|
| 3229 NW 68th St Oklahoma City, OK | 3.0 | 2.0 | 1714 | $2,225 | $1.30 | 10d | 1 | 0.09mi |
| 3025 NW 67th St Oklahoma City, OK | 3.0 | 1.0 | 1071 | $1,350 | $1.26 | 43d | 1 | 0.20mi |
| 3037 NW 65th St Oklahoma City, OK | 3.0 | 1.5 | 1063 | $1,495 | $1.41 | 43d | 1 | 0.21mi |
| 3106 NW 63rd St Oklahoma City, OK | 3.0 | 2.0 | 1736 | $1,650 | $0.95 | 23d | 1 | 0.29mi |
| 3213 NW 61st Pl Oklahoma City, OK | 3.0 | 2.0 | 1777 | $2,095 | $1.18 | 2d | 1 | 0.34mi |
| 3333 NW 62nd St Oklahoma City, OK | 2.0 | 2.0 | 1780 | $2,000 | $1.12 | 17d | 1 | 0.36mi |
| 6162 N Brookline Ave #22 Oklahoma City, OK | 2.0 | 2.0 | 1626 | $2,500 | $1.54 | 4d | 1 | 0.49mi |
| 3025 NW Grand Blvd Oklahoma City, OK | 2.0 | 1.0 | 930 | $950 | $1.02 | 23d | 1 | 0.52mi |
| 6100 N Brookline Ave Oklahoma City, OK | 2.0 | 2.0 | 1040 | $1,900 | $1.83 | 23d | 1 | 0.55mi |
| 6000 N Brookline Ave Oklahoma City, OK | 2.0 | 1.0 | 880 | $1,242 | $1.41 | 23d | 2 | 0.60mi |
| 6101 N May Ave Oklahoma City, OK | 1.0–2.0 | 1.0–2.0 | 814 | $1,070 | $1.31 | 4d | 6 | 0.61mi |
| 3004 Somerset Pl Oklahoma City, OK | 3.0 | 1.0 | 888 | $1,150 | $1.30 | 23d | 1 | 0.65mi |
| 2757 Lancaster Ln Oklahoma City, OK | 2.0 | 1.0 | 1005 | $750 | $0.75 | 23d | 1 | 0.65mi |
| 2912 W Fairfield Ave Oklahoma City, OK | 3.0 | 1.0 | 1163 | $1,450 | $1.25 | 43d | 1 | 0.67mi |
| 2916 Shirley Ln Oklahoma City, OK | 2.0 | 1.0 | 1000 | $1,395 | $1.40 | 2d | 1 | 0.76mi |
| 2615 NW 63rd St Oklahoma City, OK | 3.0 | 1.0 | 1053 | $1,495 | $1.42 | 43d | 1 | 0.79mi |
| 3100 Northwest Expy Oklahoma City, OK | 1.0–3.0 | 1.0–2.5 | 1029 | $1,437 | $1.40 | 1d | 57 | 0.82mi |
| 3729 NW 60th St Oklahoma City, OK | 3.0 | 1.5 | 1424 | $1,500 | $1.05 | 19d | 1 | 0.84mi |
| 2710 NW 57th St Oklahoma City, OK | 3.0 | 1.0 | 900 | $1,425 | $1.58 | 4d | 1 | 0.97mi |
| 6300 N Villa Ave Oklahoma City, OK | 1.0–3.0 | 1.0–2.0 | 1383 | $1,518 | $1.10 | 43d | 1 | 1.00mi |
| 4020 Versailles Blvd Oklahoma City, OK | 2.0–3.0 | 2.0–2.5 | 1500 | $2,070 | $1.38 | 1d | 5 | 1.02mi |
| 5560 N Portland Ave Oklahoma City, OK | 1.0–2.0 | 1.0–2.0 | 955 | $1,249 | $1.31 | 1d | 50 | 1.03mi |
| 4018 NW 68th St Oklahoma City, OK | 2.0 | 2.0 | 1395 | $1,450 | $1.04 | 23d | 1 | 1.07mi |
| 3235 NW 50th St Oklahoma City, OK | 2.0 | 2.0 | 1216 | $1,120 | $0.92 | 4d | 1 | 1.14mi |
| 5113 N Brookline Ave Oklahoma City, OK | 2.0 | 1.0 | 1100 | $1,000 | $0.91 | 2d | 1 | 1.21mi |
| 3541 NW 50th St Oklahoma City, OK | 2.0 | 1.0 | 980 | $949 | $0.97 | 43d | 1 | 1.29mi |
| 3160 Nimitz Blvd Oklahoma City, OK | 3.0 | 1.0 | 1068 | $1,195 | $1.12 | 44d | 1 | 1.31mi |
Listing history 10 events
-
2026-04-17status Pending
-
2026-04-15$150,000 Active
-
2018-10-02soldstatus $131,500
-
2018-09-28soldstatus $130,010 Sold 477-char remark
Show marketing remark (477 chars)
Beautiful home with lots of updates. Updates include: HVAC, windows, toilets, vanities, crown molding, paint, and flooring. Hardwood floors in the living and dining. Kitchen has updated tile floors, updated cabinets with a lazy susan, and updated countertops. Two of the bedrooms have closets with built in drawers and shelves. Laundry hookups are inside with room for a stackable washer and dryer. Outside features an open porch, a covered patio, and an open deck with a ramp.
-
2018-08-18status Pending 477-char remark
Show marketing remark (477 chars)
Beautiful home with lots of updates. Updates include: HVAC, windows, toilets, vanities, crown molding, paint, and flooring. Hardwood floors in the living and dining. Kitchen has updated tile floors, updated cabinets with a lazy susan, and updated countertops. Two of the bedrooms have closets with built in drawers and shelves. Laundry hookups are inside with room for a stackable washer and dryer. Outside features an open porch, a covered patio, and an open deck with a ramp.
-
2018-07-27price $140,000 477-char remark
Show marketing remark (477 chars)
Beautiful home with lots of updates. Updates include: HVAC, windows, toilets, vanities, crown molding, paint, and flooring. Hardwood floors in the living and dining. Kitchen has updated tile floors, updated cabinets with a lazy susan, and updated countertops. Two of the bedrooms have closets with built in drawers and shelves. Laundry hookups are inside with room for a stackable washer and dryer. Outside features an open porch, a covered patio, and an open deck with a ramp.
-
2018-07-10$143,000 Active 477-char remark
Show marketing remark (477 chars)
Beautiful home with lots of updates. Updates include: HVAC, windows, toilets, vanities, crown molding, paint, and flooring. Hardwood floors in the living and dining. Kitchen has updated tile floors, updated cabinets with a lazy susan, and updated countertops. Two of the bedrooms have closets with built in drawers and shelves. Laundry hookups are inside with room for a stackable washer and dryer. Outside features an open porch, a covered patio, and an open deck with a ramp.
-
2006-09-06soldstatus $110,000
-
2001-06-21soldstatus $71,000
-
2001-05-08$69,900
ⓘ Source: listings_history table (triggers on properties + properties_extension) + one-shot
backfill from property_details.listing_events for pre-trigger history.
Tax reassessment forecast OK · Resets to sale price
- Current annual tax
- $2,217 · $185/mo
- Projected year-2 tax
- $2,217 · $185/mo
- Expected delta
- $0/yr ($0/mo · 0.0%)
ⓘ Screening estimate from a state-policy table — verify with the county assessor before closing.
Climate risk First Street
- Flood 1/10 Low FEMA zone X (unshaded) · 0% chance over 30 yrs
- Wildfire 1/10 Low
- Heat 6/10 Major 7 d/yr ≥107°F today · 19 d/yr by 30 yrs out
- Wind 2/10 Low 2% chance of damaging wind over 30 yrs
- Air quality 2/10 Low 1 unhealthy d/yr today · 2 by 30 yrs out
Nearby sold comps map
Loading sold comps map…
Walkable amenities ~0.75 mi
Loading nearby amenities…
Taxation est. · year 1
- Rental income
- $21,208
- − Mortgage interest
- −$8,402
- − Property taxes
- −$2,217
- − Insurance
- −$750
- − Repairs & maintenance
- −$1,697
- − Management
- −$1,697
- − Depreciation
- −$4,364
- Taxable income
- $2,082
- Est. tax owed @ 24.0%
- −$500
- After-tax cash flow
- $3,848/yr
For passive investors: Depreciation is non-cash, so a rental often shows a tax loss while cash-flowing — sheltering income. Rental losses are passive: they offset passive income freely, and up to $25,000/yr can offset ordinary (W-2) income if you actively participate and your MAGI is under $100k (phasing out to $0 by $150k); unused losses carry forward. On sale, claimed depreciation is recaptured at up to 25%, and gains may owe capital-gains tax (a 1031 exchange can defer both). Figures are a year-1 estimate at your 24.0% rate — not tax advice; consult a CPA.
Schools (NCES district)
- District
- Oklahoma City
- NCES district ID
- 4022770
- Math proficiency
- 7% ▼ -5.00%
- Reading proficiency
- 10% ▼ -6.00%
- Median HH income
- $35,606
- Composite
- 7.0/100
- National rank
- #9970
- State rank
- #254 of 270 in OK
Livability — Oklahoma City
- Score
- 80/100
- State rank
- #3
- US rank
- #1635
Category grades
Schools grade is shown separately in the Schools card above.
Census & demographics
- Census place
- Oklahoma City, OK
- County
- Oklahoma County · 771,644 people
- City population
- 498,656
- Metro
- Oklahoma City, OK
- Population (ZIP)
- 10,211
- Household income
- $81,226
- Rent vs Own
- Severe rent burden
- 262.0
Population outlook (Oklahoma County) Hauer SSP2
- Today (2025)
- 911,875 people
- By 2030
- 982,413 · +7.7%
- By 2040
- 1,130,468 · +24.0%
- By 2050
- 1,288,422 · +41.3%
- By 2075
- 1,711,482 · +87.7%
- By 2100
- 2,088,448 · +129.0%
Race, ethnicity, and origin ACS 2023
- Neighborhood character
- Predominantly White (72%)
- Race & ethnicity
- White 72% Two or more races 14% Hispanic / Latino 8% Black 5% Asian 3% Native American 2%
- Hispanic origin (detail)
- Mexican 6%
- Common ancestry
- Italian 3% Slovak 3% Lithuanian 2%
- Foreign-born
- 7% · Canada, South Korea, Philippines
- Languages at home
- 90% English-only · Spanish 6% Other Asian/Pacific 2% Arabic 1%
Political lean MEDSL · Oklahoma
- 2024 margin
- Toss-up / Even · D 48.0% · R 49.7% · Other 2.3%
- 2008→2024 swing
- +15.1pp toward D · 2008: -16.8pp · 2024: -1.7pp
- All cycles
- 2024: R+1.7 2020: R+1.1 2016: R+10.5 2012: R+16.7 2008: R+16.8
Not yet ingested
- Civics
- —
Market trends
- HPI YoY
- ▼ -260.29%
- Current HPI
- 258.0304
- Rent YoY
- ▲ 4.27%
- Metro
- Oklahoma City, OK
- State GDP YoY
- ▲ 1.55%
- F500 in state
- 6
Industry mix (Fortune 500 HQ in OK)
| Industry | F500 HQs | Revenue |
|---|---|---|
| Energy | 3 | $48B |
|
||
Price history
+114.6% since first listed10 events — show timeline
- 2026-04-17 Pending — MLSOK
- 2026-04-15 Listed $150,000 MLSOK
- 2018-10-02 Sold (Public Records) $131,500 Public Records
- 2018-09-28 Sold (MLS) $130,010 MLSOK
- 2018-08-18 Pending — MLSOK
- 2018-07-27 Price Changed $140,000 MLSOK
- 2018-07-10 Listed $143,000 MLSOK
- 2006-09-06 Sold (Public Records) $110,000 Public Records
- 2001-06-21 Sold (Public Records) $71,000 Public Records
- 2001-05-08 Listed $69,900 MLSOK
Property tax history
+6.5%/yrLatest (2025): $2,217 · +4.2% YoY. Source: county tax records.
Cash-flow waterfall
monthlySold comps — $/sqft
last 12 mo · ≤1 miLoading sold comps…