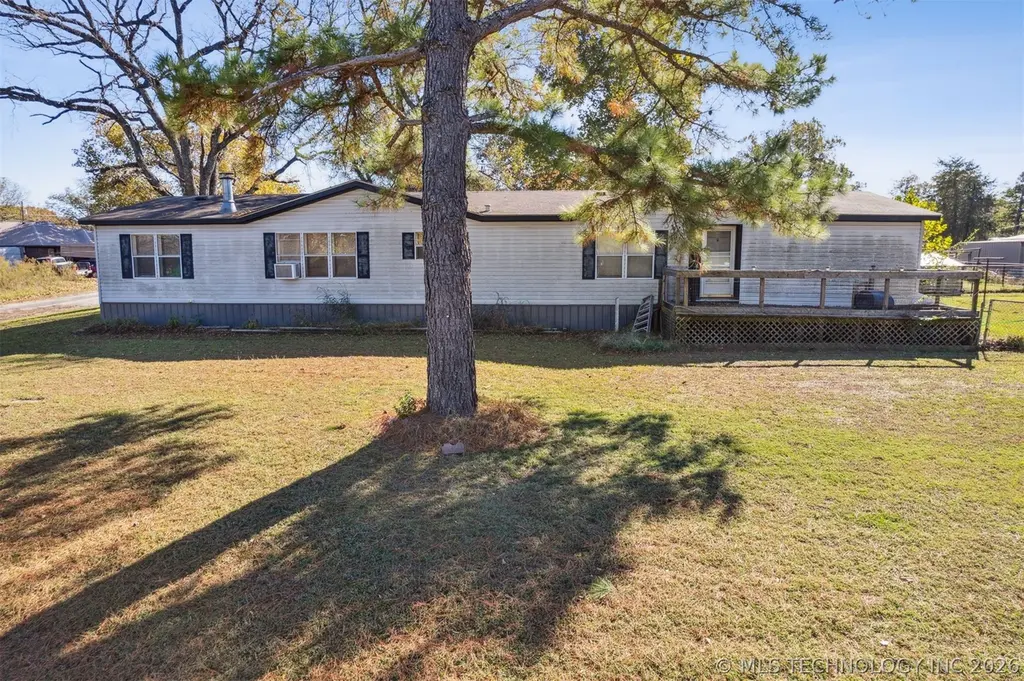
201 W B. St · Allen, OK
Flood risk 1/10 · Minimal
- FEMA flood zone
- X (unshaded)
- Chance of flooding over 30 yrs
- 0.0%
- Est. flood insurance / yr
- $507 – $1,088
Fire risk 6/10 · Moderate
- Est. fire insurance / yr
- $2,463 – $4,575
Heat risk 6/10 · Moderate
- Hot days now (above 110°F)
- 7 days/yr
- Hot days in 30 yrs
- 19 days/yr
Wind risk 4/10 · Minor
- Chance of severe wind over 30 yrs
- 11.0%
Air-quality risk 2/10 · Minimal
- Unhealthy air days now
- 0 days/yr
- Unhealthy air days in 30 yrs
- 1 days/yr
Risk factors via First Street. Map © Google.
Why this score? — see what drove the B grade
The composite is a weighted blend of 9 inputs, each scored 0–100. Each bar is that input's sub-score; the figure is the points it added to the 100-point composite (weight × sub-score).
- Cash flow +30.0/30.0
- 1% rule +10.0/10.0
- DSCR +10.0/10.0
- ARV discount +7.5/15.0
- Appreciation +7.3/10.0
- Livability +3.0/5.0
- Rent growth +2.5/5.0
- Condition / age +2.2/5.0
- Schools +1.4/10.0
$72,000
🖨 Deal sheet 📄 Offer letter ✓ Due diligence
Listing remarks
SITTING IN THE SUNSHINE ON A SPACIOUS CORNER LOT WITH TALL MATURE TREES & PLENTY OF SPACE FOR PARKING COMES THIS EXPANSIVE LAYOUT WITH A GREAT ADDITIONAL BUILDING! LOTS OF POSSIBILITIES FOR A GROWING FAMILY WITH 4 BEDROOMS AND 2.5 BATHROOMS AND LOTS OF SPACE FOR THE KIDDOS, PETS, & WFM. YOU WILL FIND PAVED ROADS ALL THE WAY TO THE PROPERTY AND A LOWER TRAFFIC NEIGHBORHOOD. TAKE A TOUR TODAY & DISCOVER ALL THE GREAT OPPORTUNITIES THIS PROPERTY HAS TO OFFER. LET YOUR IMAGINATION SOAR AND MAKE IT YOURS!
Key facts
- Paved roads
- Expansive layout
- Spacious corner lot
Tags
Property features AI
Exterior
- Parking: Detached garage; Carport
- Security: No safety shelter
- Utilities: Public water; Public sewer; Electricity available; Natural gas available
- Home design: Manufactured double-wide home; Single-story; Faces north; Tie-down foundation
- Construction: Vinyl siding; Asphalt/fiberglass roof
- Exterior features: Front porch; Partial fencing; Corner lot
Interior
- Kitchen: Double oven; Oven; Range / Stove; Dishwasher
- Flooring: Carpet; Vinyl
- Bathrooms: Two full bathrooms; One half bathroom
- Heating & cooling: Gas heating; Window unit cooling
- Interior features: Vaulted ceilings; Ceiling fan(s); Laminate counters; Aluminum window frames; Electric oven connection
- Laundry & utility: Washer hookup; Electric dryer hookup; Electric water heater
Neighborhood map
What this means for you Summary
Snapshot
- This is a 4-bed/2.5-bath manufactured listed at $72k. Condition is rated fair.
Deal economics
- At list price, monthly cash flow is $559 ($7k/yr) — positive.
- The deal already cash-flows at list — no discount required.
- Meets the 1% rule at list price ($1k rent vs $72k).
Location & tenants
- Location reads 60/100 on livability (#339 in OK) — a middle-class / working-renter tenant base. Strengths: cost of living A+, housing A; Watch: schools F, amenities F, commute F.
- Allen (rural): math 17% / reading 15% proficiency, ranked #208 of 270 in OK (top 77%) — low school quality limits family demand, transient renter base, plan for 1-2y turnover; 65% free/reduced lunch — lower-income household profile, screen leases tightly.
- Market conditions: 25 active listings in the ZIP; 2 units permitted in Pontotoc County in 2024 (0 in 5+ unit buildings).
Forward outlook
- In year one you build about $4k of equity ($498 loan paydown + $3k appreciation (4.5% local appreciation)).
- Pontotoc County population projected at +7% by 2050 — modest demand growth; plan on rents tracking national, not racing it.
- At projected returns (4.5% appreciation + 3.0% rent growth), your $20k cash investment doubles in ~2 years — after that, you're playing with house money.
- By year 9, paydown + projected appreciation supports a ~$33k cash-out refi (75% LTV) — recoverable capital for the next deal without selling this one.
Negotiation context
- Only 13 days on market — expect competitive offers; lowballing is unlikely to land.
- 4 sale attempts since 2y ago with the ask held roughly flat each time — persistent listings suggest the price (not the market) is what's stuck; bring a comps-based counter.
Risks & watch-outs
- Climate carrying-cost: major wildfire risk; extreme-heat days projected 7→19/yr by 2055 (HVAC capex compounding) — expect insurance premiums to compound above CPI over the hold.
Questions for the listing agent
- Have any recent inspections been done? Can we get a copy of the seller's disclosures and any deferred-maintenance estimates?
- Is there a deadline driving the sale (1031 exchange, divorce, estate, relocation)? That informs how much negotiation room exists.
- Schools are F-rated, which usually means shorter tenancies and higher turnover. Who's the typical renter profile here, and what's been the actual vacancy rate?
- What's the average days-on-market for RENTAL listings here right now (not sales)? A rising rental-DOM trend means longer vacancies and softer asking-rent achievability than the comps imply.
- What's the recent tenant-quality profile in this submarket — average credit score on applications, eviction rate, late-payment / NSF rate, and stable-employment percentage? A property-management company in the area should have these aggregated.
- How much new for-sale + rental construction is in the pipeline within 1–3 miles? Heavy new supply typically softens prices + rents 12–24 months out; constrained supply supports both.
Investment metrics
- 1% rule
- 1.86% ✓
- Cap rate
- 15.61%
- Cash-on-cash
- 33.26%
- DSCR
- 2.48
- GRM
- 4.5
CMA / ARV
No comps found within radius.
Projected returns pro-forma
4.55% appreciation · 3.0% rent growth · sell at horizon
- IRR
- 41.5%
- Equity multiple
- 3.50×
- Total profit
- $50,386
- Equity at exit
- $38,865
- IRR
- 39.9%
- Equity multiple
- 7.08×
- Total profit
- $122,505
- Equity at exit
- $65,527
Cash invested: $20,160 (down + closing). Projections, not guarantees.
Landlord ↔ Tenant lean methodology
- Overall (STATE)
- 83 Strongly Landlord-Friendly
- State Oklahoma
- 83 Strongly Landlord-Friendly · R+20
- County
- — inherits STATE
- City
- — inherits STATE
ZIP-level market 74825
- Home prices YoY
- 1.7%
- Active inventory
- 25
- Price-to-rent
- 4.5×
Monthly cashflow live
- Estimated rent
- $1,337 medium interval (Pro) →
- Mortgage (P&I)
- −$378
- Tax est. 1.5%
- −$90 /mo · $1,080/yr
- Insurance
- −$30
- HOA
- −$0
- Vacancy / Maint / Mgmt
- −$281
- Net cashflow
- $559
Break-even live
UW: 25.0% down · 7.5% · 30yr · 1.5% tax · 5.0% vac · 8.0% maint · 8.0% mgmt
Financing live
Cash to close
- Down payment
- $18,000
- Closing costs
- $2,160
- Reserves months
- —
- Total cash needed
- —
Loan-product check · same deal, 3 products live
Conventional
25% down · 7.5% · 30yr
- Down + closing
- —
- Monthly P&I
- —
- Monthly cashflow
- —
- DSCR
- —
- Eligible?
- —
Personal DTI + credit; lowest rate.
DSCR
20% down · 8.5% · 30yr
- Down + closing
- —
- Monthly P&I
- —
- Monthly cashflow
- —
- DSCR
- —
- Eligible?
- —
No personal income docs; deal must DSCR.
Hard money
10% down · 12.0% · 12mo
- Down + closing
- —
- Monthly P&I
- —
- Monthly cashflow
- —
- DSCR
- —
- Eligible?
- —
Short-term bridge; refi at stabilization.
Listing history 11 events
-
2026-06-19days on market $72,000 Active 13 DOM
-
2026-06-18days on market $72,000 Active 12 DOM
-
2026-06-17days on market $72,000 Active 11 DOM
-
2026-06-16days on market $72,000 Active 10 DOM
-
2026-06-15days on market $72,000 Active 9 DOM
-
2026-06-14days on market $72,000 Active 7 DOM
-
2026-06-12days on market $72,000 Active 6 DOM
-
2026-06-09days on market $72,000 Active 3 DOM
-
2026-06-08days on market $72,000 Active 2 DOM
-
2026-06-07remarks 510-char remark
-
2026-06-07$72,000 Active 1 DOM
ⓘ Source: listings_history table (triggers on properties + properties_extension) + one-shot
backfill from property_details.listing_events for pre-trigger history.
Climate risk First Street
- Flood 1/10 Low FEMA zone X (unshaded) · 0% chance over 30 yrs
- Wildfire 6/10 Major
- Heat 6/10 Major 7 d/yr ≥110°F today · 19 d/yr by 30 yrs out
- Wind 4/10 Moderate 11% chance of damaging wind over 30 yrs
- Air quality 2/10 Low 0 unhealthy d/yr today · 1 by 30 yrs out
Nearby sold comps map
Loading sold comps map…
Walkable amenities ~0.75 mi
Loading nearby amenities…
Taxation est. · year 1
- Rental income
- $16,046
- − Mortgage interest
- −$4,033
- − Property taxes
- −$1,080
- − Insurance
- −$360
- − Repairs & maintenance
- −$1,284
- − Management
- −$1,284
- − Depreciation
- −$2,095
- Taxable income
- $5,911
- Est. tax owed @ 24.0%
- −$1,419
- After-tax cash flow
- $5,287/yr
For passive investors: Depreciation is non-cash, so a rental often shows a tax loss while cash-flowing — sheltering income. Rental losses are passive: they offset passive income freely, and up to $25,000/yr can offset ordinary (W-2) income if you actively participate and your MAGI is under $100k (phasing out to $0 by $150k); unused losses carry forward. On sale, claimed depreciation is recaptured at up to 25%, and gains may owe capital-gains tax (a 1031 exchange can defer both). Figures are a year-1 estimate at your 24.0% rate — not tax advice; consult a CPA.
Condition & rehab AI · 12 photos
This mobile home requires moderate repairs and updates to its kitchen and bathrooms, as well as some maintenance on the exterior and interior. Upgrading these areas will significantly increase its resale and rental value.
Repairs flagged
- Moderate kitchen cabinets — outdated and in need of replacement
- Moderate kitchen countertops — dated and in need of replacement
- Moderate kitchen appliances — outdated and in need of replacement
- Moderate bathroom fixtures — dated and in need of replacement
- Moderate bathroom cabinetry — dated and in need of replacement
Value-add opportunities
- Resale update kitchen cabinets, countertops, and appliances — modernizing the kitchen will attract more buyers
- Resale update bathroom fixtures and cabinetry — modernizing the bathrooms will attract more buyers
- Both paint interior walls — improving the interior walls will enhance the home's curb appeal
- Both replace carpeted flooring — replacing the carpeted flooring with hardwood or tile will improve the home's curb appeal and increase its rental value
- Both repair siding — repairing the siding will improve the home's curb appeal and increase its rental value
Renovation cost estimate screening
| Repair item | Severity | Est. cost |
|---|---|---|
| kitchen cabinets · outdated and in need of replacement | Moderate | $3,000–15,000 |
| kitchen countertops · dated and in need of replacement | Moderate | $3,000–15,000 |
| kitchen appliances · outdated and in need of replacement | Moderate | $3,000–15,000 |
| bathroom fixtures · dated and in need of replacement | Moderate | $3,000–15,000 |
| bathroom cabinetry · dated and in need of replacement | Moderate | $3,000–15,000 |
| Total estimated repair cost · 5 items | $15,000–75,000 |
Value-add ROI direction
- Resale update kitchen cabinets, countertops, and appliances — modernizing the kitchen will attract more buyers ↑
- Resale update bathroom fixtures and cabinetry — modernizing the bathrooms will attract more buyers ↑
- Both paint interior walls — improving the interior walls will enhance the home's curb appeal ↑
- Both replace carpeted flooring — replacing the carpeted flooring with hardwood or tile will improve the home's curb appeal and increase its rental value ↑
- Both repair siding — repairing the siding will improve the home's curb appeal and increase its rental value ↑
ⓘ Cost ranges are severity-bucket heuristics (US national rule-of-thumb). Get contractor quotes + a written scope before underwriting a rehab budget.
Schools (NCES district)
- District
- Allen
- NCES district ID
- 4002760
- Math proficiency
- 17% ▲ 1.00%
- Reading proficiency
- 15% ▼ -7.00%
- Median HH income
- $44,024
- Composite
- 14.04/100
- National rank
- #9471
- State rank
- #208 of 270 in OK
Livability — Allen
- Score
- 60/100
- State rank
- #339
- US rank
- #18704
Category grades
Schools grade is shown separately in the Schools card above.
Census & demographics
- Census place
- Allen, OK
- Population (ZIP)
- 1,763
Population outlook (Pontotoc County) Hauer SSP2
- Today (2025)
- 39,521 people
- By 2030
- 40,140 · +1.6%
- By 2040
- 41,242 · +4.4%
- By 2050
- 42,293 · +7.0%
- By 2075
- 44,678 · +13.0%
- By 2100
- 46,015 · +16.4%
Race, ethnicity, and origin ACS 2023
- Neighborhood character
- Predominantly White (73%)
- Race & ethnicity
- White 73% Native American 16% Two or more races 6% Hispanic / Latino 5%
- Common ancestry
- Slovak 2% Lithuanian 2% Scottish 2%
- Foreign-born
- 2% · Canada
- Languages at home
- 95% English-only · Spanish 2%
Political lean MEDSL · Pontotoc
- 2024 margin
- Solid R (+46.6) · D 25.7% · R 72.3% · Other 2.1%
- 2008→2024 swing
- -9.9pp toward R · 2008: -36.7pp · 2024: -46.6pp
- All cycles
- 2024: R+46.6 2020: R+43.7 2016: R+45.8 2012: R+38.8 2008: R+36.7
Not yet ingested
- Civics
- —
Market trends
- HPI YoY
- ▲ 4.55%
- Current HPI
- 270.3801
- Rent YoY
- —
- Metro
- —
- State GDP YoY
- ▲ 1.55%
- F500 in state
- 6
Industry mix (Fortune 500 HQ in OK)
| Industry | F500 HQs | Revenue |
|---|---|---|
| Energy | 3 | $48B |
|
||
Price history
-31.4% since first listed9 events — show timeline
- 2026-06-06 Listed $72,000 MLS Technology, Inc.
- 2025-12-31 Listing Removed — MLS Technology, Inc.
- 2025-12-01 Price Changed $76,000 MLS Technology, Inc.
- 2025-06-25 Listed $78,900 MLS Technology, Inc.
- 2025-06-14 Listing Removed — MLS Technology, Inc.
- 2025-04-21 Price Changed $79,900 MLS Technology, Inc.
- 2025-04-12 Relisted — MLS Technology, Inc.
- 2025-03-27 Pending — MLS Technology, Inc.
- 2024-12-14 Listed $104,900 MLS Technology, Inc.
Cash-flow waterfall
monthlySold comps — $/sqft
last 12 mo · ≤1 miLoading sold comps…