 🏗️ New Construction
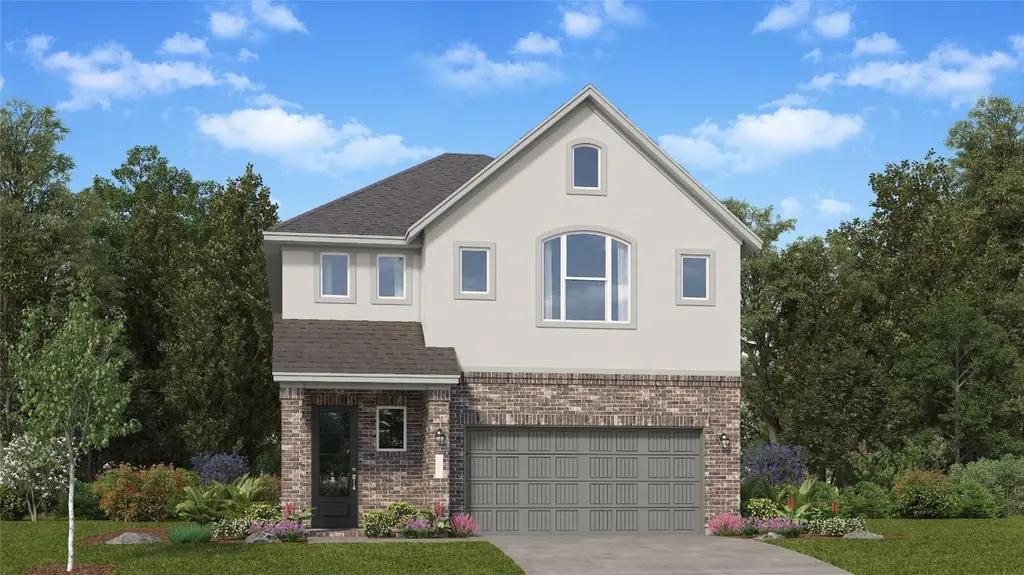
11685 Lazy Oak Creek Dr · The Woodlands, TX
Flood risk 1/10 · Minimal
- FEMA flood zone
- X (unshaded)
- Chance of flooding over 30 yrs
- 0.0%
- Est. flood insurance / yr
- $507 – $1,088
Fire risk 5/10 · Moderate
- Est. fire insurance / yr
- $1,222 – $2,270
Heat risk 8/10 · Major
- Hot days now (above 111°F)
- 7 days/yr
- Hot days in 30 yrs
- 24 days/yr
Wind risk 8/10 · Major
- Chance of severe wind over 30 yrs
- 99.0%
Air-quality risk 2/10 · Minimal
- Unhealthy air days now
- 2 days/yr
- Unhealthy air days in 30 yrs
- 2 days/yr
Risk factors via First Street. Map © Google.
Why this score? — see what drove the D+ grade
The composite is a weighted blend of 9 inputs, each scored 0–100. Each bar is that input's sub-score; the figure is the points it added to the 100-point composite (weight × sub-score).
- Appreciation +10.0/10.0
- Cash flow +8.3/30.0
- ARV discount +7.5/15.0
- Livability +4.5/5.0
- Condition / age +4.0/5.0
- Schools +3.9/10.0
- 1% rule +2.7/10.0
- Rent growth +2.6/5.0
- DSCR +2.2/10.0
$278,540
🖨 Deal sheet 📄 Offer letter ✓ Due diligence
Listing remarks
The Haven II Floor Plan - This new two-story home offers plenty of space to live and grow. The first floor consists of an open-concept floorplan shared between the kitchen, living and dining areas, with a nearby covered patio ready for outdoor entertainment and leisure. Four bedrooms are located on the second floor, including the lavish owner’s suite with a spa-inspired bathroom and walk-in closet. The completion date, prices and features may vary and are subject to change. Please verify with Lennar directly. Photos are for illustrative purposes only.
Key facts
- Walk-in closet
- Covered patio
- Owner's suite
Tags
Property features AI
Finance
- HOA & community: Homeowners association managed by Alamo Management Group; Annual association fee of $400; Community playground
Exterior
- Parking: Attached 2-car garage
- Utilities: Public water; Public sewer
- Home design: Residential property; Under construction (new construction); Slab foundation
- Construction: Built in 2026; Brick and stucco exterior; Composition roof
- Exterior features: Fenced backyard; Subdivision lot
Interior
- Kitchen: Dishwasher; Electric oven; Electric range; Gas oven; Gas range
- Bedrooms: Primary bedroom on second level (13 x 18); Bedroom on second level (13 x 11); Bedroom on second level (11 x 12); Bedroom on second level (11 x 10)
- Flooring: Carpet; Vinyl
- Bathrooms: 2 full bathrooms; 1 half bathroom
- Heating & cooling: Central heating (electric and gas); Central air conditioning (electric and gas)
- Interior features: Double vanity; Kitchen open to family room; Primary bedroom with private bath; Separate shower; Tub with shower
- Laundry & utility: Washer hookup; Electric dryer hookup; Gas dryer hookup
Neighborhood map
What this means for you Summary
Snapshot
- This is a 4-bed/2.5-bath single-family listed at $279k. Condition is rated good.
Deal economics
- At list price, monthly cash flow is $-291 ($-3k/yr) — negative.
- To cash-flow at today's rent, offer at most $274k (1.5% below list).
- To meet the 1% rule (rent ≥ 1% of price), the offer needs to be $244k (12.3% below list).
- Recommended offer: $244k (12.3% below list) — sets the bar for 1% rule.
- Cap rate 5.2% vs local median 2.3% in The Woodlands — top-decile yield for the area; either an underpriced asset or a hidden risk that comps aren't pricing in. Stress-test before assuming the spread holds.
Location & tenants
- Location reads 91/100 on livability (#1 in TX, #47 nationally) — a professional / high-income tenant draw. Strengths: amenities A+, commute A+, employment A+; Watch: cost of living D-.
- Magnolia ISD (rural): math 42% / reading 45% proficiency, ranked #247 of 826 in TX (top 30%) — families likely to look elsewhere, expect single-tenant / working-renter base with shorter leases.
- Zoned schools: Magnolia Parkway El (math 38% / reading 46%, grade F, #1,335 of 4,322 statewide, top 33%, 776 students, 45% FRL); Magnolia H S (math 47% / reading 62%, grade C-, #379 of 1,632 statewide, top 26%, 2,248 students, 31% FRL) — zoned schools at 38% FRL track the district average.
- Market conditions: Rents flat; 1604 active listings in the ZIP; 2 comparable units currently listed for rent nearby; high-income renter base; 13,259 units permitted in Montgomery County in 2024 (1,402 in 5+ unit buildings).
Forward outlook
- In year one you build about $34k of equity ($2k loan paydown + $32k appreciation (10.0% local appreciation)).
- Montgomery County population projected at +65% by 2050 — long-run rental-demand tailwind backs the buy-and-hold thesis.
- By year 2, paydown + projected appreciation supports a ~$54k cash-out refi (75% LTV) — recoverable capital for the next deal without selling this one.
Negotiation context
- Only 14 days on market — expect competitive offers; lowballing is unlikely to land.
- 2 sale attempts; this cycle's ask has dropped $20k (7%) from the opening price — seller is motivated, your offer sets the floor, not the list.
Risks & watch-outs
- Climate carrying-cost: severe wind risk, 99% chance of damaging wind over 30y; moderate wildfire risk; extreme-heat days projected 7→24/yr by 2055 (HVAC capex compounding) — expect insurance premiums to compound above CPI over the hold.
Questions for the listing agent
- What do current leases actually rent for vs. the listed asking? Can we see a recent rent roll and the last 12 months of T-12 income?
- What does the HOA fee cover, when was the last increase, and are there any pending special assessments or reserve-fund shortfalls?
- Is there a deadline driving the sale (1031 exchange, divorce, estate, relocation)? That informs how much negotiation room exists.
- Schools are A-rated — typically a magnet for longer-tenancy family renters. What's the average tenant stay here, and is there a school-zone premium baked into asking?
- The area grade is low — what's the realistic commute time and amenity access for the typical tenant pool here? Any planned neighborhood developments (good or bad) we should know about?
- What's the average days-on-market for RENTAL listings here right now (not sales)? A rising rental-DOM trend means longer vacancies and softer asking-rent achievability than the comps imply.
- What's the recent tenant-quality profile in this submarket — average credit score on applications, eviction rate, late-payment / NSF rate, and stable-employment percentage? A property-management company in the area should have these aggregated.
- How much new for-sale + rental construction is in the pipeline within 1–3 miles? Heavy new supply typically softens prices + rents 12–24 months out; constrained supply supports both.
Investment metrics
- 1% rule
- 0.77% ✗
- Cap rate
- 5.19%
- Cash-on-cash
- -3.94%
- DSCR
- 0.82
- GRM
- 10.8
CMA / ARV
- ARV (on-the-fly)
- $316,616
- Comps found
- 12
Show comp detail 12 sales within ~0.75 mi
| Address | Dist | Beds/Ba | Sqft | Sold | Price | $/sf | Match |
|---|---|---|---|---|---|---|---|
| 11685 Lazy Oak Creek Dr | 0.00mi | 4/2.5 | 2,083 (0%) | 1mo | $278,540 | $134 | 99 |
| 11692 Lazy Oak Creek Dr | 0.03mi | 4/2.5 | 2,083 (0%) | 1mo | $361,990 | $174 | 98 |
| 11705 Lazy Oak Creek Dr | 0.11mi | 4/2.5 | 2,083 (0%) | 2mo | $358,990 | $172 | 93 |
| 11983 Noble Wood Village Dr | 0.09mi | 4/2.5 | 1,979 (-5%) | 2mo | $300,990 | $152 | 86 |
| 12024 Noble Wood Village Dr | 0.09mi | 4/2.5 | 1,979 (-5%) | 2mo | $300,990 | $152 | 86 |
| 12003 Noble Wood Village Dr | 0.39mi | 4/2.5 | 1,979 (-5%) | 3mo | $300,990 | $152 | 71 |
| 12014 Noble Wood Village Dr | 0.39mi | 4/2.5 | 1,979 (-5%) | 3mo | $298,990 | $151 | 71 |
| 12044 Noble Wood Village Dr | 0.39mi | 4/2.5 | 1,979 (-5%) | 4mo | $300,990 | $152 | 70 |
| 12035 Noble Wood Village Dr | 0.39mi | 4/2.5 | 1,979 (-5%) | 4mo | $298,990 | $151 | 70 |
| 12064 Noble Wood Village Dr | 0.39mi | 4/2.5 | 1,979 (-5%) | 4mo | $302,990 | $153 | 70 |
| 12055 Noble Wood Village Dr | 0.39mi | 4/2.5 | 1,979 (-5%) | 4mo | $298,990 | $151 | 70 |
| 29985 Stony Forest Dr | 0.74mi | 3/3.0 (-1) | 1,856 (-11%) | 4mo | $349,990 | $189 | 37 |
Match score weights: distance 35% · size 25% · config 20% · recency 20%. Top-matched comps best support the ARV.
Projected returns pro-forma
10.0% appreciation · 0.32% rent growth · sell at horizon
- IRR
- 20.7%
- Equity multiple
- 2.66×
- Total profit
- $147,534
- Equity at exit
- $285,233
- IRR
- 18.3%
- Equity multiple
- 5.94×
- Total profit
- $437,515
- Equity at exit
- $615,115
Cash invested: $88,652 (down + closing). Projections, not guarantees.
Landlord ↔ Tenant lean methodology
- Overall (STATE)
- 87 Strongly Landlord-Friendly
- State Texas
- 87 Strongly Landlord-Friendly · R+5
- County
- — inherits STATE
- City
- — inherits STATE
ZIP-level market 77354
- Home prices YoY
- 2.4%
- Rents YoY
- 0.3%
- Active inventory
- 1604
- Price-to-rent
- 9.5×
Monthly cashflow live
- Estimated rent
- $2,443 medium interval (Pro) →
- Mortgage (P&I)
- −$1,660
- Tax est. 1.5%
- −$396 /mo · $4,749/yr
- Insurance
- −$132
- HOA
- −$33
- Vacancy / Maint / Mgmt
- −$513
- Net cashflow
- $-291
Break-even live
UW: 25.0% down · 7.5% · 30yr · 1.5% tax · 5.0% vac · 8.0% maint · 8.0% mgmt
Financing live
Cash to close
- Down payment
- $79,154
- Closing costs
- $9,498
- Reserves months
- —
- Total cash needed
- —
Loan-product check · same deal, 3 products live
Conventional
25% down · 7.5% · 30yr
- Down + closing
- —
- Monthly P&I
- —
- Monthly cashflow
- —
- DSCR
- —
- Eligible?
- —
Personal DTI + credit; lowest rate.
DSCR
20% down · 8.5% · 30yr
- Down + closing
- —
- Monthly P&I
- —
- Monthly cashflow
- —
- DSCR
- —
- Eligible?
- —
No personal income docs; deal must DSCR.
Hard money
10% down · 12.0% · 12mo
- Down + closing
- —
- Monthly P&I
- —
- Monthly cashflow
- —
- DSCR
- —
- Eligible?
- —
Short-term bridge; refi at stabilization.
Rent comps 2 comps
| Address | Beds | Baths | Sqft | Rent | $/sqft | DOM | Units | Dist |
|---|---|---|---|---|---|---|---|---|
| 12035 Noble Wood Village DR Magnolia, TX | 4.0 | 2.5 | 1979 | $2,150 | $1.09 | 43d | 1 | 0.39mi |
| 30314 Ruby Forest Ct Magnolia, TX | 3.0 | 2.0 | 1650 | $2,595 | $1.57 | 43d | 1 | 0.78mi |
HOA detail
- Monthly dues
- $33 · $396/yr
Listing history 6 events
-
2026-04-20status Pending
-
2026-04-13price $278,540
-
2026-04-09price $283,490
-
2026-04-06$298,740 Active
-
2026-04-06historical
-
2026-03-31$298,740 Active
ⓘ Source: listings_history table (triggers on properties + properties_extension) + one-shot
backfill from property_details.listing_events for pre-trigger history.
Climate risk First Street
- Flood 1/10 Low FEMA zone X (unshaded) · 0% chance over 30 yrs
- Wildfire 5/10 Major
- Heat 8/10 Severe 7 d/yr ≥111°F today · 24 d/yr by 30 yrs out
- Wind 8/10 Severe 99% chance of damaging wind over 30 yrs
- Air quality 2/10 Low 2 unhealthy d/yr today · 2 by 30 yrs out
Nearby sold comps map
Loading sold comps map…
Walkable amenities ~0.75 mi
Loading nearby amenities…
Taxation est. · year 1
- Rental income
- $29,315
- − Mortgage interest
- −$17,735
- − Property taxes
- −$4,749
- − Insurance
- −$1,583
- − Repairs & maintenance
- −$2,345
- − Management
- −$2,345
- − HOA
- −$396
- − Depreciation
- −$9,211
- Taxable loss
- −$9,050
- Est. tax savings @ 24.0%
- +$2,172
- After-tax cash flow
- $-1,322/yr
For passive investors: Depreciation is non-cash, so a rental often shows a tax loss while cash-flowing — sheltering income. Rental losses are passive: they offset passive income freely, and up to $25,000/yr can offset ordinary (W-2) income if you actively participate and your MAGI is under $100k (phasing out to $0 by $150k); unused losses carry forward. On sale, claimed depreciation is recaptured at up to 25%, and gains may owe capital-gains tax (a 1031 exchange can defer both). Figures are a year-1 estimate at your 24.0% rate — not tax advice; consult a CPA.
Condition & rehab AI · 12 photos
This two-story home is in excellent condition with a modern design and ample space. It is move-in ready and has the potential for further value increases through minor updates.
Value-add opportunities
- Both Painting the exterior brick facade — Enhances curb appeal and can increase both resale and rental value.
- Both Updating the flooring in the bedrooms — Improves the aesthetic and can increase both resale and rental value.
- Both Upgrading the kitchen appliances — Modernizes the kitchen and can increase both resale and rental value.
- Both Adding smart home features — Enhances convenience and can increase both resale and rental value.
Renovation cost estimate screening
Value-add ROI direction
- Both Painting the exterior brick facade — Enhances curb appeal and can increase both resale and rental value. ↑
- Both Updating the flooring in the bedrooms — Improves the aesthetic and can increase both resale and rental value. ↑
- Both Upgrading the kitchen appliances — Modernizes the kitchen and can increase both resale and rental value. ↑
- Both Adding smart home features — Enhances convenience and can increase both resale and rental value. ↑
ⓘ Cost ranges are severity-bucket heuristics (US national rule-of-thumb). Get contractor quotes + a written scope before underwriting a rehab budget.
Schools (NCES district)
- District
- Magnolia ISD
- NCES district ID
- 4828740
- Math proficiency
- 42% ▼ -7.00%
- Reading proficiency
- 45% ▼ -4.00%
- Median HH income
- $71,692
- Composite
- 39.46/100
- National rank
- #3958
- State rank
- #247 of 826 in TX
Livability — The Woodlands
- Score
- 91/100
- State rank
- #1
- US rank
- #47
Category grades
Schools grade is shown separately in the Schools card above.
Census & demographics
- County
- Montgomery County · 663,713 people
- City population
- 106,505
- Metro
- Houston-The Woodlands-Sugar Land, TX
- Population (ZIP)
- 44,900
- Household income
- $112,504
- Rent vs Own
- Severe rent burden
- 586.0
Population outlook (Montgomery County) Hauer SSP2
- Today (2025)
- 713,896 people
- By 2030
- 805,263 · +12.8%
- By 2040
- 992,708 · +39.1%
- By 2050
- 1,179,590 · +65.2%
- By 2075
- 1,628,084 · +128.1%
- By 2100
- 1,937,880 · +171.5%
Race, ethnicity, and origin ACS 2023
- Neighborhood character
- Predominantly White (66%)
- Race & ethnicity
- White 66% Hispanic / Latino 25% Two or more races 18% Black 3% Asian 1%
- Hispanic origin (detail)
- Mexican 14% Puerto Rican 1%
- Common ancestry
- Lithuanian 4% Slovak 2% Italian 2%
- Foreign-born
- 11% · Canada, Vietnam
- Languages at home
- 83% English-only · Spanish 15% Other Indo-European 1% German/W. Germanic 1%
Political lean MEDSL · Montgomery
- 2024 margin
- Solid R (+45.5) · D 26.8% · R 72.3%
- 2008→2024 swing
- +7.2pp toward D · 2008: -52.7pp · 2024: -45.5pp
- All cycles
- 2024: R+45.5 2020: R+43.8 2016: R+51.4 2012: R+60.7 2008: R+52.7
Not yet ingested
- Civics
- —
Market trends
- HPI YoY
- ▲ 12.09%
- Current HPI
- 512.87
- Rent YoY
- ▲ 0.32%
- Metro
- Houston-The Woodlands-Sugar Land, TX
- State GDP YoY
- ▲ 3.95%
- F500 in state
- 110
Industry mix (Fortune 500 HQ in TX)
| Industry | F500 HQs | Revenue |
|---|---|---|
| Energy | 16 | $1,198B |
|
||
| Technology | 5 | $198B |
|
||
| Engineering / Construction | 4 | $72B |
|
||
| Energy Services | 3 | $60B |
|
||
| Utilities | 3 | $41B |
|
||
| Healthcare | 2 | $330B |
|
||
Price history
-6.8% since first listed6 events — show timeline
- 2026-04-20 Pending — HARMLS
- 2026-04-13 Price Changed $278,540 HARMLS
- 2026-04-09 Price Changed $283,490 HARMLS
- 2026-04-06 Listing Removed — HARMLS
- 2026-04-06 Listed $298,740 HARMLS
- 2026-03-31 Listed $298,740 HARMLS
Cash-flow waterfall
monthlySold comps — $/sqft
last 12 mo · ≤1 miLoading sold comps…