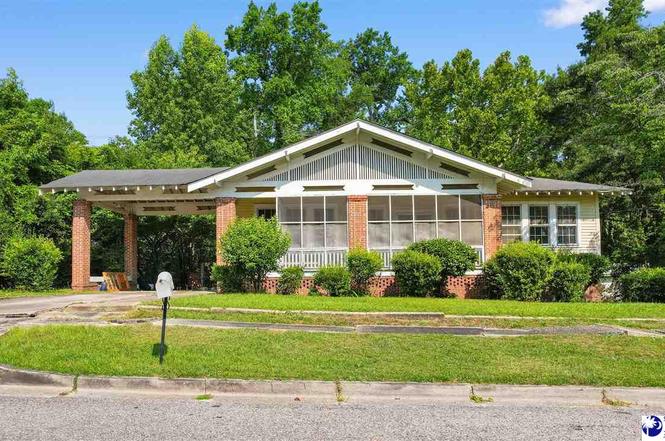
120 Rodgers Ave · Lake City, SC
Flood risk 6/10 · Moderate
- FEMA flood zone
- X (unshaded)
- Chance of flooding over 30 yrs
- 0.71%
- Est. flood insurance / yr
- $473 – $860
Fire risk 6/10 · Moderate
- Est. fire insurance / yr
- $783 – $1,453
Heat risk 8/10 · Major
- Hot days now (above 108°F)
- 7 days/yr
- Hot days in 30 yrs
- 16 days/yr
Wind risk 8/10 · Major
- Chance of severe wind over 30 yrs
- 80.0%
Air-quality risk 2/10 · Minimal
- Unhealthy air days now
- 2 days/yr
- Unhealthy air days in 30 yrs
- 2 days/yr
Risk factors via First Street. Map © Google.
Why this score? — see what drove the C grade
The composite is a weighted blend of 9 inputs, each scored 0–100. Each bar is that input's sub-score; the figure is the points it added to the 100-point composite (weight × sub-score).
- Cash flow +25.1/30.0
- DSCR +8.2/10.0
- ARV discount +7.5/15.0
- 1% rule +5.7/10.0
- Livability +3.3/5.0
- Rent growth +2.5/5.0
- Condition / age +2.5/5.0
- Schools +1.8/10.0
- Appreciation +0.0/10.0
$115,000
🖨 Deal sheet (PDF) 📄 Offer letter ✓ Due diligence
Listing remarks
Charming Historic-Style Home in the Heart of Lake City Welcome to this beautiful historic-style gem, nestled on a spacious 0.28-acre lot in the vibrant heart of Lake City. An investor’s dream, this home offers endless potential to bring your design vision to life. Step through elegant French doors into a spacious family room that flows seamlessly into an open-concept dining area—perfect for entertaining. The large kitchen features a cozy breakfast nook, a pantry, and convenient attic storage tucked just behind it. This classic residence boasts three generously sized bedrooms and three full bathrooms, combining comfort with timeless character. Enjoy your mornings in the sunroom
Key facts
- Elegant french doors
- Cozy breakfast nook
- Spacious lot
Tags
Property features AI
Exterior
- Parking: Garage with 2 spaces
- Utilities: Public water; Public sewer
- Home design: Single-family residence; Residential property
- Construction: Wood siding construction
- Exterior features: Porch with screened area; Storm door(s); Shingle roof
Interior
- Flooring: Vinyl; Wood
- Bathrooms: 3 full bathrooms
- Heating & cooling: Ceiling fan(s) for cooling
- Interior features: Vinyl and wood flooring; Fireplace (1); Crawl space basement
Neighborhood map
What this means for you Summary
Snapshot
- This is a 3-bed/2.5-bath townhouse listed at $115k.
Deal economics
- At list price, monthly cash flow is $255 ($3k/yr) — positive.
- The deal already cash-flows at list — no discount required.
- Meets the 1% rule at list price ($1k rent vs $115k).
- Recommended offer: $101k (12.0% below list) — sets the bar for market timing.
Location & tenants
- Location reads 66/100 on livability (#124 in SC) — a middle-class / working-renter tenant base. Strengths: cost of living A+, housing A+, health & safety A+; Watch: crime F, commute F, employment D-.
- Florence 03 (town): math 16% / reading 27% proficiency, ranked #67 of 80 in SC (top 84%) — low school quality limits family demand, transient renter base, plan for 1-2y turnover; 83% free/reduced lunch — lower-income household profile, screen leases tightly.
- Zoned schools: Main Street Elementary (math 7% / reading 13%, grade F, #582 of 597 statewide, top 98%, 334 students, 100% FRL); Ronald E. Mcnair Jr. High (math 7% / reading 13%, grade F, #221 of 229 statewide, top 97%, 209 students, 100% FRL); Lake City High (math 17% / reading 57%, grade F, #183 of 196 statewide, top 94%, 592 students, 100% FRL) — zoned schools average 100% FRL vs 83% district-wide (17 pts higher); higher-poverty schools than district average — tighter screening recommended.
- Market conditions: 68 active listings in the ZIP; 657 units permitted in Florence County in 2024 (40 in 5+ unit buildings).
Forward outlook
- Local home prices are declining (-3.0%/yr); year-one equity from $795 of loan paydown is wiped out by about $3k of value loss. Plan a longer hold.
Negotiation context
- It's been on market 360 days — a 12% lower offer ($101k) is reasonable based on typical stale-listing flexibility.
- 3 sale attempts; this cycle's ask has dropped $10k (8%) from the opening price — seller is motivated, your offer sets the floor, not the list.
- Current owner paid $76k; list at $115k implies a 50% gain — meaningful room to come down on a strong offer.
Risks & watch-outs
- Watch-outs: built in 1918 — expect roof / HVAC / electrical / plumbing capex.
- Climate carrying-cost: major flood risk; severe wind risk, 80% chance of damaging wind over 30y; major wildfire risk; extreme-heat days projected 7→16/yr by 2055 (HVAC capex compounding) — expect insurance premiums to compound above CPI over the hold.
Questions for the listing agent
- It's been on market 360 days. Have you received any prior offers? Is the seller open to a 12% concession, seller financing, or rate buy-down credit?
- Built in 1918 — when were the roof, HVAC, electrical panel, plumbing, and water heater last replaced?
- Why hasn't it sold? Are there any deal-killer items the seller is aware of (foundation, flood, title, zoning, code violations)?
- Is there a deadline driving the sale (1031 exchange, divorce, estate, relocation)? That informs how much negotiation room exists.
- Schools are F-rated, which usually means shorter tenancies and higher turnover. Who's the typical renter profile here, and what's been the actual vacancy rate?
- Crime grade is F in this area — have there been break-ins, vandalism, or insurance claims at this property in the last 3 years? What carrier currently insures it and at what premium?
- What's the average days-on-market for RENTAL listings here right now (not sales)? A rising rental-DOM trend means longer vacancies and softer asking-rent achievability than the comps imply.
- What's the recent tenant-quality profile in this submarket — average credit score on applications, eviction rate, late-payment / NSF rate, and stable-employment percentage? A property-management company in the area should have these aggregated.
- How much new for-sale + rental construction is in the pipeline within 1–3 miles? Heavy new supply typically softens prices + rents 12–24 months out; constrained supply supports both.
Investment metrics
- 1% rule
- 1.07% ✓
- Cap rate
- 8.95%
- Cash-on-cash
- 9.50%
- DSCR
- 1.42
- GRM
- 7.8
CMA / ARV
No comps found within radius.
Projected returns pro-forma
-3.0% appreciation · 3.0% rent growth · sell at horizon
- IRR
- -2.0%
- Equity multiple
- 0.92×
- Total profit
- $-2,431
- Equity at exit
- $17,147
- IRR
- 7.7%
- Equity multiple
- 1.58×
- Total profit
- $18,660
- Equity at exit
- $9,943
Cash invested: $32,200 (down + closing). Projections, not guarantees.
Landlord ↔ Tenant lean methodology
- Overall (STATE)
- 90 Strongly Landlord-Friendly
- State South Carolina
- 90 Strongly Landlord-Friendly · R+6
- County
- — inherits STATE
- City
- — inherits STATE
ZIP-level market 29560
- Home prices YoY
- -21.1%
- Active inventory
- 68
- Price-to-rent
- 7.8×
Monthly cashflow live
- Estimated rent
- $1,225 medium interval (Pro) →
- Mortgage (P&I)
- −$603
- Tax from tax record
- −$62 /mo · $740/yr
- Insurance
- −$48
- HOA
- −$0
- Vacancy / Maint / Mgmt
- −$257
- Net cashflow
- $255
Break-even live
Sensitivity live
| Price | -10% $320 | -5% $287 | +0% $255 | +5% $222 | +10% $190 |
|---|---|---|---|---|---|
| Rent | -10% $158 | -5% $207 | +0% $255 | +5% $303 | +10% $352 |
| Rate | -1.0pp $313 | -0.5pp $284 | base $255 | +0.5pp $225 | +1.0pp $195 |
UW: 25.0% down · 7.5% · 30yr · 1.5% tax · 5.0% vac · 8.0% maint · 8.0% mgmt
Financing live
Cash to close
- Down payment
- $28,750
- Closing costs
- $3,450
- Reserves months
- —
- Total cash needed
- —
Loan-product check · same deal, 3 products live
Conventional
25% down · 7.5% · 30yr
- Down + closing
- —
- Monthly P&I
- —
- Monthly cashflow
- —
- DSCR
- —
- Eligible?
- —
Personal DTI + credit; lowest rate.
DSCR
20% down · 8.5% · 30yr
- Down + closing
- —
- Monthly P&I
- —
- Monthly cashflow
- —
- DSCR
- —
- Eligible?
- —
No personal income docs; deal must DSCR.
Hard money
10% down · 12.0% · 12mo
- Down + closing
- —
- Monthly P&I
- —
- Monthly cashflow
- —
- DSCR
- —
- Eligible?
- —
Short-term bridge; refi at stabilization.
Listing history 24 events
-
2026-06-22days on market $115,000 Active 360 DOM
-
2026-06-21days on market $115,000 Active 359 DOM
-
2026-06-21days on market $115,000 Active 358 DOM
-
2026-06-18days on market $115,000 Active 356 DOM
-
2026-06-17days on market $115,000 Active 355 DOM
-
2026-06-16days on market $115,000 Active 354 DOM
-
2026-06-15days on market $115,000 Active 353 DOM
-
2026-06-13days on market $115,000 Active 351 DOM
-
2026-06-12days on market $115,000 Active 350 DOM
-
2026-06-09days on market $115,000 Active 347 DOM
-
2026-06-08days on market $115,000 Active 346 DOM
-
2026-06-08days on market $115,000 Active 345 DOM
-
2026-06-07days on market $115,000 Active 344 DOM
-
2026-06-04days on market $115,000 Active 341 DOM
-
2026-06-02days on market $115,000 Active 340 DOM
-
2026-06-01days on market $115,000 Active 339 DOM
-
2026-05-31days on market $115,000 Active 338 DOM
-
2026-04-01status Active
-
2026-03-12status Active
-
2026-02-26historical Active Under Contract
-
2025-11-01price $115,000
-
2025-06-27$125,000 Active
-
2007-05-08soldstatus $76,500
-
2007-05-08soldstatus $76,500
ⓘ Source: listings_history table (triggers on properties + properties_extension) + one-shot
backfill from property_details.listing_events for pre-trigger history.
Tax reassessment forecast SC · Resets to sale price
- Current annual tax
- $740 · $62/mo
- Projected year-2 tax
- $740 · $62/mo
- Expected delta
- $0/yr ($0/mo · 0.0%)
ⓘ Screening estimate from a state-policy table — verify with the county assessor before closing.
Climate risk First Street
- Flood 6/10 Major FEMA zone X (unshaded) · 71% chance over 30 yrs
- Wildfire 6/10 Major
- Heat 8/10 Severe 7 d/yr ≥108°F today · 16 d/yr by 30 yrs out
- Wind 8/10 Severe 80% chance of damaging wind over 30 yrs
- Air quality 2/10 Low 2 unhealthy d/yr today · 2 by 30 yrs out
Nearby sold comps map
Loading sold comps map…
Walkable amenities ~0.75 mi
Loading nearby amenities…
Taxation est. · year 1
- Rental income
- $14,698
- − Mortgage interest
- −$6,442
- − Property taxes
- −$740
- − Insurance
- −$575
- − Repairs & maintenance
- −$1,176
- − Management
- −$1,176
- − Depreciation
- −$3,345
- Taxable income
- $1,244
- Est. tax owed @ 24.0%
- −$298
- After-tax cash flow
- $2,761/yr
For passive investors: Depreciation is non-cash, so a rental often shows a tax loss while cash-flowing — sheltering income. Rental losses are passive: they offset passive income freely, and up to $25,000/yr can offset ordinary (W-2) income if you actively participate and your MAGI is under $100k (phasing out to $0 by $150k); unused losses carry forward. On sale, claimed depreciation is recaptured at up to 25%, and gains may owe capital-gains tax (a 1031 exchange can defer both). Figures are a year-1 estimate at your 24.0% rate — not tax advice; consult a CPA.
Schools (NCES district)
- District
- Florence 03
- NCES district ID
- 4502190
- Math proficiency
- 16% ▼ -8.00%
- Reading proficiency
- 27% ▼ -5.00%
- Median HH income
- $33,207
- Composite
- 17.51/100
- National rank
- #9053
- State rank
- #67 of 80 in SC
Livability — Lake City
- Score
- 66/100
- State rank
- #124
- US rank
- #12348
Category grades
Schools grade is shown separately in the Schools card above.
Census & demographics
- Census place
- Lake City, SC
- Population (ZIP)
- 12,284
Population outlook (Florence County) Hauer SSP2
- Today (2025)
- 141,714 people
- By 2030
- 142,121 · +0.3%
- By 2040
- 141,344 · -0.3%
- By 2050
- 139,478 · -1.6%
- By 2075
- 132,275 · -6.7%
- By 2100
- 118,374 · -16.5%
Race, ethnicity, and origin ACS 2023
- Neighborhood character
- Majority Black (55%)
- Race & ethnicity
- Black 55% White 39% Two or more races 4% Hispanic / Latino 1%
- Common ancestry
- Serbian 3% Slovak 1% Italian 1%
- Foreign-born
- 1% · Canada
- Languages at home
- 98% English-only · Spanish 2%
Political lean MEDSL · Florence
- 2024 margin
- Lean R (+8.0) · D 45.3% · R 53.3% · Other 1.3%
- 2008→2024 swing
- -4.8pp toward R · 2008: -3.2pp · 2024: -8.0pp
- All cycles
- 2024: R+8.0 2020: R+2.3 2016: R+5.0 2012: R+0.5 2008: R+3.2
Not yet ingested
- Civics
- —
Market trends
- HPI YoY
- ▼ -45.93%
- Current HPI
- 172.1796
- Rent YoY
- —
- Metro
- —
- State GDP YoY
- ▲ 4.51%
- F500 in state
- 2
Industry mix (Fortune 500 HQ in SC)
| Industry | F500 HQs | Revenue |
|---|---|---|
| Packaging | 1 | $7B |
|
||
Price history
+50.3% since first listed7 events — show timeline
- 2026-04-01 Relisted — RAGPD
- 2026-03-12 Relisted — RAGPD
- 2026-02-26 Contingent — RAGPD
- 2025-11-01 Price Changed $115,000 RAGPD
- 2025-06-27 Listed $125,000 RAGPD
- 2007-05-08 Sold (Public Records) $76,500 Public Records
- 2007-05-08 Sold (Public Records) $76,500 Public Records
Property tax history
+3.5%/yrLatest (2025): $740 · +20.8% YoY. Source: county tax records.
Cash-flow waterfall
monthlySold comps — $/sqft
last 12 mo · ≤1 miLoading sold comps…