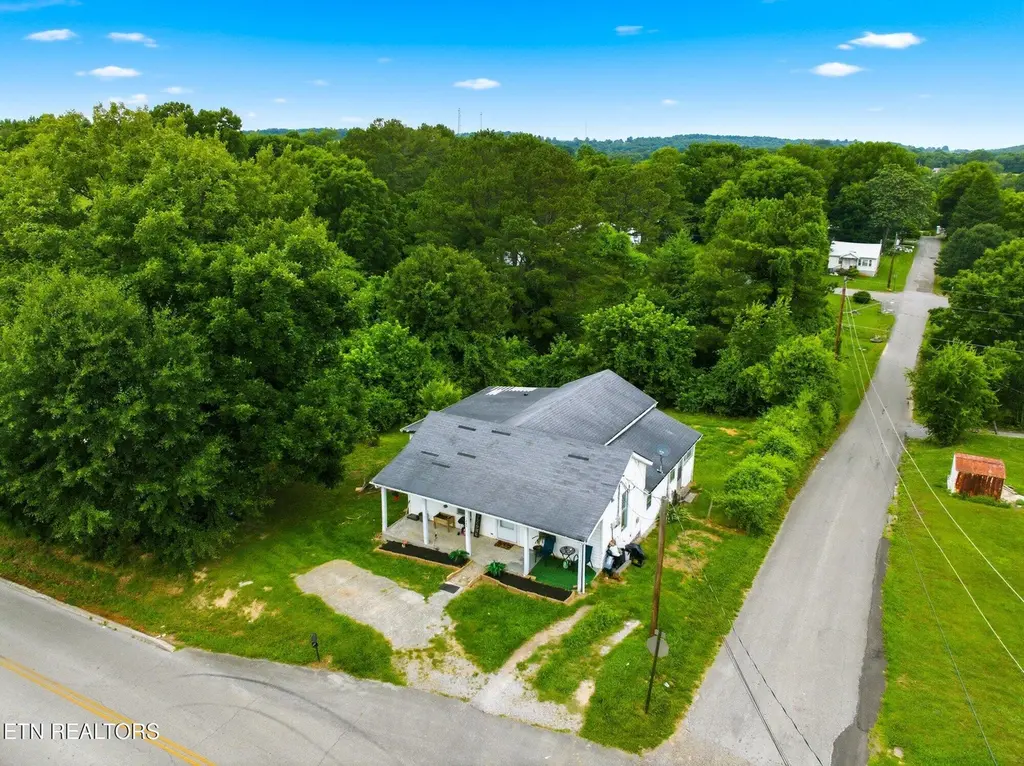
1002 Mccaslin Ave Unit 023G C 014.01 · Sweetwater, TN
Flood risk 1/10 · Minimal
- FEMA flood zone
- X (unshaded)
- Chance of flooding over 30 yrs
- 0.0%
- Est. flood insurance / yr
- $473 – $860
Fire risk 4/10 · Minor
- Est. fire insurance / yr
- $949 – $1,763
Heat risk 6/10 · Moderate
- Hot days now (above 104°F)
- 7 days/yr
- Hot days in 30 yrs
- 21 days/yr
Wind risk 2/10 · Minimal
- Chance of severe wind over 30 yrs
- 2.0%
Air-quality risk 3/10 · Minor
- Unhealthy air days now
- 2 days/yr
- Unhealthy air days in 30 yrs
- 2 days/yr
Risk factors via First Street. Map © Google.
Why this score? — see what drove the C- grade
The composite is a weighted blend of 9 inputs, each scored 0–100. Each bar is that input's sub-score; the figure is the points it added to the 100-point composite (weight × sub-score).
- Cash flow +23.4/30.0
- DSCR +7.5/10.0
- ARV discount +7.5/15.0
- 1% rule +6.1/10.0
- Livability +3.3/5.0
- Rent growth +2.5/5.0
- Condition / age +2.2/5.0
- Schools +2.0/10.0
- Appreciation +0.0/10.0
$225,000
🖨 Deal sheet 📄 Offer letter ✓ Due diligence
Listing remarks
Opportunity awaits in the heart of Sweetwater! This spacious home offers plenty of room to grow and is full of potential for its next owners. Featuring 2 bedrooms, 2 full bathrooms, and a large bonus room that provides flexible space for a second living area, playroom, home office, hobby room, or entertainment space, this property is an excellent option for first-time buyers, investors, or anyone looking to make a home their own over time. Inside, you'll find generous living spaces, an eat-in kitchen, a large laundry room, walk-in closets, and a welcoming front porch perfect for enjoying your morning coffee or relaxing in the evenings. The home's septic system has been recently updated, pro
Key facts
- 0.86 acre lot
- Built 1920
- Listed 3 days
Property features AI
Finance
- Other: Lot size about 0.86 acre (tax records)
- Financial info: Details not specified
- HOA & community: Details not specified
Exterior
- Parking: Off-street parking
- Security: Details not specified
- Utilities: Septic sewer
- Home design: Single-family, not attached; 1,511 building area (owner reported)
- Construction: Block construction; Crawl space basement
- Exterior features: Vinyl windows; Corner lot; City view
Interior
- Kitchen: Refrigerator included
- Bedrooms: Details not specified
- Flooring: Laminate; Carpet; Hardwood
- Bathrooms: 2 full bathrooms
- Heating & cooling: Heat pump and natural gas heating; Central cooling
- Interior features: Walk-in closet(s); Eat-in kitchen; 8 total rooms
- Laundry & utility: Details not specified
Neighborhood map
What this means for you Summary
Snapshot
- This is a 2-bed/2.0-bath single-family listed at $225k. Condition is rated fair.
Deal economics
- At list price, monthly cash flow is $416 ($5k/yr) — positive.
- The deal already cash-flows at list — no discount required.
- Meets the 1% rule at list price ($2k rent vs $225k).
- Cap rate 8.5% vs local median 4.1% in Sweetwater — top-decile yield for the area; either an underpriced asset or a hidden risk that comps aren't pricing in. Stress-test before assuming the spread holds.
Location & tenants
- Location reads 66/100 on livability (#134 in TN) — a middle-class / working-renter tenant base. Strengths: cost of living A+, housing A+; Watch: health & safety C-, amenities F, commute F.
- Sweetwater (rural): math 25% / reading 24% proficiency, ranked #94 of 139 in TN (top 68%) — low school quality limits family demand, transient renter base, plan for 1-2y turnover; 61% free/reduced lunch — lower-income household profile, screen leases tightly.
- Zoned schools: Sweetwater Elementary (math 40% / reading 35%, grade F, #269 of 952 statewide, top 28%, 299 students, 0% FRL); Sweetwater Jr High School (math 11% / reading 18%, grade F, #231 of 333 statewide, top 70%, 322 students, 0% FRL) — zoned schools average 0% FRL vs 61% district-wide (61 pts lower); this property's tenant base skews higher-income than the district average.
- Market conditions: 137 active listings in the ZIP; 1 comparable units currently listed for rent nearby; 157 units permitted in Monroe County in 2024 (0 in 5+ unit buildings).
Forward outlook
- Local home prices are declining (-3.0%/yr); year-one equity from $2k of loan paydown is wiped out by about $7k of value loss. Plan a longer hold.
Negotiation context
- Only 3 days on market — expect competitive offers; lowballing is unlikely to land.
Risks & watch-outs
- Watch-outs: built in 1920 — expect roof / HVAC / electrical / plumbing capex.
- Climate carrying-cost: extreme-heat days projected 7→21/yr by 2055 (HVAC capex compounding) — expect insurance premiums to compound above CPI over the hold.
Questions for the listing agent
- Have any recent inspections been done? Can we get a copy of the seller's disclosures and any deferred-maintenance estimates?
- Built in 1920 — when were the roof, HVAC, electrical panel, plumbing, and water heater last replaced?
- Is there a deadline driving the sale (1031 exchange, divorce, estate, relocation)? That informs how much negotiation room exists.
- Schools are F-rated, which usually means shorter tenancies and higher turnover. Who's the typical renter profile here, and what's been the actual vacancy rate?
- What's the average days-on-market for RENTAL listings here right now (not sales)? A rising rental-DOM trend means longer vacancies and softer asking-rent achievability than the comps imply.
- What's the recent tenant-quality profile in this submarket — average credit score on applications, eviction rate, late-payment / NSF rate, and stable-employment percentage? A property-management company in the area should have these aggregated.
- How much new for-sale + rental construction is in the pipeline within 1–3 miles? Heavy new supply typically softens prices + rents 12–24 months out; constrained supply supports both.
Investment metrics
- 1% rule
- 1.11% ✓
- Cap rate
- 8.51%
- Cash-on-cash
- 7.93%
- DSCR
- 1.35
- GRM
- 7.5
CMA / ARV
No comps found within radius.
Projected returns pro-forma
-3.0% appreciation · 3.0% rent growth · sell at horizon
- IRR
- -4.2%
- Equity multiple
- 0.84×
- Total profit
- $-9,919
- Equity at exit
- $33,548
- IRR
- 5.5%
- Equity multiple
- 1.41×
- Total profit
- $25,643
- Equity at exit
- $19,454
Cash invested: $63,000 (down + closing). Projections, not guarantees.
Landlord ↔ Tenant lean methodology
- Overall (STATE)
- 87 Strongly Landlord-Friendly
- State Tennessee
- 87 Strongly Landlord-Friendly · R+13
- County
- — inherits STATE
- City
- — inherits STATE
ZIP-level market 37874
- Home prices YoY
- -5.4%
- Active inventory
- 137
- Price-to-rent
- 7.5×
Monthly cashflow live
- Estimated rent
- $2,495 medium interval (Pro) →
- Mortgage (P&I)
- −$1,180
- Tax est. 1.5%
- −$281 /mo · $3,375/yr
- Insurance
- −$94
- HOA
- −$0
- Vacancy / Maint / Mgmt
- −$524
- Net cashflow
- $416
Break-even live
UW: 25.0% down · 7.5% · 30yr · 1.5% tax · 5.0% vac · 8.0% maint · 8.0% mgmt
Financing live
Cash to close
- Down payment
- $56,250
- Closing costs
- $6,750
- Reserves months
- —
- Total cash needed
- —
Loan-product check · same deal, 3 products live
Conventional
25% down · 7.5% · 30yr
- Down + closing
- —
- Monthly P&I
- —
- Monthly cashflow
- —
- DSCR
- —
- Eligible?
- —
Personal DTI + credit; lowest rate.
DSCR
20% down · 8.5% · 30yr
- Down + closing
- —
- Monthly P&I
- —
- Monthly cashflow
- —
- DSCR
- —
- Eligible?
- —
No personal income docs; deal must DSCR.
Hard money
10% down · 12.0% · 12mo
- Down + closing
- —
- Monthly P&I
- —
- Monthly cashflow
- —
- DSCR
- —
- Eligible?
- —
Short-term bridge; refi at stabilization.
Rent comps 1 comps
| Address | Beds | Baths | Sqft | Rent | $/sqft | DOM | Units | Dist |
|---|---|---|---|---|---|---|---|---|
| 918 Stratford Ave Sweetwater, TN | 3.0 | 2.0 | 1500 | $2,495 | $1.66 | 23d | 1 | 0.81mi |
Listing history 5 events
-
2026-06-18days on market $225,000 Active 3 DOM
-
2026-06-17days on market $225,000 Active 2 DOM
-
2026-06-15status $225,000 Active 1 DOM
-
2026-06-14remarks 699-char remark
-
2026-06-14$225,000 Coming Soon 1 DOM
ⓘ Source: listings_history table (triggers on properties + properties_extension) + one-shot
backfill from property_details.listing_events for pre-trigger history.
Climate risk First Street
- Flood 1/10 Low FEMA zone X (unshaded) · 0% chance over 30 yrs
- Wildfire 4/10 Moderate
- Heat 6/10 Major 7 d/yr ≥104°F today · 21 d/yr by 30 yrs out
- Wind 2/10 Low 2% chance of damaging wind over 30 yrs
- Air quality 3/10 Moderate 2 unhealthy d/yr today · 2 by 30 yrs out
Nearby sold comps map
Loading sold comps map…
Walkable amenities ~0.75 mi
Loading nearby amenities…
Taxation est. · year 1
- Rental income
- $29,940
- − Mortgage interest
- −$12,603
- − Property taxes
- −$3,375
- − Insurance
- −$1,125
- − Repairs & maintenance
- −$2,395
- − Management
- −$2,395
- − Depreciation
- −$6,545
- Taxable income
- $1,501
- Est. tax owed @ 24.0%
- −$360
- After-tax cash flow
- $4,633/yr
For passive investors: Depreciation is non-cash, so a rental often shows a tax loss while cash-flowing — sheltering income. Rental losses are passive: they offset passive income freely, and up to $25,000/yr can offset ordinary (W-2) income if you actively participate and your MAGI is under $100k (phasing out to $0 by $150k); unused losses carry forward. On sale, claimed depreciation is recaptured at up to 25%, and gains may owe capital-gains tax (a 1031 exchange can defer both). Figures are a year-1 estimate at your 24.0% rate — not tax advice; consult a CPA.
Condition & rehab AI · 1 photo
This home requires significant repairs and updates across multiple systems and areas, making it a moderate renovation project. Improvements in paint, kitchen, flooring, windows, HVAC, and landscaping can significantly increase its value.
Repairs flagged
- Major Kitchen — No photos of the kitchen
- Major Bathrooms — No photos of the bathrooms
- Major Roof — No photos of the roof
- Major Exterior — No photos of the exterior
- Major Flooring — No photos of the flooring
- Major Interior walls/paint — No photos of the interior walls/paint
- Major Windows — No photos of the windows
- Major Foundation/structure — No photos of the foundation/structure
- Major HVAC/mechanicals — No photos of the HVAC/mechanicals
- Major Landscaping/curb appeal — No photos of the landscaping/curb appeal
Value-add opportunities
- Both Paint interior walls and trim — Fresh paint can make a significant difference in the home's appearance and value
- Both Replace kitchen cabinets and appliances — A modern kitchen can attract more buyers and renters
- Both Install new flooring in bathrooms and kitchen — New flooring can improve the home's overall appearance and functionality
- Both Replace windows with energy-efficient ones — New windows can improve energy efficiency and curb appeal
- Both Upgrade HVAC system — A new HVAC system can improve comfort and energy efficiency
- Both Landscaping and curb appeal — A well-maintained yard can enhance the home's curb appeal and attract more buyers
Renovation cost estimate screening
| Repair item | Severity | Est. cost |
|---|---|---|
| Kitchen · No photos of the kitchen | Major | $15,000–50,000 |
| Bathrooms · No photos of the bathrooms | Major | $15,000–50,000 |
| Roof · No photos of the roof | Major | $15,000–50,000 |
| Exterior · No photos of the exterior | Major | $15,000–50,000 |
| Flooring · No photos of the flooring | Major | $15,000–50,000 |
| Interior walls/paint · No photos of the interior walls/paint | Major | $15,000–50,000 |
| Windows · No photos of the windows | Major | $15,000–50,000 |
| Foundation/structure · No photos of the foundation/structure | Major | $15,000–50,000 |
| HVAC/mechanicals · No photos of the HVAC/mechanicals | Major | $15,000–50,000 |
| Landscaping/curb appeal · No photos of the landscaping/curb appeal | Major | $15,000–50,000 |
| Total estimated repair cost · 10 items | $150,000–500,000 |
Value-add ROI direction
- Both Paint interior walls and trim — Fresh paint can make a significant difference in the home's appearance and value ↑
- Both Replace kitchen cabinets and appliances — A modern kitchen can attract more buyers and renters ↑
- Both Install new flooring in bathrooms and kitchen — New flooring can improve the home's overall appearance and functionality ↑
- Both Replace windows with energy-efficient ones — New windows can improve energy efficiency and curb appeal ↑
- Both Upgrade HVAC system — A new HVAC system can improve comfort and energy efficiency ↑
- Both Landscaping and curb appeal — A well-maintained yard can enhance the home's curb appeal and attract more buyers ↑
ⓘ Cost ranges are severity-bucket heuristics (US national rule-of-thumb). Get contractor quotes + a written scope before underwriting a rehab budget.
Schools (NCES district)
- District
- Sweetwater
- NCES district ID
- 4704050
- Math proficiency
- 25% ▼ -9.00%
- Reading proficiency
- 24% ▼ -4.00%
- Median HH income
- $36,993
- Composite
- 20.41/100
- National rank
- #8586
- State rank
- #94 of 139 in TN
Livability — Sweetwater
- Score
- 66/100
- State rank
- #134
- US rank
- #12256
Category grades
Schools grade is shown separately in the Schools card above.
Census & demographics
- Census place
- Sweetwater, TN
- City population
- 16,640
- Population (ZIP)
- 16,640
Population outlook (Monroe County) Hauer SSP2
- Today (2025)
- 47,571 people
- By 2030
- 48,155 · +1.2%
- By 2040
- 48,772 · +2.5%
- By 2050
- 48,698 · +2.4%
- By 2075
- 48,558 · +2.1%
- By 2100
- 47,543 · -0.1%
Race, ethnicity, and origin ACS 2023
- Neighborhood character
- Predominantly White (84%)
- Race & ethnicity
- White 84% Hispanic / Latino 7% Two or more races 7% Black 2%
- Hispanic origin (detail)
- Mexican 6%
- Common ancestry
- Italian 3% Iranian 2% Lithuanian 2%
- Foreign-born
- 3% · Canada, Jamaica, China
- Languages at home
- 94% English-only · Spanish 5%
Political lean MEDSL · Monroe
- 2024 margin
- Solid R (+66.8) · D 16.2% · R 83.0%
- 2008→2024 swing
- -28.5pp toward R · 2008: -38.3pp · 2024: -66.8pp
- All cycles
- 2024: R+66.8 2020: R+62.6 2016: R+59.7 2012: R+45.0 2008: R+38.3
Not yet ingested
- Civics
- —
Market trends
- HPI YoY
- ▼ -19.36%
- Current HPI
- 336.2084
- Rent YoY
- —
- Metro
- —
- State GDP YoY
- ▲ 2.78%
- F500 in state
- 22
Industry mix (Fortune 500 HQ in TN)
| Industry | F500 HQs | Revenue |
|---|---|---|
| Healthcare | 3 | $91B |
|
||
| Retail | 3 | $72B |
|
||
| Transportation / Logistics | 1 | $88B |
|
||
| Paper / Packaging | 1 | $19B |
|
||
| Insurance | 1 | $13B |
|
||
| Energy | 1 | $12B |
|
||
Price history
1 event — show timeline
- 2026-06-13 Coming Soon $225,000 Knoxville MLS
Cash-flow waterfall
monthlySold comps — $/sqft
last 12 mo · ≤1 miLoading sold comps…